Adaro Andalan Indonesia: coal rose 23.7%, yet EBITDA came in 22.5% below what the price implied
Contents
On 11 November Adaro Andalan Indonesia released its third-quarter 2026 results. The average steam coal price in the period was USD 137.1 versus USD 110.8 a year earlier (+23.7%), and spot is now USD 138.9. At that price with the previous quarter's volumes and costs, revenue should have been USD 1,510.2m and EBITDA USD 464m; in fact revenue was USD 1,412.6m, EBITDA USD 359.7m and net profit USD 209.6m. By our calculation the EBITDA gap is USD 104.4m, or 22.5%, meaning the company earned materially less than the coal price allowed. Our conclusion: rather attractive – the portal model puts the upside to fair value at +46%, even though the quarter showed weak price realisation. Our view: the share is rather attractive at the current price; upside on the portal model +46%.
Our view: is there upside
Our view in numbers
| Metric | Our read |
|---|---|
| Verdict | Rather attractive |
| Upside on the portal model | +46% |
| How the model works | spot model: EBITDA re-priced to current commodity prices at the target EV/EBITDA, against market cap |
| EV/EBITDA now and 3-year average | 2.5 vs 2.9 – a 12% discount to its history |
| Dividend yield, 12m | 9.8% |
| Net debt / EBITDA | -0.71 – net cash |
| Strongest case for | A 12% discount to its own three-year average EV/EBITDA and a 9.8% dividend yield with net cash of USD 1.2bn provide a margin of safety. |
| Strongest case against | EBITDA of USD 359.7m came in USD 104.4m, or 22.5%, below the price model, and the gap could recur. |
| What would change the view | If the average coal price holds above USD 137 and the company closes the gap to the price model, the verdict would move one step up to 'attractive'. |
Key takeaways
— The steam coal price rose 23.7% year on year to USD 137.1, and spot at USD 138.9 is above the period average
— By our calculation, at the previous quarter's price and costs EBITDA should have been USD 464m but came in at USD 359.7m – a gap of USD 104.4m
— Revenue of USD 1,412.6m was 6.5% below the price-implied model, and the gap cannot be explained by price alone
— The 25.5% EBITDA margin and 14.8% net margin are the result of weak realisation, not of a falling coal price
— Net cash rose from USD 0.2bn on 30 June to USD 1.2bn on 30 September, with operating cash flow of USD 329.6m for the quarter
— A 9.8% dividend yield against P/E LTM of 5.1 and EV/EBITDA LTM of 2.5 – well below its own 2.9 average
— Reserves support 11 years of production, which limits long-term growth but does not undermine the current yield
Key figures, USD bn
| Metric | — | Q3 2026 | Change |
|---|---|---|---|
| Revenue | — | 1.41 | — |
| EBITDA | — | 0.36 | — |
| Operating profit | — | 0.36 | — |
| Net profit | — | 0.21 | — |
| Operating cash flow | — | 0.33 | — |
| Capex | — | 0.05 | — |
| EBITDA margin | — | 25.5% | — |
| Net margin | — | 14.8% | — |
The steam coal price rose 23.7% year on year to USD 137.1, and spot at USD 138.9 is above the period average
The average steam coal price in the third quarter of 2026 was USD 137.1 versus USD 110.8 a year earlier – a rise of 23.7%. Against the previous quarter the price added 0.7%: USD 136.2 in the second quarter. Spot on 11 November is USD 138.9, 1.3% above the period average.
For a company where coal accounts for 78% of revenue in the portal model, that backdrop was favourable. The price rose not only year on year but also stayed above the previous quarter's level, so expectations for revenue and EBITDA were high. The report showed the company did not fully convert that rise.
Commodity prices: period average and now
| Benchmark | Year ago | Q3 2026 | YoY | Spot 2026-11-11 |
|---|---|---|---|---|
| Steam coal AU, USD | 110,8 | 137,1 | +23,7% | 138,9 |
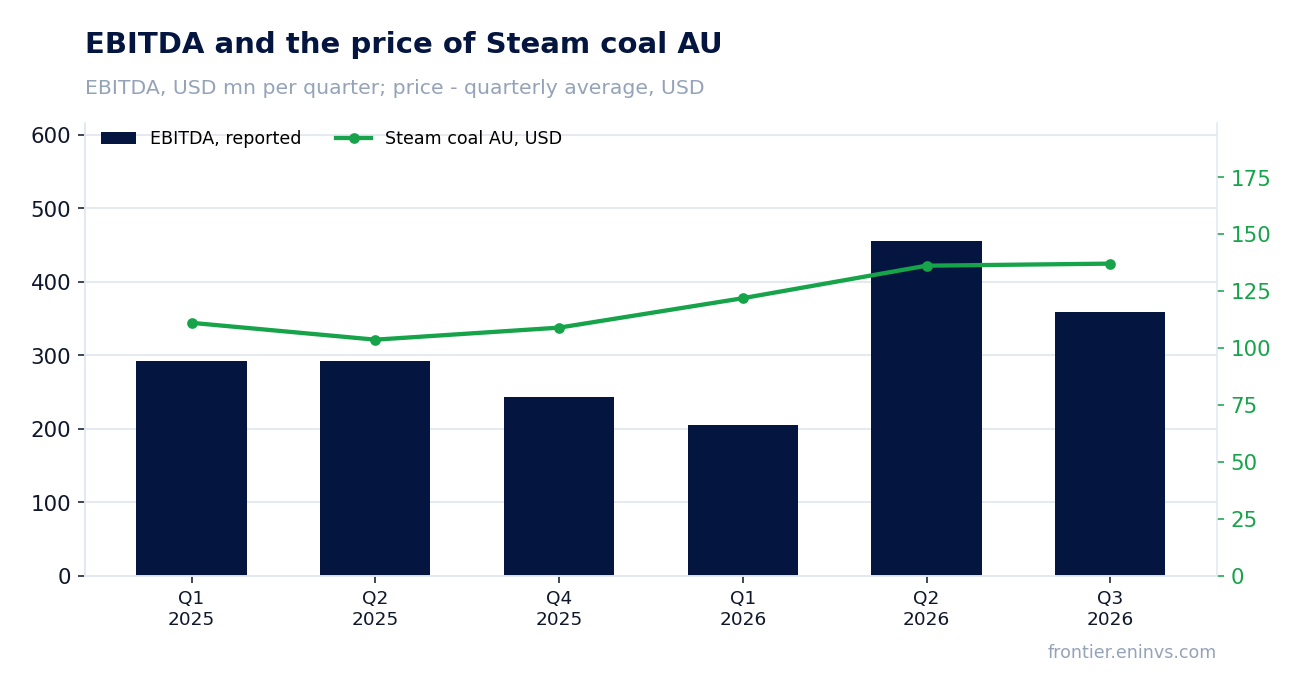
By our calculation, at the previous quarter's price and costs EBITDA should have been USD 464m but came in at USD 359.7m – a gap of USD 104.4m
Taking the second quarter of 2026 volumes and non-commodity costs and moving only the coal price to the third-quarter level, revenue should have been USD 1,510.2m and EBITDA USD 464m. Actual revenue was USD 1,412.6m – USD 97.6m, or 6.5%, lower. Actual EBITDA was USD 359.7m – USD 104.4m, or 22.5%, below the price-implied model.
The EBITDA gap is larger than the revenue gap, so it is not just a volume issue. Part of the shortfall could be a realised price below the benchmark, but the facts give no realised-price data. Another part is costs: with a higher coal price some cost components may have risen, but the source does not disclose the specific lines.
For an investor, the key point is that the company did not show the operating leverage coal miners usually deliver when the price rises. That is the main question from the report, and it carries over into the next quarter's assessment.
Revenue and EBITDA by quarter
| Period | Measure | bn USD |
|---|---|---|
| Q1 2025 | Revenue | 1.164437 |
| Q2 2025 | Revenue | 1.235118 |
| Q4 2025 | Revenue | 1.301135 |
| Q1 2026 | Revenue | 1.044192 |
| Q2 2026 | Revenue | 1.502404 |
| Q3 2026 | Revenue | 1.412596 |
| Q1 2025 | EBITDA | 0.292301 |
| Q2 2025 | EBITDA | 0.29234200000000005 |
| Q4 2025 | EBITDA | 0.243479 |
| Q1 2026 | EBITDA | 0.20583100000000001 |
| Q2 2026 | EBITDA | 0.45627500000000004 |
| Q3 2026 | EBITDA | 0.35967200000000005 |
EBITDA margin
| Period | Measure | % |
|---|---|---|
| Q1 2025 | EBITDA margin | 25.1 |
| Q2 2025 | EBITDA margin | 23.7 |
| Q4 2025 | EBITDA margin | 18.7 |
| Q1 2026 | EBITDA margin | 19.7 |
| Q2 2026 | EBITDA margin | 30.4 |
| Q3 2026 | EBITDA margin | 25.5 |
Revenue of USD 1,412.6m was 6.5% below the price-implied model, and the gap cannot be explained by price alone
Third-quarter 2026 revenue was USD 1,412.6m. The price model at unchanged volumes and costs from the previous quarter gave USD 1,510.2m. The USD 97.6m difference is 6.5% of the model, and it comes down to volumes, realised price or sales mix.
The facts give no production or sales data for the third quarter, so the exact cause cannot be named. But the size of the gap suggests the company either sold less coal or sold it below the benchmark price. For a miner with long-term contracts this could be a pricing-clause effect, but the source does not confirm it.
Year-on-year revenue is not disclosed on a comparable basis, so the dynamics can only be discussed through the price model. It shows the company fell short of what the market allowed.
The 25.5% EBITDA margin and 14.8% net margin are the result of weak realisation, not of a falling coal price
Third-quarter 2026 EBITDA was USD 359.7m on revenue of USD 1,412.6m, a margin of 25.5%. Net profit of USD 209.6m gives a net margin of 14.8%. These levels are below what could be expected with coal at USD 137.1 and a price model showing EBITDA of USD 464m.
The cause is not the coal price: it rose. The cause is that the company did not fully realise the price advantage. Operating profit of USD 359.3m is almost equal to EBITDA, with depreciation of just USD 0.377m, so the EBITDA margin and operating margin are practically the same. That means the gap formed at the gross-profit level, not below it.
For an investor, the 25.5% margin is the reference point. If the company can move closer to the price model next quarter, the margin will recover. If the gap persists, the market will start pricing in lower normalised earnings.
Net debt
at each reporting date, current net debt / EBITDA (LTM) = -0.71
| Period | Measure | bn USD |
|---|---|---|
| Q2 2025 | Net debt | −0.36348599999999986 |
| Q4 2025 | Net debt | −0.12441400000000011 |
| Q1 2026 | Net debt | −0.09730899999999996 |
| Q2 2026 | Net debt | −0.2110519999999999 |
| Q3 2026 | Net debt | −1.206392 |
Net cash rose from USD 0.2bn on 30 June to USD 1.2bn on 30 September, with operating cash flow of USD 329.6m for the quarter
As of 30 September 2026 net cash stood at USD 1.2bn versus USD 0.2bn on 30 June – an increase of USD 1.0bn. Over 12 months the position rose from USD 0.4bn on 30 June 2025 to USD 1.2bn. Operating cash flow for the third quarter was USD 329.6m with capital expenditure of USD 54.1m.
Net debt to EBITDA LTM is -0.71, meaning the company runs a net cash position. That is a level, not a direction: the facts give no prior value for the ratio, so one cannot speak of leverage rising or falling. But the absolute position of USD 1.2bn provides a cushion.
Free cash flow for the quarter was about USD 275.5m after capex. Against a market capitalisation of USD 4.37bn that is a substantial figure, and it supports dividend payments.
Valuation vs its own history
now vs the 3-year average
| Period | Measure | × |
|---|---|---|
| EV/EBITDA | Now | 2.4964882319002117 |
| EV/EBITDA | 3-year average | 2.8513457710479013 |
A 9.8% dividend yield against P/E LTM of 5.1 and EV/EBITDA LTM of 2.5 – well below its own 2.9 average
The trailing 12-month dividend yield is 9.8%. That is a high figure and, with net cash of USD 1.2bn and free cash flow of about USD 275.5m for the quarter, looks covered. However, the facts give no payout ratio or split of profit paid out as dividends.
Our estimate: if the current yield and LTM profit of USD 856.2m hold, the dividend can stay at around 9–10%. This is our estimate, not company guidance. It rests on the company generating enough cash and carrying no debt burden.
On our numbers, EV/EBITDA LTM of 2.5 against its own three-year average of 2.9 is a 12% discount. The share is cheaper than its own history. P/E LTM of 5.1 is a low level, but normal for a coal miner. A 9.8% dividend yield against the key rate makes the stock interesting for income investors.
Reserves support 11 years of production, which limits long-term growth but does not undermine the current yield
Reserve life at the current production rate is 11 years. For a coal company that is an average horizon: it supports production but does not allow long-term growth without new deposits. Combined with coal at USD 137.1, it means the company will generate cash flow, but the long-term valuation is capped.
For an investor this is a neutral factor. It does not affect dividends in the coming years but limits the potential for a re-rating. The main contribution to valuation comes from the current yield and the discount to its own history.
Valuation on the latest reported figures
| Metric | Value |
|---|---|
| Market cap | 4.37 bn USD |
| P/E (LTM) | 5.1 |
| EV/EBITDA (LTM) | 2.5 |
| P/B | 1.20 |
| Net debt / EBITDA (LTM) | -0.71 |
| Operating cash flow (LTM) | 0.95 bn |
| ROE | 21.1% |
| Dividend yield (12m) | 9.8% |
| EV/EBITDA, 3-year average | 2.9 |
Net profit by quarter
| Period | Measure | bn USD |
|---|---|---|
| Q1 2025 | Net profit | 0.195996 |
| Q2 2025 | Net profit | 0.232687 |
| Q4 2025 | Net profit | 0.17285599999999998 |
| Q1 2026 | Net profit | 0.143038 |
| Q2 2026 | Net profit | 0.330727 |
| Q3 2026 | Net profit | 0.209573 |
Bottom line
The strong side of the report is the coal price: the average of USD 137.1 rose 23.7% year on year, and spot at USD 138.9 is higher. The weak side is realisation: EBITDA of USD 359.7m came in USD 104.4m, or 22.5%, below the price model. The company keeps net cash of USD 1.2bn and a high 9.8% dividend yield, while EV/EBITDA LTM of 2.5 is 12% below its own three-year average of 2.9. The key question for a holder is whether the company can close the gap to the coal price next quarter. Our conclusion: rather attractive – the portal model shows +46% upside. Our view: the share is rather attractive at the current price; upside on the portal model +46%.