Profit rose 47.9%, but nine-month cash flow lagged it by nearly half

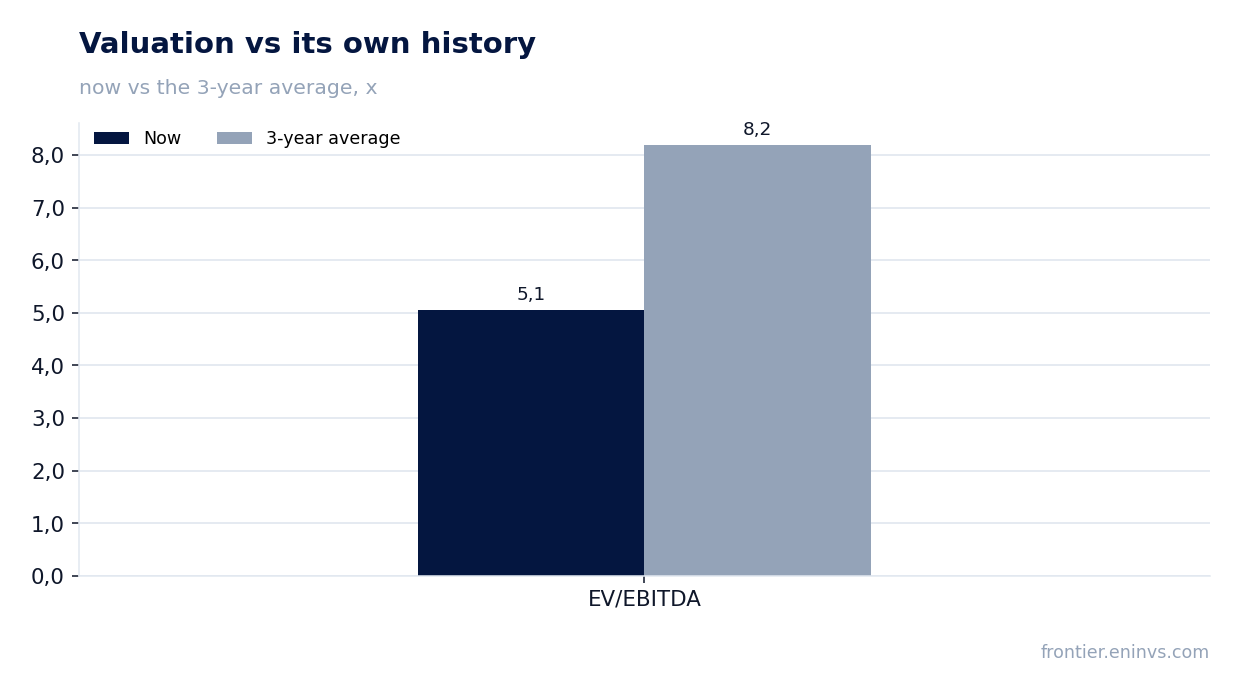
The report for the nine months to 30 September 2026 shows revenue of IDR 88.5 trn and net profit of IDR 8.8 trn: revenue rose 22.8% year on year, profit 47.9%, and the net margin improved from 8.3% to 10.0%. Operating cash flow for the same period was IDR 5.1 trn, well below profit, while net debt at end-September remained negative at minus IDR 4.1 trn, or minus 0.35x LTM EBITDA. At 5.1x EV/EBITDA against its own three-year average of 8.2x and with an 8.0% dividend yield, the share looks cheap against its own history, and the verdict is rather attractive.
Key takeaways
— Nine-month revenue rose 22.8%, and the net margin climbed to 10.0% from 8.3% a year earlier
— Profit grew 47.9%, faster than revenue, because costs rose more slowly than income
— Operating cash flow of IDR 5.1 trn lagged net profit of IDR 8.8 trn
— Net debt remains negative at minus IDR 4.1 trn, or minus 0.35x LTM EBITDA
— An 8.0% dividend yield on the last twelve months' payouts is a strong argument for the share
— EV/EBITDA of 5.1x against its own three-year average of 8.2x leaves the share 38% cheaper than its history
— The portal's model puts the upside to fair value at 38%
Attractiveness
Key figures, IDR bn
| Metric | 9M 2025 | 9M 2026 | Change |
|---|---|---|---|
| Revenue | 72 028 | 88 481 | +22.8% |
| EBITDA | 8 820 | — | — |
| Operating profit | 7 888 | — | — |
| Net profit | 5 975 | 8 838 | +47.9% |
| Operating cash flow | 4 021 | 5 060 | +25.8% |
| Capex | 261 | — | — |
| EBITDA margin | 12.2% | — | — |
| Net margin | 8.3% | 10.0% | +1.7 pp |
Nine-month revenue rose 22.8%, and the net margin climbed to 10.0% from 8.3% a year earlier
Revenue for the nine months of 2026 was IDR 88.5 trn, 22.8% more than in the same period a year earlier. That is double-digit growth, and the standalone quarter confirms it: in the first quarter of 2026 revenue was IDR 29.3 trn against IDR 26.2 trn in the first quarter of 2025, up 12.1% year on year.
The net margin for the nine months reached 10.0% against 8.3% a year earlier. Net profit was IDR 8.8 trn, up 47.9% year on year – noticeably faster than revenue, meaning costs rose more slowly than income.
The gap between revenue and profit growth is the central fact of the report. It shows operating leverage working in shareholders' favour, but does not reveal which cost line delivered the saving; the report does not break that out.
Profit grew 47.9%, faster than revenue, because costs rose more slowly than income
Net profit for the nine months of 2026 was IDR 8.8 trn against roughly IDR 6.0 trn a year earlier – growth of 47.9%. On revenue of IDR 88.5 trn that gives a net margin of 10.0%.
Profit accelerating relative to revenue means each additional unit of revenue brought more profit than before. Such an effect usually comes from higher utilisation or lower unit costs, but the report does not break out the specific source.
For an investor, it matters that profit grew faster than revenue not through one-off items: the report does not highlight asset sales or other one-off income that could be stripped out. That makes the quality of the profit growth more reliable, though it is not confirmed by a cost breakdown.
Operating cash flow of IDR 5.1 trn lagged net profit of IDR 8.8 trn
Operating cash flow for the nine months of 2026 was IDR 5.1 trn – only 58% of net profit of IDR 8.8 trn. The gap means part of the profit settled in working capital or non-cash items rather than turning into cash.
Over the last twelve months operating cash flow was IDR 5.9 trn against net profit of IDR 10.1 trn – so the shortfall is not a one-off but a persistent pattern. That is the main question for the report: profit growth is not yet converting fully into cash flow.
Capital expenditure for the nine months is not disclosed in the facts, so free cash flow cannot be assessed. Even without it, operating cash flow of IDR 5.1 trn is the resource that funds both investment and dividends.
Net debt remains negative at minus IDR 4.1 trn, or minus 0.35x LTM EBITDA
At 30 September 2026 net debt was minus IDR 4.1 trn, meaning the cash cushion exceeds debt obligations. The ratio of net debt to LTM EBITDA is minus 0.35x, indicating a net cash position.
Over the quarter from 30 June to 30 September 2026 net debt moved from minus IDR 3.4 trn to minus IDR 4.1 trn, so the cash cushion grew by IDR 739.6 bn. Over twelve months, from 30 September 2025, net debt moved from minus IDR 5.6 trn to minus IDR 4.1 trn – the cushion shrank by IDR 1.4 trn.
An 8.0% dividend yield on the last twelve months' payouts is a strong argument for the share
The dividend yield over the last twelve months is 8.0% on the current price. That is above the yield on many fixed-income instruments and looks attractive for a share with growing profit.
Our estimate of the current-year dividend is based on nine-month profit of IDR 8.8 trn and a payout ratio not disclosed in the facts. If the company maintains its current policy, the full-year dividend could exceed last year's, but that depends on the board's decision and on how much profit is directed to investment.
The risk to the dividend is weak conversion of profit into cash flow: operating flow of IDR 5.1 trn over nine months is less than profit of IDR 8.8 trn. If the gap persists, the payout may be funded from the cash cushion, which at end-September stands at minus IDR 4.1 trn of net debt.
EV/EBITDA of 5.1x against its own three-year average of 8.2x leaves the share 38% cheaper than its history
The LTM EV/EBITDA multiple is 5.1x against its own three-year average of 8.2x. That is 38% below the historical level, meaning the share trades cheaper than it usually has over the past three years.
The LTM P/E is 6.4x, which looks modest given a 10.0% margin and 47.9% profit growth. Market capitalisation is IDR 64.2 trn, and with net debt negative, EV is below market cap.
On the portal's model, which re-prices EBITDA at current commodity prices at the target EV/EBITDA, the upside to fair value is estimated at 38%. That is our own estimate, not a market consensus.
The portal's model puts the upside to fair value at 38%
The portal's model re-prices EBITDA at current commodity prices and applies a target EV/EBITDA multiple, then compares the result with market capitalisation. At current prices the upside to fair value is 38%.
That estimate is sensitive to commodity prices: if they fall, EBITDA in the model declines and the upside shrinks. The reverse holds if prices rise.
The share is held in the portal's live model strategies – ID Commodity-Upside and ID FVC (quality). That is a fact about strategy composition, not an argument for the verdict.
Valuation on the latest reported figures
| Metric | Value |
|---|---|
| Market cap | 64 162 bn IDR |
| P/E (LTM) | 6.4 |
| EV/EBITDA (LTM) | 5.1 |
| P/B | 1.75 |
| Net debt / EBITDA (LTM) | -0.35 |
| Operating cash flow (LTM) | 5 892 bn |
| ROE | 29.6% |
| Dividend yield (12m) | 8.0% |
| EV/EBITDA, 3-year average | 8.2 |
Bottom line
The strong side of the report is 47.9% profit growth on 22.8% revenue growth and a 10.0% margin: operating leverage worked, and profit grew faster than revenue. The weak side is cash flow: IDR 5.1 trn over nine months against IDR 8.8 trn of profit, and the gap persists over the last twelve months. Net debt is negative at minus IDR 4.1 trn, or minus 0.35x EBITDA, which removes interest risk and supports an 8.0% dividend yield. The share is cheaper than its own history: EV/EBITDA of 5.1x against a three-year average of 8.2x, and the portal's model shows 38% upside. The verdict is rather attractive: valuation and dividend outweigh the question over profit-to-cash conversion, but that question will be decisive in the next report.
Open the company's financial profile ANTM →
See also: market overview · valuation map · stock screeners