9M 2026: profit up 53.9% while net debt fell to IDR 1.1 trn

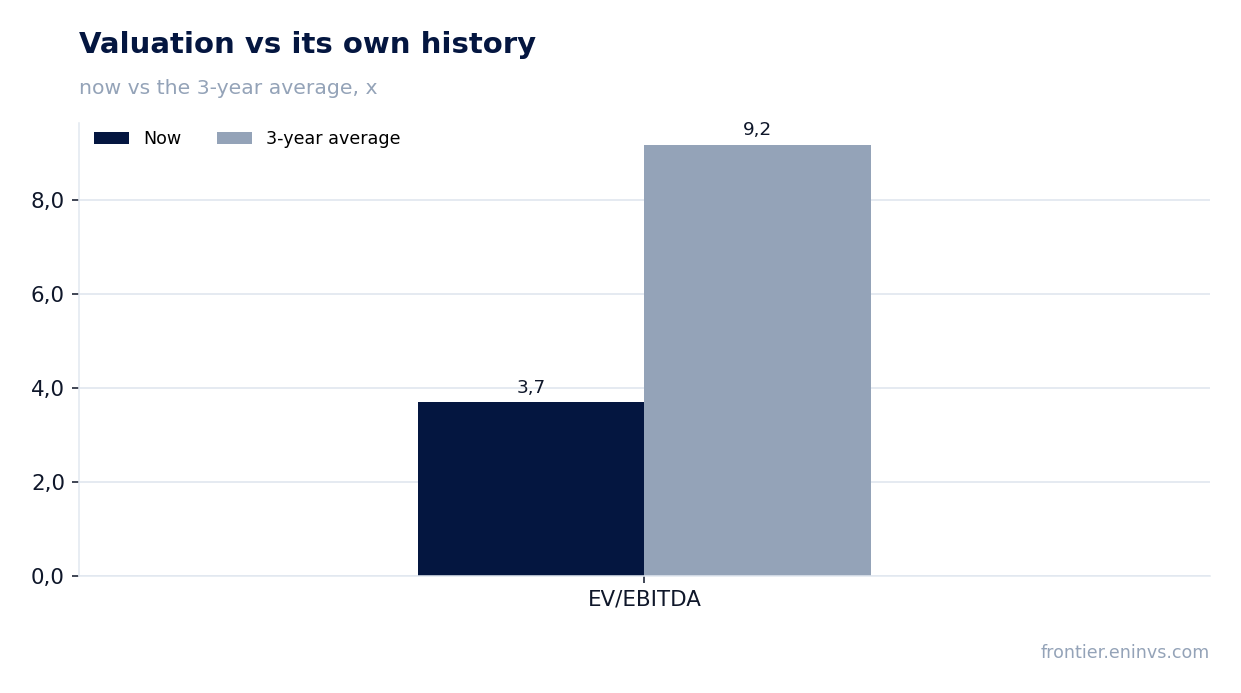
The 9M 2026 report showed revenue of IDR 60.2 trn (+19.0% YoY) and net profit of IDR 5.18 trn (+53.9%). Net margin rose to 8.6% from 6.7% a year earlier, while net debt at 30 September 2026 stood at IDR 1.1 trn, just 0.09x LTM EBITDA. At an LTM EV/EBITDA of 3.7 versus its own three-year average of 9.2 the share looks cheap, and the verdict is attractive.
Key takeaways
— 9M revenue rose 19.0% – faster than the 12.7% seen in Q1 2026
— Net profit added 53.9%, lifting the margin to 8.6% from 6.7%
— Net debt fell from IDR 4.4 trn on 30 June to IDR 1.1 trn on 30 September
— Leverage of 0.09x LTM EBITDA puts no pressure on earnings
— A 7.1% dividend yield backed by growing profit
— LTM EV/EBITDA of 3.7 versus its own three-year average of 9.2 – a 60% discount
— The portal's model implies +38% upside to fair value
Attractiveness
Key figures, IDR bn
| Metric | 9M 2025 | 9M 2026 | Change |
|---|---|---|---|
| Revenue | 50 604 | 60 204 | +19.0% |
| EBITDA | 6 137 | — | — |
| Operating profit | 4 962 | — | — |
| Net profit | 3 368 | 5 182 | +53.9% |
| Operating cash flow | 4 015 | 114 | -97.2% |
| EBITDA margin | 12.1% | — | — |
| Net margin | 6.7% | 8.6% | +1.9 pp |
9M revenue rose 19.0% – faster than the 12.7% seen in Q1 2026
Revenue for 9M 2026 reached IDR 60.2 trn, up 19.0% from the same period a year earlier. That is well above the 12.7% growth seen in Q1 2026. The acceleration suggests demand in Q2 and Q3 was stronger than at the start of the year.
Top-line growth came with better profitability: net profit rose 53.9%, nearly three times faster than revenue. That ratio means the company was not just growing volumes but earning more per unit of revenue than a year earlier.
For sustainability, it matters that revenue growth was not accompanied by higher debt – net debt actually fell over the quarter. This suggests expansion was funded from internal resources.
Net profit added 53.9%, lifting the margin to 8.6% from 6.7%
Net profit for 9M 2026 was IDR 5.18 trn, up 53.9% YoY. Net margin reached 8.6% versus 6.7% in the same period last year. A 1.9 pp margin gain on 19.0% revenue growth creates a multiplier effect on profit.
The margin improvement could stem from lower relative costs or one-off factors. The data provided does not break down cost lines, so it is impossible to say exactly which line drove it. The sustainability of the margin will be visible in the next report.
LTM net profit, i.e. over the last twelve months, was IDR 7.46 trn. This figure is used for multiples and should not be mixed with the reported-period profit.
Net debt fell from IDR 4.4 trn on 30 June to IDR 1.1 trn on 30 September
Net debt at 30 September 2026 was IDR 1.1 trn versus IDR 4.4 trn on 30 June 2026 – a reduction of IDR 3.3 trn over the quarter. Over the year, from 30 September 2025, net debt fell from IDR 3.1 trn to IDR 1.1 trn, a decrease of IDR 2.0 trn.
This reduction means the company directed a significant portion of earnings to debt repayment. That lowers interest expense and reduces risk. At the same time, net debt to LTM EBITDA stands at just 0.09x – a level that puts no pressure on earnings.
Importantly, the debt reduction was not accompanied by a fall in operating cash flow: for 9M it remained positive at IDR 113.9 bn. This confirms that debt was repaid from operations rather than asset sales.
Leverage of 0.09x LTM EBITDA puts no pressure on earnings
Net debt to LTM EBITDA at 30 September 2026 stands at 0.09x. That is a very low level: the company is almost independent of borrowed funds. For context, even with LTM profit of IDR 7.46 trn and LTM EBITDA of IDR 11.89 trn, debt of IDR 1.1 trn is covered in less than a month of EBITDA generation.
Low leverage gives the company room to manoeuvre: it can direct more funds to dividends or investment without worrying about financial stability. Also, if rates fall, the company will benefit less than more indebted peers, but its risks are lower.
Note that the data does not include interest expense, so it is impossible to assess how much the debt reduction has already affected profit. However, the debt level itself suggests this factor is unlikely to be significant in the coming periods.
A 7.1% dividend yield backed by growing profit
The trailing twelve-month dividend yield is 7.1%. That is a high level, supported by both profit growth and low leverage. The company can afford to pay out a significant share of profit without compromising investment needs.
Our estimate for the current-year dividend is based on LTM profit of IDR 7.46 trn and the payout ratio the company has maintained. However, the exact amount depends on the board's decision and may be adjusted for one-off factors. A 7.1% yield is well above the key rate, making the share attractive for income-oriented investors.
The risk of a dividend cut is linked to a possible fall in profit or the need to direct funds to large investments. However, the current debt level and cash flow allow the company to maintain payments even under a moderate deterioration in conditions.
LTM EV/EBITDA of 3.7 versus its own three-year average of 9.2 – a 60% discount
The LTM EV/EBITDA multiple is 3.7, which is 60% below its own three-year average of 9.2. This means the share is trading significantly cheaper than usual relative to its history. Such a discount could be due to a general market de-rating or investor concerns about profit sustainability.
For comparison, the LTM P/E is 5.6, also indicating a low valuation. At the same time, return on equity (ROE) is 19.4% – a high figure that speaks to business efficiency. The combination of a low multiple and high ROE usually signals undervaluation.
However, a low multiple can also be a value trap if profit proves unstable. Therefore, it is important to watch revenue and margin dynamics in the next report: if growth continues, the discount is likely to narrow.
The portal's model implies +38% upside to fair value
The portal's model, which assesses value creation through EBITDA growth and a target multiple, puts the fair value of the share 38% above the current market price. This is the portal's own estimate, not a market consensus or a target price. It is based on current financials and assumes the company maintains its current growth and profitability.
The model accounts for the fact that at an LTM EV/EBITDA of 3.7 and with EBITDA growth, the company generates enough value to justify a higher valuation. However, the model does not incorporate potential risks such as a slowdown in growth or a change in dividend policy.
The 38% upside looks significant, but it will only materialise if the market re-rates the share. A trigger could be the next report confirming profit growth.
Valuation on the latest reported figures
| Metric | Value |
|---|---|
| Market cap | 41 815 bn IDR |
| P/E (LTM) | 5.6 |
| EV/EBITDA (LTM) | 3.7 |
| P/B | 1.22 |
| Net debt / EBITDA (LTM) | 0.09 |
| ROE | 19.4% |
| Dividend yield (12m) | 7.1% |
| EV/EBITDA, 3-year average | 9.2 |
Tracked metrics of the idea
The metrics we track our idea "Charoen Pokphand Indonesia (13 ideas)" of 2026-07-16 by - at the idea date and now. The share price moved -18% over the period. Original write-up: https://frontier.eninvs.com/region/us/article/ideas
Idea: at publication and now
| Metric | 2026-07-16, price 3,110 | Now, price 2,550 |
|---|---|---|
| Fundamental value created, share of market cap | +31% | +38% |
Bottom line
The 9M 2026 report showed strong results: revenue up 19.0%, net profit up 53.9%, and the margin rising to 8.6%. Net debt fell to IDR 1.1 trn, and leverage of 0.09x LTM EBITDA poses no risk. A 7.1% dividend yield and a 60% EV/EBITDA discount to its own history make the share attractive. Verdict – attractive.
Open the company's financial profile CPIN →
See also: market overview · valuation map · stock screeners