First profit in years rests on the gap between revenue growth and near-flat costs

On 30 September the company released results for the nine months of 2026: revenue of IDR 16,549.0 trn (+24.5% year on year), net profit of IDR 864.2 bn against a loss at a -7.5% margin a year earlier, and a net cash position of IDR 20,531.3 trn. At EV/EBITDA LTM of 3.1 and a portal-model upside of +30%, the share looks rather attractive, but profit is still thin relative to revenue and rests on operating leverage rather than a durable margin.
Key takeaways
— Nine-month revenue grew 24.5%, and almost all of the profit is operating leverage rather than margin expansion
— Net margin of 5.2% against -7.5% a year earlier – the swing came from costs, not one-offs
— Net cash of IDR 20,531.3 trn rose by IDR 4,439.0 bn over the quarter and IDR 6,974.9 bn over the year
— Operating cash flow of IDR 2,496.2 bn over nine months covers capex with a wide margin
— EV/EBITDA LTM of 3.1 and a portal-model upside of +30% – the share is cheap against its own history
— The next report will show whether the margin holds once revenue growth stops outrunning costs
Attractiveness
Key figures, IDR bn
| Metric | 9M 2025 | 9M 2026 | Change |
|---|---|---|---|
| Revenue | 13 296 | 16 549 | +24.5% |
| EBITDA | 330 | — | — |
| Operating profit | -222 | — | — |
| Net profit | -997 | 864 | to profit |
| Operating cash flow | -161 | 2 496 | to profit |
| Capex | 291 | — | — |
| EBITDA margin | 2.5% | — | — |
| Net margin | -7.5% | 5.2% | +12.7 pp |
Nine-month revenue grew 24.5%, and almost all of the profit is operating leverage rather than margin expansion
Revenue for the nine months of 2026 was IDR 16,549.0 trn, up 24.5% year on year. That pace is well above earlier periods: growth was 26.3% in Q1 2026 and 30.6% in Q2 2026 year on year, but those figures refer to standalone quarters and do not describe the reported period directly.
The key point in the report is not revenue itself but how it converted into profit. Net profit for the nine months was IDR 864.2 bn at a 5.2% margin, against a loss at a -7.5% margin a year earlier. A swing of that size on a quarter of revenue growth means costs barely rose with revenue: the company earned its profit because fixed costs were spread over a larger sales base.
For a holder this is both good and cautionary news. Good – the company turned profitable and did so without visible one-off items. Cautionary – a 5.2% margin is still thin, and if revenue growth slows, operating leverage will work in reverse.
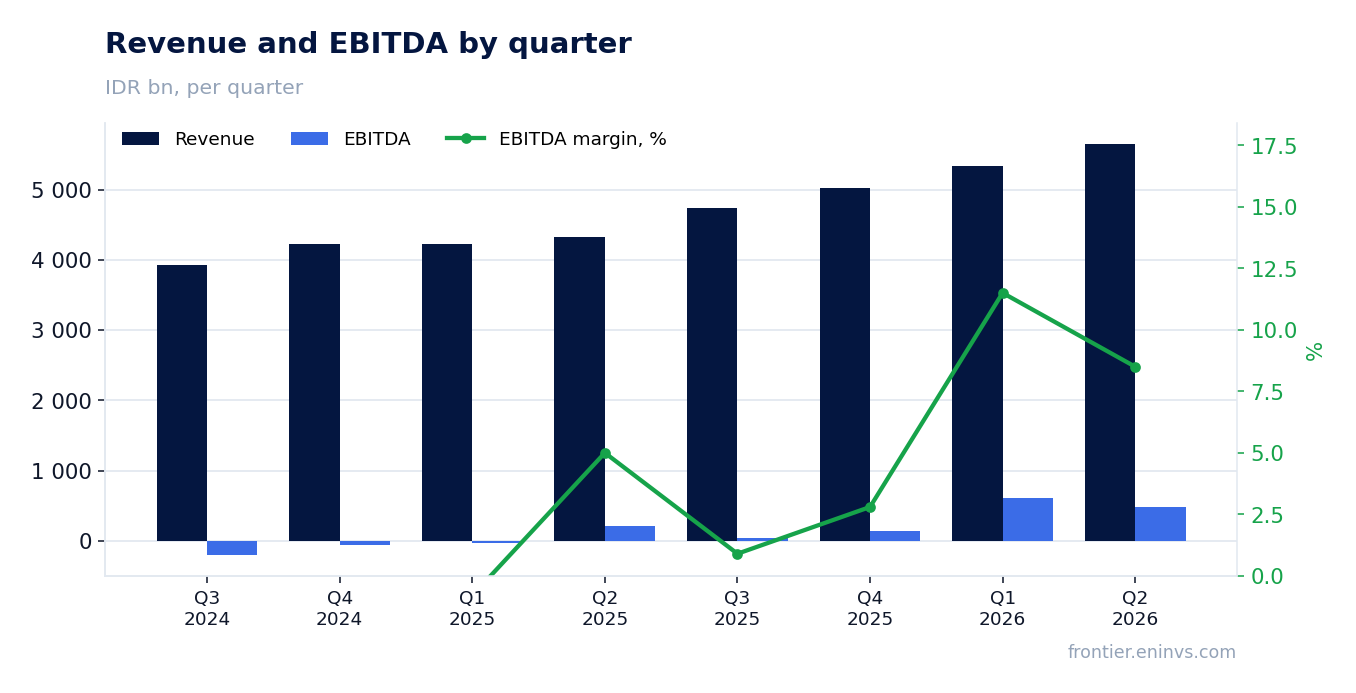
Net margin of 5.2% against -7.5% a year earlier – the swing came from costs, not one-offs
The gap between a 5.2% margin and -7.5% is 12.7 percentage points, and it is almost entirely explained by the ratio of revenue to costs. On revenue of IDR 16,549.0 trn and profit of IDR 864.2 bn, the company earns roughly IDR 5 for every IDR 100 of sales. A year earlier, on lower revenue, it lost IDR 7.5 for every IDR 100.
The report shows no indication of large one-off gains that could explain the swing. That matters: the profit looks operational, not paper. But the same logic means the 5.2% margin is the result of the current revenue-to-cost ratio, not a new normal. Any acceleration in costs or slowdown in revenue will quickly eat into that profit.
The thing to watch is not the absolute margin but how it changes quarter to quarter. In Q1 2026 net profit was IDR 170.7 bn, in Q2 2026 IDR 349.5 bn. Profit rising alongside revenue suggests the leverage is still working in the right direction.
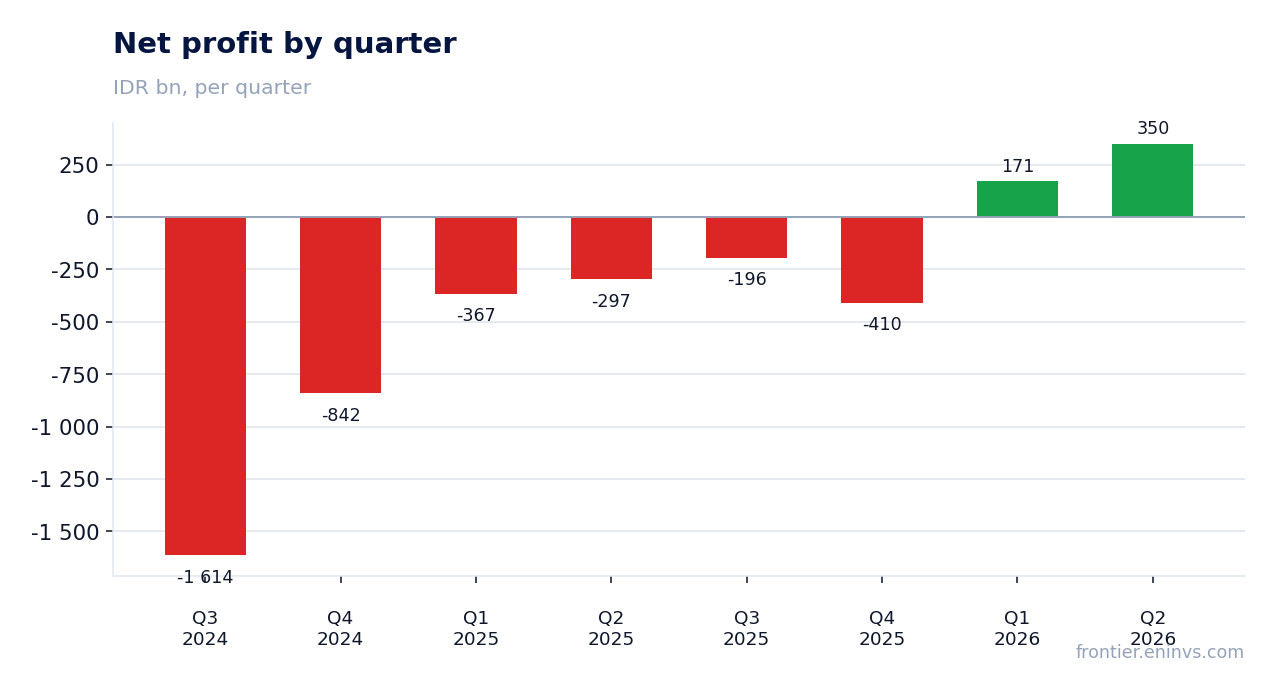
Net cash of IDR 20,531.3 trn rose by IDR 4,439.0 bn over the quarter and IDR 6,974.9 bn over the year
As of 30 September 2026 net cash stood at IDR 20,531.3 trn – the company holds more cash than debt. Over the quarter it rose by IDR 4,439.0 bn: it was IDR 16,092.3 trn on 30 June. Over the year the increase is larger – IDR 6,974.9 bn from IDR 13,556.4 trn on 30 September 2025.
That cushion means the company does not depend on borrowing to fund current operations. Net debt to LTM EBITDA is -6.09 – a negative value confirming the net cash position. This is a level, not a trend: the facts contain no earlier value, so no claim can be made about leverage rising or falling.
For valuation this matters: with a market cap of IDR 24,520.1 trn and EV/EBITDA LTM of 3.1, the company trades cheaply against its own cash flows. Net cash supports the valuation from below and limits the downside for a holder.
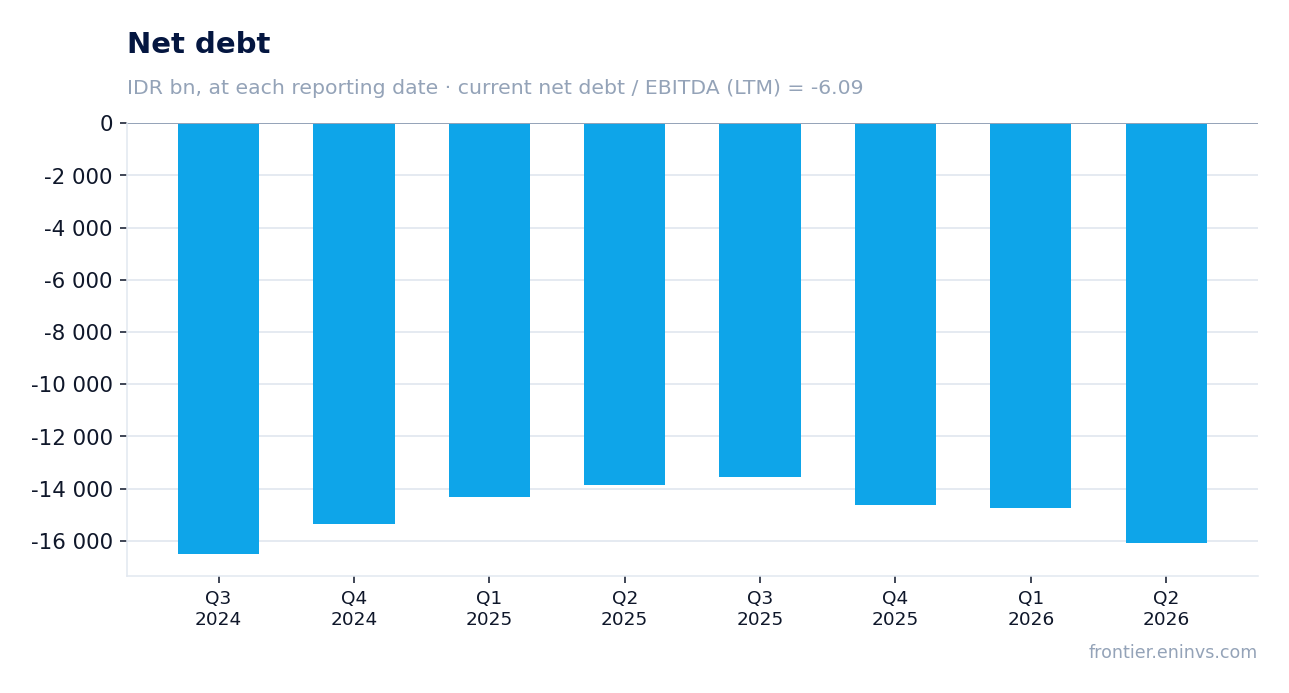
Operating cash flow of IDR 2,496.2 bn over nine months covers capex with a wide margin
Operating cash flow for the nine months of 2026 was IDR 2,496.2 bn. That is less than net profit for the same period (IDR 864.2 bn), which is normal: some profit is absorbed by working capital. But the flow is positive and stable, not one-off.
Capex in the reported period was small. In Q1 2026 it was IDR 34.3 bn, in Q2 2026 IDR 101.5 bn. Even including Q3, for which the facts give no data, capex remains an order of magnitude below operating cash flow. That means the company funds development from its own resources and still leaves a surplus.
Free cash flow is therefore positive and substantial. It, rather than accounting profit, explains the rise in net cash over the quarter and the year. For a holder this matters more than the reported margin: the money is there and it is accumulating.
EV/EBITDA LTM of 3.1 and a portal-model upside of +30% – the share is cheap against its own history
The EV/EBITDA LTM multiple is 3.1 on a market cap of IDR 24,520.1 trn. That is a low level for a company that has turned profitable and is building its cash position. The facts do not give the multiple's own three-year history, so a comparison with it is not possible, but an absolute value of 3.1 says the market values the business cheaply against its current EBITDA.
Our valuation model, based on EBITDA growth times a target multiple, puts the upside of the share to fair value at +30%. This is our own estimate, not a market consensus and not a target price. It rests on current LTM EBITDA of IDR 3,370.1 bn and assumes the company holds its current profitability.
Return on equity is 3.94% – modest but positive. With net cash and a low multiple, even a small profit produces a noticeable return on capital. If profit keeps growing, ROE will rise faster than book equity.
The next report will show whether the margin holds once revenue growth stops outrunning costs
The main question for a holder is not current profit but its durability. The 5.2% margin rests on revenue growing faster than costs. Once that gap closes, profit can compress quickly. The report gives no cost structure, so it is impossible to say what share of costs is fixed and what follows revenue.
The second question is the quality of revenue growth. Growth of 24.5% over nine months looks strong, but the facts give no segment or line-of-business breakdown, so the source of growth is not disclosed. If it came from one direction, concentration risk is higher than the headline suggests.
The third question is capex. It is still small, and that supports cash flow. If the company starts investing in growth more aggressively, free cash flow will shrink and the build-up of cash will slow. The thing to watch in the next report is how capex relates to operating cash flow.
Valuation on the latest reported figures
| Metric | Value |
|---|---|
| Market cap | 24 520 bn IDR |
| EV/EBITDA (LTM) | 3.1 |
| P/B | 0.85 |
| Net debt / EBITDA (LTM) | -6.09 |
| Operating cash flow (LTM) | 4 026 bn |
| ROE | 3.9% |
Bottom line
The strong side of the report is the swing to profit: IDR 864.2 bn over nine months against a loss a year earlier, achieved without visible one-offs. The weak side is that the 5.2% margin is still thin and rests on revenue outrunning costs. Net cash of IDR 20,531.3 trn and operating cash flow of IDR 2,496.2 bn provide a margin of safety. The portal-model upside of +30% and EV/EBITDA LTM of 3.1 support the share's attractiveness. The question for a holder is whether the margin holds once revenue growth slows.
Open the company's financial profile GOTO →
See also: market overview · valuation map · stock screeners