ID_ICBP: revenue up 14.5% but margin compressed from 12.6% to 9.6%

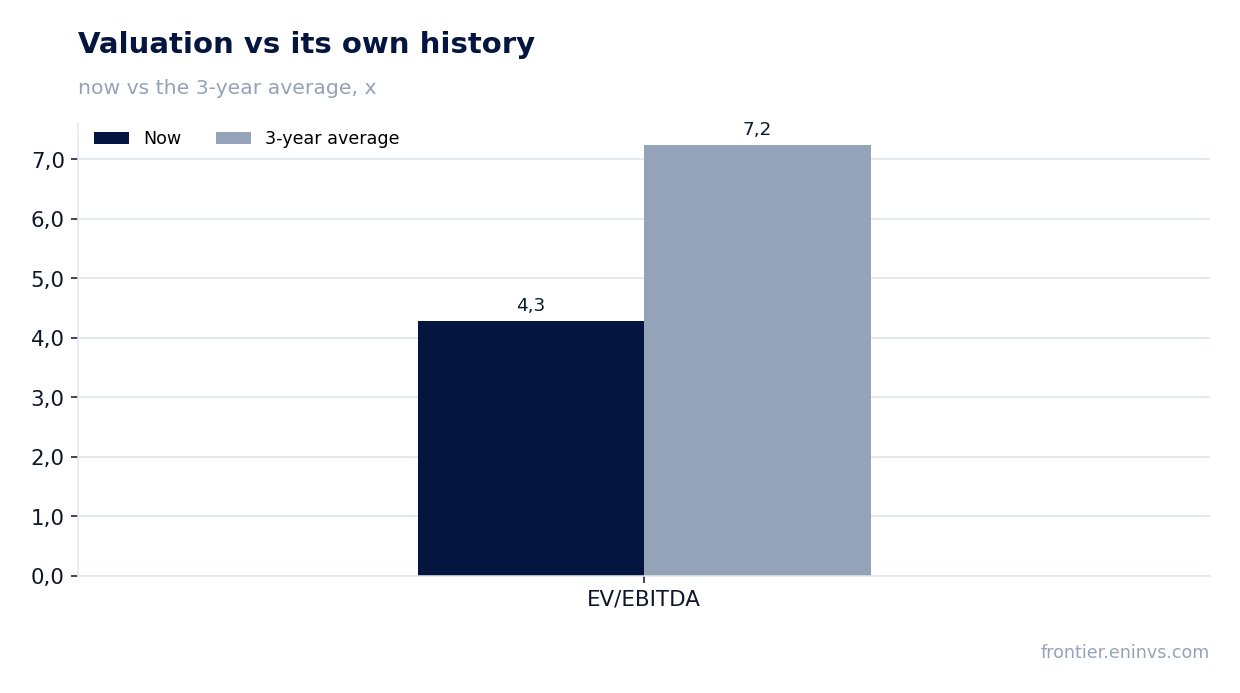
On 30 September ID_ICBP released results for the nine months of 2026. Revenue reached IDR 64,445.7 bn, up 14.5% year on year, while net profit fell 13.3% to IDR 6,165.9 bn and the net margin compressed from 12.6% to 9.6%. Leverage remains moderate at 0.98x LTM EBITDA, and at an EV/EBITDA of 4.3 the share trades below its own three-year average of 7.2. With a trailing dividend yield of 4.8% and the portal model pointing to +22% upside, the share looks rather attractive, but the margin compression is the main counterargument.
Key takeaways
— Revenue rose 14.5% over nine months but profit fell 13.3% – growth cost more than it brought
— Net margin compressed from 12.6% to 9.6%, erasing the entire effect of revenue growth
— Leverage at 0.98x LTM EBITDA remains comfortable, though net debt rose by IDR 2,090.3 bn since June
— Free cash flow over nine months covers only part of investment and dividends
— Dividend yield of 4.8% rests on a payout ratio supported by profit, not one-off items
— EV/EBITDA of 4.3 versus its own three-year average of 7.2 – the share is 41% cheaper than usual
— The portal model implies +22% upside to fair value, but it hinges on margin recovery
Attractiveness
Key figures, IDR bn
| Metric | 9M 2025 | 9M 2026 | Change |
|---|---|---|---|
| Revenue | 56 267 | 64 446 | +14.5% |
| EBITDA | 14 101 | — | — |
| Operating profit | 12 743 | — | — |
| Net profit | 7 108 | 6 166 | -13.3% |
| Operating cash flow | 7 166 | 7 405 | +3.3% |
| EBITDA margin | 25.1% | — | — |
| Net margin | 12.6% | 9.6% | -3.0 pp |
Revenue rose 14.5% over nine months but profit fell 13.3% – growth cost more than it brought
Revenue for the nine months of 2026 reached IDR 64,445.7 bn, up 14.5% year on year. This marks a notable acceleration from the first quarter, when growth was 7.6% year on year. Yet net profit over the same period fell 13.3% to IDR 6,165.9 bn.
The gap between revenue and profit dynamics means costs grew faster than income. The specific cost lines are not disclosed in the provided data, so the source of the pressure cannot be named. What matters is that revenue growth did not translate into profit – this is the key fact of the report.
Net margin compressed from 12.6% to 9.6%, erasing the entire effect of revenue growth
Net margin for the nine months of 2026 was 9.6% versus 12.6% a year earlier. A 3 percentage point decline on revenue of IDR 64,445.7 bn means profit fell well short of what last year's profitability would have delivered.
The margin compression is the main negative surprise of the report. It explains why profit declined despite double-digit revenue growth. Without a recovery in profitability, revenue growth will not create value for shareholders.
Leverage at 0.98x LTM EBITDA remains comfortable, though net debt rose by IDR 2,090.3 bn since June
Net debt as of 30 September 2026 stood at IDR 18,724.0 bn versus IDR 16,633.7 bn on 30 June 2026 – an increase of IDR 2,090.3 bn over the quarter. Over twelve months net debt declined from IDR 21,290.9 bn on 30 September 2025 to the same IDR 18,724.0 bn.
The ratio of net debt to LTM EBITDA is 0.98x. This is a moderate level that does not pressure financial stability. Interest expenses are not disclosed in the provided data, so debt burden cannot be assessed through interest coverage.
Free cash flow over nine months covers only part of investment and dividends
Operating cash flow for the nine months of 2026 was IDR 7,404.7 bn. Against net profit of IDR 6,165.9 bn, this means cash flow exceeds profit, so earnings quality remains acceptable.
However, investment and dividends require more funds than operating activity generates. Capital expenditure data for the reporting period is not disclosed, but the IDR 2,090.3 bn increase in net debt over the quarter indicates that part of spending was financed through borrowing.
Dividend yield of 4.8% rests on a payout ratio supported by profit, not one-off items
The trailing twelve-month dividend yield is 4.8%. This is a moderate level that nonetheless exceeds the yield on many fixed-income instruments. Payouts rest on net profit rather than one-off items, which makes them sustainable.
Our estimate for the current year's dividend assumes the payout ratio stays at last year's level. However, the 13.3% decline in profit over nine months means the absolute dividend may come in lower. The key risk is further margin compression, which would shrink the profit base.
EV/EBITDA of 4.3 versus its own three-year average of 7.2 – the share is 41% cheaper than usual
The LTM EV/EBITDA multiple is 4.3 versus its own three-year average of 7.2. The share trades 41% below its historical valuation on this multiple. This suggests the market is pricing in either lower earnings or a broad risk re-rating.
The LTM P/E is 7.7, which also looks low. Comparison with its own history shows that the current valuation does not require the investor to believe in a margin recovery – it already assumes none.
The portal model implies +22% upside to fair value, but it hinges on margin recovery
On the portal's model, the fair value of the share implies +22% upside to the current price. This estimate is based on EBITDA growth and a target multiple. It is not a market consensus and reflects our own methodology.
The +22% upside materialises only if profit stops falling. If the margin stays at 9.6%, projected cash flow will be lower and fair value will be less. Thus the key bet in the valuation is a recovery in profitability.
Valuation on the latest reported figures
| Metric | Value |
|---|---|
| Market cap | 63 849 bn IDR |
| P/E (LTM) | 7.7 |
| EV/EBITDA (LTM) | 4.3 |
| P/B | 0.87 |
| Net debt / EBITDA (LTM) | 0.98 |
| Operating cash flow (LTM) | 12 343 bn |
| ROE | 10.7% |
| Dividend yield (12m) | 4.8% |
| EV/EBITDA, 3-year average | 7.2 |
Bottom line
The strong side of the report remains revenue: 14.5% growth over nine months and an acceleration from the first quarter. The weak spot is profit: a 13.3% decline and margin compression from 12.6% to 9.6% show that revenue growth is not converting into money for shareholders. Leverage at 0.98x LTM EBITDA is comfortable, and the 4.8% dividend yield supports interest in the stock. The key question for a holder is whether the margin recovers; without that, the +22% upside from the portal model will remain on paper. The verdict is rather attractive, with a caveat on the margin.
Open the company's financial profile ICBP →
See also: market overview · valuation map · stock screeners