ID_INCO: 9M profit up 2.8x, but the cash barely followed
ID_INCO's 9M 2026 report showed revenue of USD 896.1m, up 27.0% year on year, and net profit of USD 147.1m, 2.8x the prior-year figure. Net margin rose from 7.4% to 16.4%, operating cash flow was USD 103,988m, and net debt at period end remained negative at minus USD 57,387m. The stock trades below its own history on EV/EBITDA LTM of 9.2 versus a three-year average of 10.3, but the portal's model implies minus 35% to fair value, so the verdict is neutral.
Key takeaways
— Revenue for 9M rose 27.0% to USD 896.1m, the fastest pace in the company's available history
— Net profit added 180.5% to USD 147.1m, but the 16.4% margin still needs confirmation in the next report
— Operating cash flow of USD 103,988m lags the USD 147.1m profit, so about 71% of earnings converts into cash
— Net debt remains negative at minus USD 57,387m on 30 September 2026, with net debt/EBITDA LTM at minus 0.33
— The stock trades at EV/EBITDA LTM of 9.2 versus a three-year average of 10.3, 10% below its own history
— Trailing twelve-month dividend yield is 2.28% against P/E LTM of 11.6, a modest payout relative to profit
— The portal's model, repricing EBITDA at current commodity prices, implies minus 35% to fair value
Attractiveness
Key figures, USD bn
| Metric | 9M 2025 | 9M 2026 | Change |
|---|---|---|---|
| Revenue | 0.71 | 0.90 | +27.0% |
| EBITDA | 0.17 | — | — |
| Operating profit | 0.04 | — | — |
| Net profit | 0.05 | 0.15 | +180.5% |
| Operating cash flow | 0.19 | 0.10 | -44.8% |
| EBITDA margin | 23.8% | — | — |
| Net margin | 7.4% | 16.4% | +9.0 pp |
Revenue for 9M rose 27.0% to USD 896.1m, the fastest pace in the company's available history
Revenue for the reported period was USD 896.1m, 27.0% above the same nine months a year earlier. This is the highest growth rate visible in the available data: in Q1 2026 revenue added 22.3% year on year, while in Q1 2025 it declined 10.2%.
Quarterly dynamics within the reported period are not disclosed, so only the cumulative total can be relied on. The acceleration relative to Q1 means the second and third quarters contributed more to growth than the start of the year.
For a company with trailing twelve-month revenue of about USD 1.2bn, 27.0% growth is a genuine acceleration of the business rather than a one-off spike. The next report will show whether the pace held in Q4.
Net profit added 180.5% to USD 147.1m, but the 16.4% margin still needs confirmation in the next report
Net profit for 9M was USD 147.1m versus USD 52.4m a year earlier, growth of 180.5%. Net margin rose from 7.4% to 16.4%, more than doubling.
Such a margin jump on 27.0% revenue growth means costs grew slower than revenue. The report does not disclose which line produced the effect, so the source of the saving cannot be named – only the fact that profit grew 6.7 times faster than revenue can be recorded.
The sustainability of the 16.4% margin is the main question for the next report. If it holds, trailing twelve-month profit of USD 170.7m will prove a new base rather than a one-off level.
Operating cash flow of USD 103,988m lags the USD 147.1m profit, so about 71% of earnings converts into cash
Operating cash flow for 9M was USD 103,988m against net profit of USD 147.1m. The USD 43.1m gap means about 71% of profit converted into cash – normal for a growing business, but not ideal.
Over the trailing twelve months operating cash flow was USD 150.2m against profit of USD 170.7m, a conversion of about 88%. The cumulative period looks weaker than the annual figure, pointing to a working-capital outflow within the nine months.
Capex for the reported period is not disclosed, so free cash flow cannot be assessed. It is free cash flow that will determine whether the company can fund dividends and development without adding debt.
Net debt remains negative at minus USD 57,387m on 30 September 2026, with net debt/EBITDA LTM at minus 0.33
Net debt on 30 September 2026 was minus USD 57,387m, meaning cash exceeds debt. Net debt to trailing twelve-month EBITDA is minus 0.33, a net cash position.
Over the quarter net debt moved from minus USD 0.1bn on 30 June 2026 to minus USD 0.1bn on 30 September 2026, a change of plus USD 0.1bn. Over the year, from 30 September 2025, the change was plus USD 0.4bn, from minus USD 0.5bn to minus USD 0.1bn.
The company carries no debt burden, which removes interest expense risk. However, the USD 0.4bn annual increase in net debt means the cash cushion is shrinking – if the trend persists, the advantage could disappear.
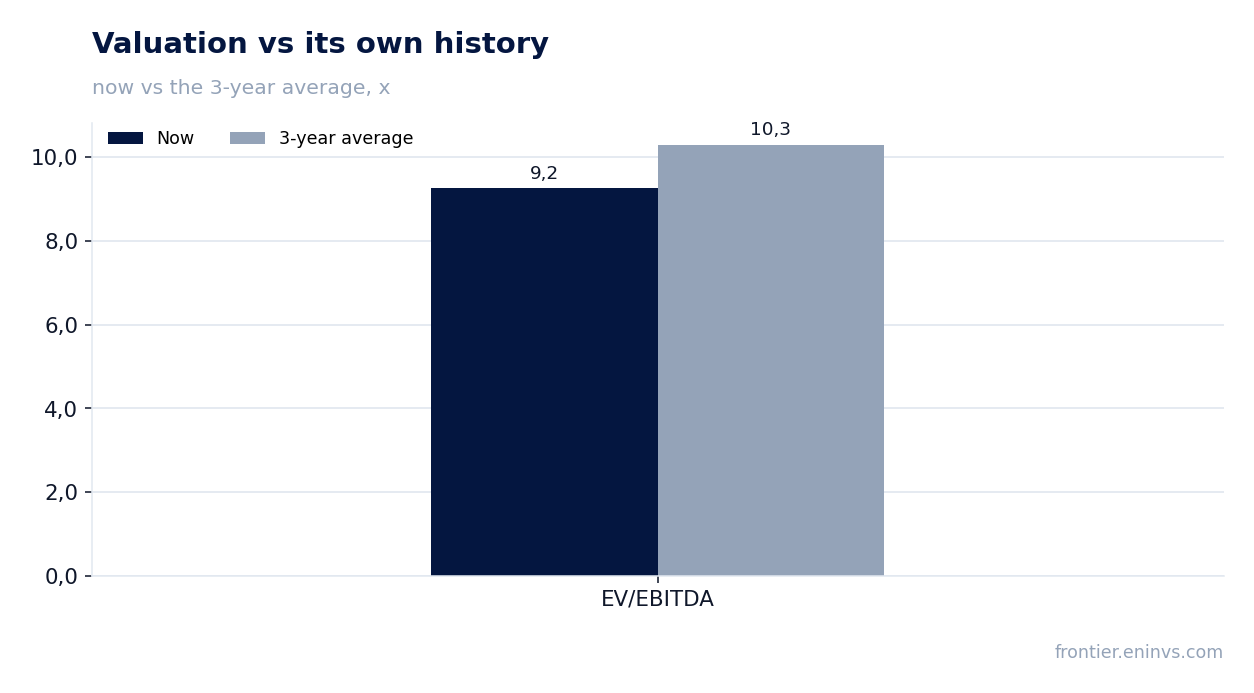
The stock trades at EV/EBITDA LTM of 9.2 versus a three-year average of 10.3, 10% below its own history
EV/EBITDA for the trailing twelve months is 9.2 against a three-year average of 10.3. The stock trades 10% below its own historical valuation, which looks like undervaluation given 27.0% revenue growth and 180.5% profit growth.
P/E LTM is 11.6, which with profit of USD 170.7m and market cap of USD 1.99bn gives an earnings yield of about 8.6%. For a company with a net cash position and growing revenue, this is a moderate valuation.
The portal's model, however, implies minus 35% to fair value when EBITDA is repriced at current commodity prices. This means the market has already priced in higher commodity prices than current levels, and if they fall the valuation could prove stretched.
Trailing twelve-month dividend yield is 2.28% against P/E LTM of 11.6, a modest payout relative to profit
Trailing twelve-month dividend yield is 2.28%. With P/E LTM of 11.6, this implies a payout ratio of about 26% – a modest share for a company with a net cash position.
Our estimate for the current year's dividend assumes a payout ratio of about 26% and trailing twelve-month profit of USD 170.7m. That gives a payout of roughly USD 44m, or about 2.3% of the current market cap. The estimate hinges on whether the 16.4% margin holds and whether growth in capex forces a policy review.
A yield of 2.28% is below the key rate, making the dividend unattractive for a conservative investor. However, with profit up 180.5% and no debt, the company could afford to raise payouts if management chooses to increase the payout ratio.
The portal's model, repricing EBITDA at current commodity prices, implies minus 35% to fair value
Our model reprices EBITDA at current commodity prices and applies a target EV/EBITDA. At the current market cap this implies minus 35% to fair value, meaning the stock looks more expensive than the model suggests.
The gap with the market valuation is explained by the market pricing in higher commodity prices than current levels. If commodity prices stay at current levels, the model points to overvaluation; if they rise, the estimate may prove conservative.
The stock is held in the portal's live model strategies – ID Commodity-Upside and ID FVC (quality). This is a fact, not an argument for the verdict: membership follows each strategy's own screen.
Valuation on the latest reported figures
| Metric | Value |
|---|---|
| Market cap | 1.99 bn USD |
| P/E (LTM) | 11.6 |
| EV/EBITDA (LTM) | 9.2 |
| P/B | 0.72 |
| Net debt / EBITDA (LTM) | -0.33 |
| Operating cash flow (LTM) | 0.15 bn |
| ROE | 6.9% |
| Dividend yield (12m) | 2.3% |
| EV/EBITDA, 3-year average | 10.3 |
Bottom line
The report's strength was 27.0% revenue growth and 180.5% profit growth at a 16.4% margin, plus a net cash position with net debt/EBITDA of minus 0.33. The weakness was cash conversion of about 71% and a modest 2.28% dividend yield. The stock trades 10% below its own history on EV/EBITDA, but the portal's model implies minus 35% to fair value, and these arguments offset each other. The verdict is neutral: confirmation of the margin in the next report and higher commodity prices would improve attractiveness, while a return of the margin to last year's level would reduce it.
Open the company's financial profile INCO →
See also: market overview · valuation map · stock screeners