Revenue rose 11.6% but profit stood still – the margin gave up 0.9 pp
The nine-month 2026 report shows revenue of 101,490.0 bn IDR (+11.6% year on year) and net profit of 7,865.8 bn IDR (–0.2%). Revenue growth did not reach the bottom line: the net margin fell from 8.7% to 7.8%. Yet the stock trades at EV/EBITDA of 2.7 – below its own three-year average of 3.4 – and the portal's model puts upside to fair value at +44%; with a 4.5% dividend yield and net debt at 0.85 EBITDA the share looks attractive, but weak conversion of revenue into profit is the main argument against.
Key takeaways
— Nine-month revenue rose 11.6% to 101,490.0 bn IDR, but profit stayed at last year's level
— The net margin fell from 8.7% to 7.8% – revenue growth did not reach the bottom line
— Nine-month operating cash flow was 12,247.5 bn IDR and covers the profit
— Net debt of 26,086.7 bn IDR is 0.85 trailing-twelve-month EBITDA – a moderate burden
— A 4.5% trailing dividend yield is more than profit growth delivers
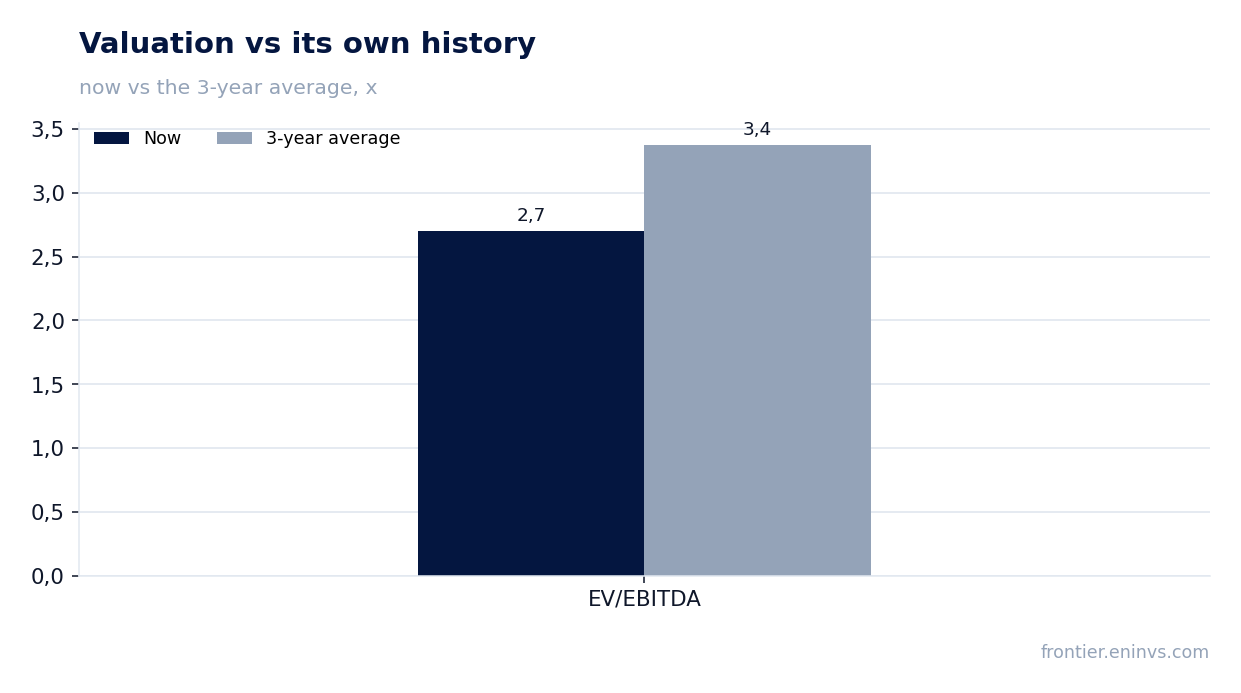
— EV/EBITDA of 2.7 against its own three-year average of 3.4 – the stock is 20% cheaper than its history
— The portal's model puts upside to fair value at +44%, but it rests on a margin recovery
Attractiveness
Key figures, IDR bn
| Metric | 9M 2025 | 9M 2026 | Change |
|---|---|---|---|
| Revenue | 90 981 | 101 490 | +11.6% |
| EBITDA | 20 898 | — | — |
| Operating profit | 18 098 | — | — |
| Net profit | 7 881 | 7 866 | -0.2% |
| Operating cash flow | 10 360 | 12 248 | +18.2% |
| EBITDA margin | 23.0% | — | — |
| Net margin | 8.7% | 7.8% | -0.9 pp |
Nine-month revenue rose 11.6% to 101,490.0 bn IDR, but profit stayed at last year's level
For the nine months of 2026 revenue was 101,490.0 bn IDR, 11.6% more than a year earlier. That is solid growth for a mature business: the company is expanding faster than its recent average.
Net profit for the same period was 7,865.8 bn IDR, 0.2% below last year's. Formally that is stagnation: the entire revenue gain went into costs rather than the result.
The gap between revenue and profit dynamics is the main fact of the report. It means operating leverage did not work: turnover growth was not matched by efficiency gains.
The net margin fell from 8.7% to 7.8% – revenue growth did not reach the bottom line
The net margin for the nine months of 2026 was 7.8% against 8.7% a year earlier. A 0.9 pp decline with revenue up 11.6% means costs grew faster than income.
Profit stayed at last year's level on revenue 11.6% higher – so each additional unit of revenue brought less profit than before. This may be due to cost growth or a change in the sales mix, but the report does not disclose the cause.
For an investor this is the key risk: if the margin keeps falling, even double-digit revenue growth will not deliver profit growth.
Nine-month operating cash flow was 12,247.5 bn IDR and covers the profit
Operating cash flow for the nine months of 2026 was 12,247.5 bn IDR, above net profit of 7,865.8 bn IDR. That is a good sign: profit is backed by cash, not just accounting accruals.
Over the trailing twelve months operating cash flow was 21,428.3 bn IDR against net profit of 10,669.1 bn IDR. The excess of cash flow over profit is stable, pointing to accounting quality and working-capital management.
Free cash flow after capex is not disclosed in the facts, but with such operating cash flow the company can fund both investment and dividends without adding debt.
Net debt of 26,086.7 bn IDR is 0.85 trailing-twelve-month EBITDA – a moderate burden
Net debt at 30 September 2026 was 26,086.7 bn IDR. Over the quarter it rose from 25,291.6 bn IDR at 30 June 2026, i.e. by 795.1 bn IDR. Over 12 months it fell from 32,935.8 bn IDR at 30 September 2025 – by 6,849.1 bn IDR.
The ratio of net debt to trailing-twelve-month EBITDA is 0.85. That is a moderate level: the company services its debt without strain, and the headroom to typical covenants remains large.
Trailing-twelve-month EBITDA is 30,871.6 bn IDR. On such a base even noticeable debt growth will not push the ratio into dangerous territory.
A 4.5% trailing dividend yield is more than profit growth delivers
The trailing-twelve-month dividend yield is 4.5%. That is above the current profit growth: nine-month profit fell 0.2%, while the dividend remains a meaningful part of the return.
Our estimate for the current year's dividend assumes the payout ratio stays at last year's level and a profit base of about 10.7 bn IDR over the trailing twelve months. On that base and a payout ratio close to last year's, the dividend will stay within the current yield. Everything depends on whether profit holds at last year's level.
A 4.5% yield is comparable to the key rate but does not significantly exceed it. For a dividend stock that is a moderately attractive level, especially given the risk of falling profit.
A further margin decline could cut the payout: if full-year profit comes in below last year's, the payout will have to be reduced or funded from debt.
EV/EBITDA of 2.7 against its own three-year average of 3.4 – the stock is 20% cheaper than its history
Trailing-twelve-month EV/EBITDA is 2.7 against its own three-year average of 3.4. The stock trades 20% below its history on this multiple.
Trailing-twelve-month P/E is 5.3. For a company with a 7.8% margin and moderate debt this is a low level, reflecting either undervaluation or the market's doubts about profit sustainability.
The multiple's discount to history may be due to falling profit: the market is pricing in the risk of further margin compression. If profit stabilises, the multiple has room to return to its average.
The portal's model puts upside to fair value at +44%, but it rests on a margin recovery
The portal's model puts upside to fair value at +44%. This is our own estimate, based on EBITDA growth and a target multiple, not a market consensus.
The upside rests on two assumptions: continued revenue growth and a margin recovery. If the margin stays at 7.8%, profit will not grow and the model will have to be revised.
For an investor this means the current price already reflects weak profit, but does not guarantee that the margin will recover. The +44% upside is a benchmark, not a promise.
Valuation on the latest reported figures
| Metric | Value |
|---|---|
| Market cap | 56 195 bn IDR |
| P/E (LTM) | 5.3 |
| EV/EBITDA (LTM) | 2.7 |
| P/B | 0.77 |
| Net debt / EBITDA (LTM) | 0.85 |
| Operating cash flow (LTM) | 21 428 bn |
| ROE | 13.4% |
| Dividend yield (12m) | 4.5% |
| EV/EBITDA, 3-year average | 3.4 |
Tracked metrics of the idea
The metrics we track our idea "Indofood (13 ideas)" of 2026-07-16 by - at the idea date and now. The share price moved -5% over the period. Original write-up: https://frontier.eninvs.com/region/us/article/ideas
Idea: at publication and now
| Metric | 2026-07-16, price 6,750 | Now, price 6,400 |
|---|---|---|
| Fundamental value created, share of market cap | +28% | +44% |
Bottom line
The strong side of the report is revenue: 11.6% growth to 101,490.0 bn IDR and operating cash flow of 12,247.5 bn IDR that covers profit. The weak side is profit: it stayed at last year's level while the margin fell from 8.7% to 7.8%. Debt is moderate at 0.85 EBITDA, and the 4.5% dividend yield supports the stock. The question for a holder now is whether the margin will recover: without that, revenue growth will not deliver profit growth, and the portal's +44% upside will remain a benchmark rather than a result. The verdict is attractive: the multiple is below its own history, debt is moderate, the dividend is above average, but all of this rests on profit stabilising.
Open the company's financial profile INDF →
See also: market overview · valuation map · stock screeners