Kalbe Farma: 9M revenue up 11.5% but profit lagged – margin compressed to 9.4%
On 25 November Kalbe Farma reported results for the first nine months of 2026. Revenue reached IDR 28,974.0 bn, up 11.5% year on year, while net profit rose only 4.0% to IDR 2,736.9 bn and the net margin fell to 9.4% from 10.1% a year earlier. The company holds a net cash position of IDR 5,128.1 bn, and the stock trades at EV/EBITDA of 5.1 – almost half its own three-year average. At the current price the share looks rather attractive: revenue growth outpaces profit, but the valuation and a 2.7% dividend yield compensate.
Key takeaways
— 9M revenue rose 11.5% but profit added only 4.0% – the margin compressed to 9.4%
— Net cash of IDR 5,128.1 bn at end-September rose by IDR 1,122.8 bn over the quarter
— 9M operating cash flow was IDR 2,633.4 bn – well below net profit
— EV/EBITDA of 5.1 is almost half its own three-year average of 9.8
— A 2.7% dividend yield backed by a stable profit base
— On the portal's model the upside to fair value is 6%
Attractiveness
Key figures, IDR bn
| Metric | 9M 2025 | 9M 2026 | Change |
|---|---|---|---|
| Revenue | 25 988 | 28 974 | +11.5% |
| EBITDA | 3 875 | — | — |
| Operating profit | 3 326 | — | — |
| Net profit | 2 631 | 2 737 | +4.0% |
| Operating cash flow | 2 176 | 2 633 | +21.0% |
| Capex | -506 | — | — |
| EBITDA margin | 14.9% | — | — |
| Net margin | 10.1% | 9.4% | -0.7 pp |
9M revenue rose 11.5% but profit added only 4.0% – the margin compressed to 9.4%
Revenue for the first nine months of 2026 reached IDR 28,974.0 bn, 11.5% more than in the same period a year earlier. That is noticeably faster than in the first quarter of 2026, when growth was 9.4% year on year. The acceleration suggests demand for the company's products remains solid.
Net profit rose only 4.0% to IDR 2,736.9 bn. The net margin fell to 9.4% from 10.1% a year earlier. The gap between revenue and profit growth means costs are rising faster than income, and that is the main question of this report.
In the first quarter of 2026 revenue was IDR 9,678.4 bn and net profit IDR 1,028.9 bn. These figures relate to a standalone quarter and are not directly comparable with the nine-month cumulative total, but they show the company began the year with revenue growth of 9.4%.
Net cash of IDR 5,128.1 bn at end-September rose by IDR 1,122.8 bn over the quarter
Net debt at 30 September 2026 was negative at minus IDR 5,128.1 bn, meaning the company holds a net cash position. It grew over the quarter: at 30 June the figure was minus IDR 4,005.3 bn, a change of minus IDR 1,122.8 bn.
Over twelve months the cash position increased: at 30 September 2025 it was minus IDR 3,526.6 bn, by 30 September 2026 it was minus IDR 5,128.1 bn, a change of minus IDR 1,601.6 bn. The larger cash cushion supports financial stability.
The net debt to EBITDA ratio for the trailing twelve months is minus 0.93. The negative value reflects a net cash position rather than leverage. This level is not compared with earlier values because no earlier data is in the facts.
9M operating cash flow was IDR 2,633.4 bn – well below net profit
Operating cash flow for the first nine months of 2026 was IDR 2,633.4 bn, below net profit of IDR 2,736.9 bn. The gap means part of the profit settled in working capital rather than turning into cash.
Over the trailing twelve months operating cash flow was IDR 3,727.6 bn against net profit of IDR 3,770.5 bn. Over the longer horizon the gap is smaller, but in the reported period it is more visible.
The facts do not disclose the capex structure for the nine months. In the first quarter of 2026 capex was IDR 174.8 bn, which gives a sense of the scale of investment but does not allow a judgement about the full year.
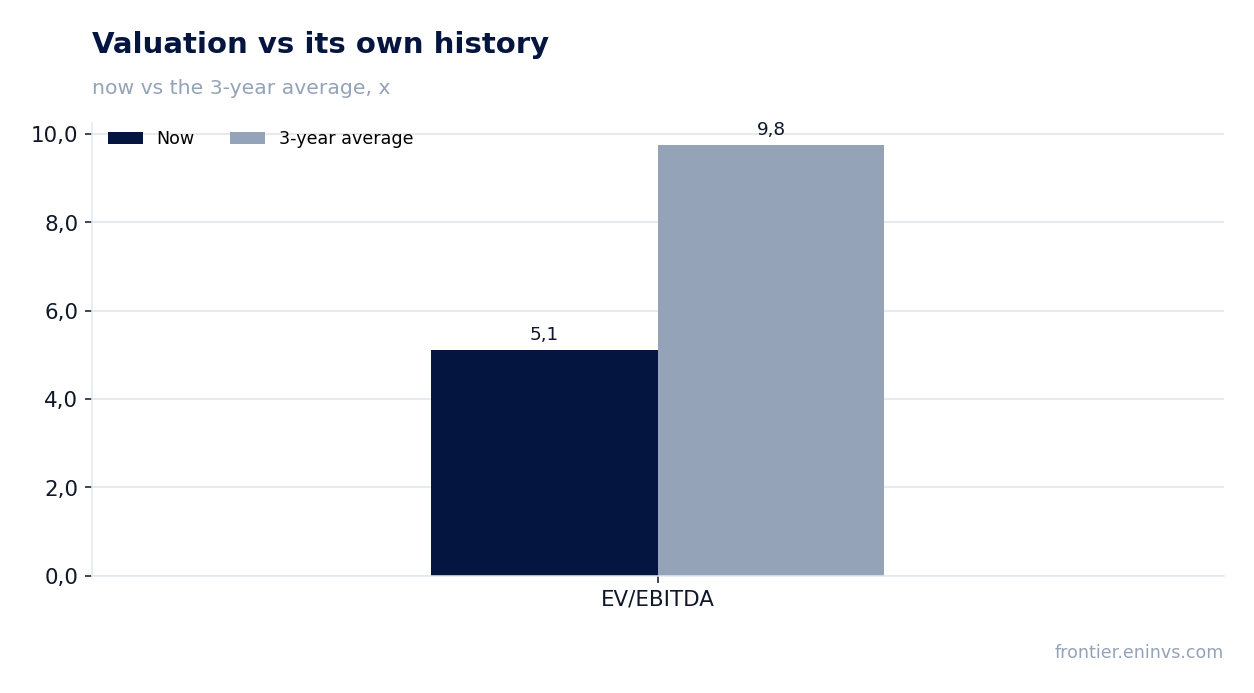
EV/EBITDA of 5.1 is almost half its own three-year average of 9.8
EV/EBITDA for the trailing twelve months is 5.1 against its own three-year average of 9.8. The stock trades 48% below its historical valuation on this multiple.
P/E for the trailing twelve months is 8.6. With a market capitalisation of IDR 32,353.0 bn and net cash of IDR 5,128.1 bn, the valuation looks modest for a company with growing revenue.
On the portal's model fair value implies upside of plus 6% to the current price. This is the portal's own estimate, not a market consensus.
A 2.7% dividend yield backed by a stable profit base
The dividend yield for the trailing twelve months is 2.7%. The company pays dividends, and their size rests on stable profit: over the trailing twelve months net profit was IDR 3,770.5 bn.
Our estimate of the current-year dividend assumes the payout ratio and profit remain at the trailing-twelve-month level. The payout depends on the payout ratio and one-off factors that may affect profit.
A yield of 2.7% is modest relative to the key rate, but with EV/EBITDA of 5.1 and a net cash position the dividend looks sustainable. A smaller payout is possible if profit falls or capex rises.
On the portal's model the upside to fair value is 6%
On the portal's model fair value implies plus 6% upside to the current price. The model uses EBITDA growth and a target multiple.
The share is held in the portal's live model strategies – ID FVC (quality). This is a fact of membership, not an argument for the verdict.
The EV/EBITDA valuation of 5.1 is below its own three-year average of 9.8, which supports the view that the share is undervalued relative to its own history.
Valuation on the latest reported figures
| Metric | Value |
|---|---|
| Market cap | 32 353 bn IDR |
| P/E (LTM) | 8.6 |
| EV/EBITDA (LTM) | 5.1 |
| P/B | 1.31 |
| Net debt / EBITDA (LTM) | -0.93 |
| Operating cash flow (LTM) | 3 728 bn |
| ROE | 13.9% |
| Dividend yield (12m) | 2.7% |
| EV/EBITDA, 3-year average | 9.8 |
Bottom line
The strong side of the report is revenue growth of 11.5% and a net cash position of IDR 5,128.1 bn. The weak side is that profit rose only 4.0% and the margin compressed to 9.4%. The EV/EBITDA valuation of 5.1 is almost half its own three-year average, making the share cheap relative to its history. The main question for a holder is whether the company can restore the margin while keeping revenue growth. The verdict is rather attractive.
Open the company's financial profile KLBF →
See also: market overview · valuation map · stock screeners