ID_PGAS: 9M revenue up 3.3% but profit down 13.5% as margin compresses to 9.7%
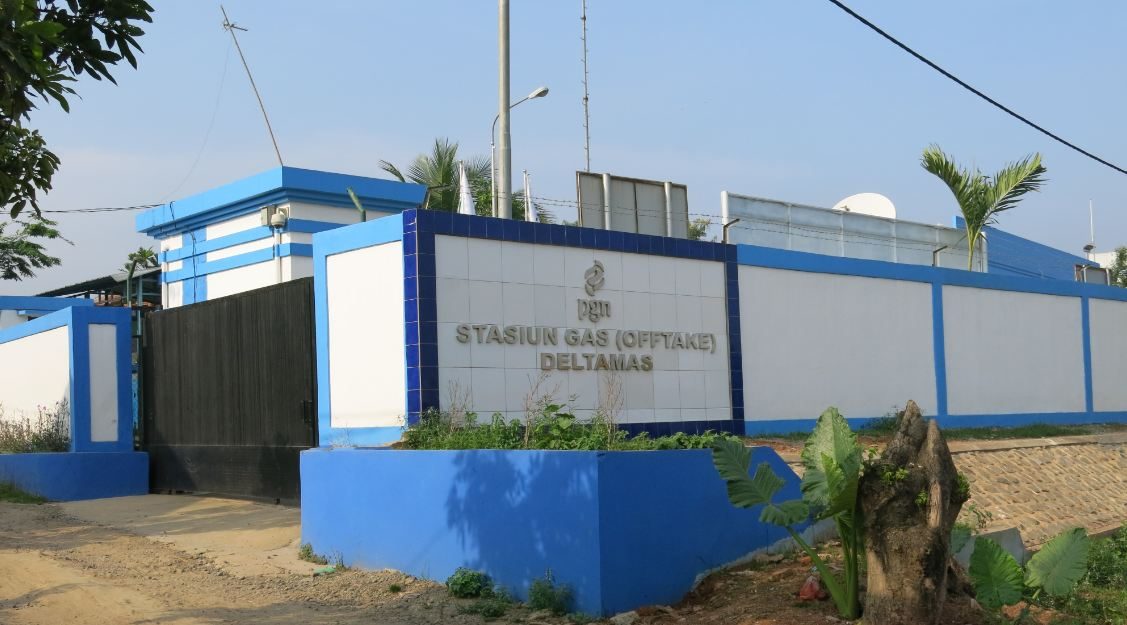
On 30 September ID_PGAS released its results for 9M 2026. Revenue reached USD 3,019.2m, up 3.3% year on year, while net profit fell 13.5% to USD 292.9m and the net margin narrowed to 9.7% from 11.6% a year earlier. The company retains a net cash position of USD 1,050.1m and trades at P/E LTM 6.7 and EV/EBITDA LTM 0.70. With a dividend yield of 9.5% and a low valuation, the share looks rather attractive, though the margin compression needs confirmation in the next report.
Key takeaways
— 9M revenue rose 3.3% to USD 3,019.2m, but net profit fell 13.5% as the net margin compressed to 9.7% from 11.6%
— Net cash of USD 1,050.1m and net debt/EBITDA LTM of -0.72 mean the company operates without debt burden
— Operating cash flow of USD 518.3m for 9M covers net profit and confirms earnings quality
— A 9.5% dividend yield against P/E LTM 6.7 and EV/EBITDA LTM 0.70 – the valuation is below its own history and does not reflect the cash cushion
— ROE of 10.9% with no debt – return on equity remains double-digit despite the profit decline
— The share is held in the ID Commodity-Upside model strategy on the portal – a membership fact, not an argument for the verdict
Attractiveness
Key figures, USD bn
| Metric | 9M 2025 | 9M 2026 | Change |
|---|---|---|---|
| Revenue | 2.92 | 3.02 | +3.3% |
| EBITDA | 0.68 | — | — |
| Operating profit | 0.38 | — | — |
| Net profit | 0.34 | 0.29 | -13.5% |
| Operating cash flow | 0.44 | 0.52 | +17.9% |
| Capex | 0.08 | — | — |
| EBITDA margin | 23.2% | — | — |
| Net margin | 11.6% | 9.7% | -1.9 pp |
9M revenue rose 3.3% to USD 3,019.2m, but net profit fell 13.5% as the net margin compressed to 9.7% from 11.6%
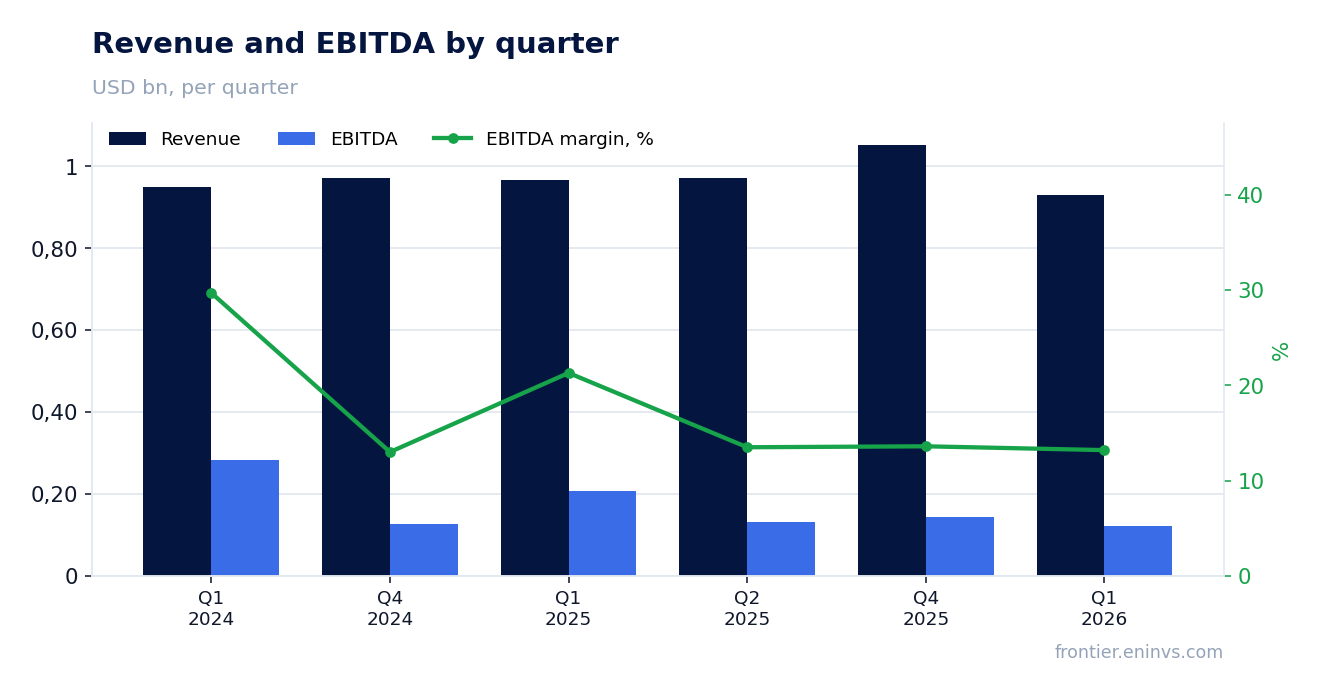
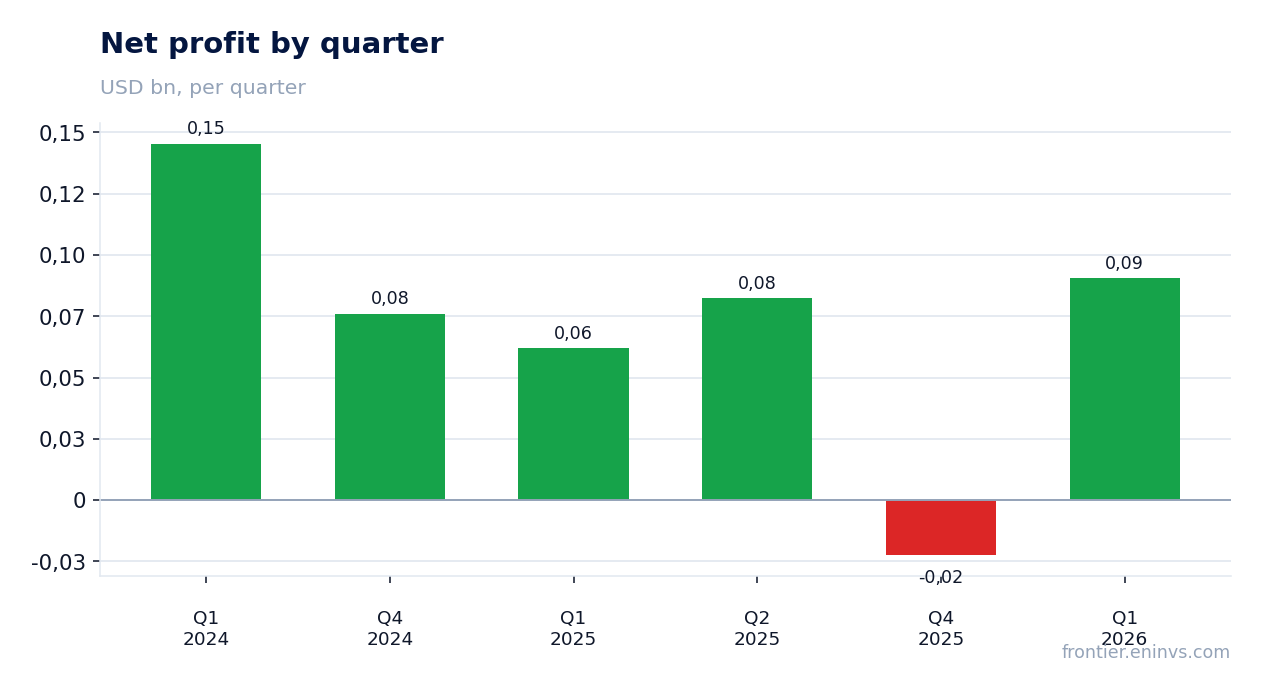
Revenue for 9M 2026 reached USD 3,019.2m, up 3.3% year on year. The growth is modest but steady: the company is expanding turnover against stable demand. However, net profit for the same period fell 13.5% to USD 292.9m – revenue growth did not translate into profit.
The key reason is the net margin compression to 9.7% from 11.6% a year earlier. A gap of 1.9 percentage points on revenue of about USD 3bn means a significant part of operating costs grew faster than income. The facts do not disclose the specific cost lines, so we limit ourselves to stating: the margin declined, and this is the main negative of the report.
For an investor, it matters that the profit decline did not stem from one-off write-offs or losses – net profit remains positive and substantial. The question is whether the margin compression is temporary or reflects structural cost pressure. The next report will provide the answer.
Net cash of USD 1,050.1m and net debt/EBITDA LTM of -0.72 mean the company operates without debt burden
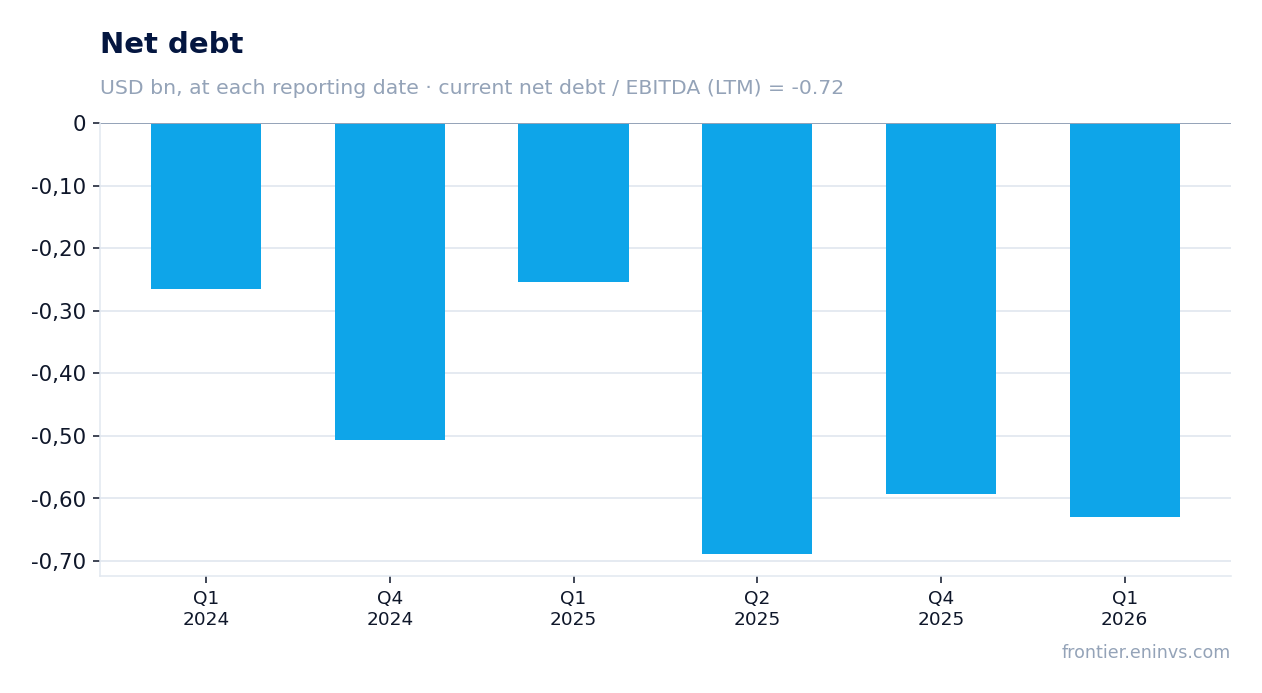
As of 30 September 2026, the net cash position stood at USD 1,050.1m – the company holds more cash than debt. The net debt/EBITDA LTM ratio is -0.72, confirming the absence of debt burden. This is a significant advantage in a high-rate environment: the company does not depend on borrowing costs.
During the quarter from 30 June to 30 September 2026, the net cash position rose from USD 0.9bn to USD 1.1bn (a change of -USD 0.1bn on the net debt line). Over the year, from 30 September 2025, it increased from USD 0.3bn to USD 1.1bn (a change of -USD 0.7bn). Such liquidity growth alongside declining profit points to strong operating cash flow and possibly restrained capital expenditure.
The cash cushion of USD 1,050.1m against a market capitalisation of USD 1,623.4m means more than half of the capitalisation is covered by cash. This materially reduces risk for shareholders and provides room for dividends or buybacks.
Operating cash flow of USD 518.3m for 9M covers net profit and confirms earnings quality
Operating cash flow for 9M 2026 reached USD 518.3m, significantly exceeding net profit of USD 292.9m. The nearly 1.8x excess indicates that profit is backed by real cash rather than accounting accruals. This is an important indicator of reporting quality.
Over the trailing twelve months, operating cash flow was USD 736.0m against LTM net profit of USD 243.8m – an even more impressive ratio. The company generates stable cash flow that allows it to build its cash cushion and pay dividends.
Capital expenditure is not broken out as a separate line for 9M in the facts, but its level does not prevent the cash position from growing. Free cash flow is likely positive and covers dividend payments. This is a key argument for the resilience of the business.
A 9.5% dividend yield against P/E LTM 6.7 and EV/EBITDA LTM 0.70 – the valuation is below its own history and does not reflect the cash cushion
The dividend yield over the trailing twelve months is 9.5% – a high level that significantly exceeds the yield on most debt instruments. Payments are covered by operating cash flow, and the cash cushion of USD 1,050.1m provides a margin of safety to maintain the dividend even if profit declines.
The valuation looks low: P/E LTM 6.7 and EV/EBITDA LTM 0.70. The facts do not provide data on average multiples over the past 3 years for comparison with its own history, so we limit ourselves to stating the current level. EV/EBITDA below 1 is rare for a profitable business and reflects either undervaluation or market scepticism about profit resilience.
Return on equity of 10.9% with no debt is a respectable figure. However, the 13.5% decline in net profit over 9M creates a risk that dividend payments may be revised in the future if the margin does not recover. For now, the 9.5% yield looks attractive to income-oriented investors.
ROE of 10.9% with no debt – return on equity remains double-digit despite the profit decline
Return on equity (ROE) over the trailing twelve months was 10.9%. This double-digit level indicates that the company efficiently uses shareholders' capital. The absence of debt means the entire effect is achieved through operations rather than financial leverage.
The 13.5% decline in net profit over 9M puts pressure on ROE, but the indicator remains above the cost of capital. If the margin recovers, ROE could return to higher levels. Otherwise, pressure on profitability will persist.
For shareholders, it matters that ROE exceeds the risk-free rate, making investment in the company's capital justified. However, the sustainability of the indicator depends on the company's ability to maintain its margin.
The share is held in the ID Commodity-Upside model strategy on the portal – a membership fact, not an argument for the verdict
The ID_PGAS share is included in the ID Commodity-Upside model strategy available on the portal. This is a fact reflecting the security's compliance with the strategy's selection criteria, but it is not an argument for the investment verdict. The inclusion decision was based on the strategy's methodology, not our analysis.
Membership in the strategy may serve as an additional reference for investors following model portfolios, but it does not replace fundamental valuation. We treat it as background information.
Valuation on the latest reported figures
| Metric | Value |
|---|---|
| Market cap | 1.62 bn USD |
| P/E (LTM) | 6.7 |
| EV/EBITDA (LTM) | 0.7 |
| P/B | 0.45 |
| Net debt / EBITDA (LTM) | -0.72 |
| Operating cash flow (LTM) | 0.74 bn |
| ROE | 10.9% |
| Dividend yield (12m) | 9.5% |
Bottom line
The report's strengths are the cash cushion of USD 1,050.1m, operating cash flow of USD 518.3m and a 9.5% dividend yield. The weakness is the 13.5% decline in net profit due to margin compression. The valuation of P/E LTM 6.7 and EV/EBITDA LTM 0.70 looks low, but without historical multiple data we cannot claim the share trades below its own history. The verdict is rather attractive: the cash position and dividend outweigh the risk of profit decline, but the next report is needed to confirm margin resilience.
Open the company's financial profile PGAS →
See also: market overview · valuation map · stock screeners