Profit tripled, but it is already in the price: net debt turned negative while the multiple sits above its own history
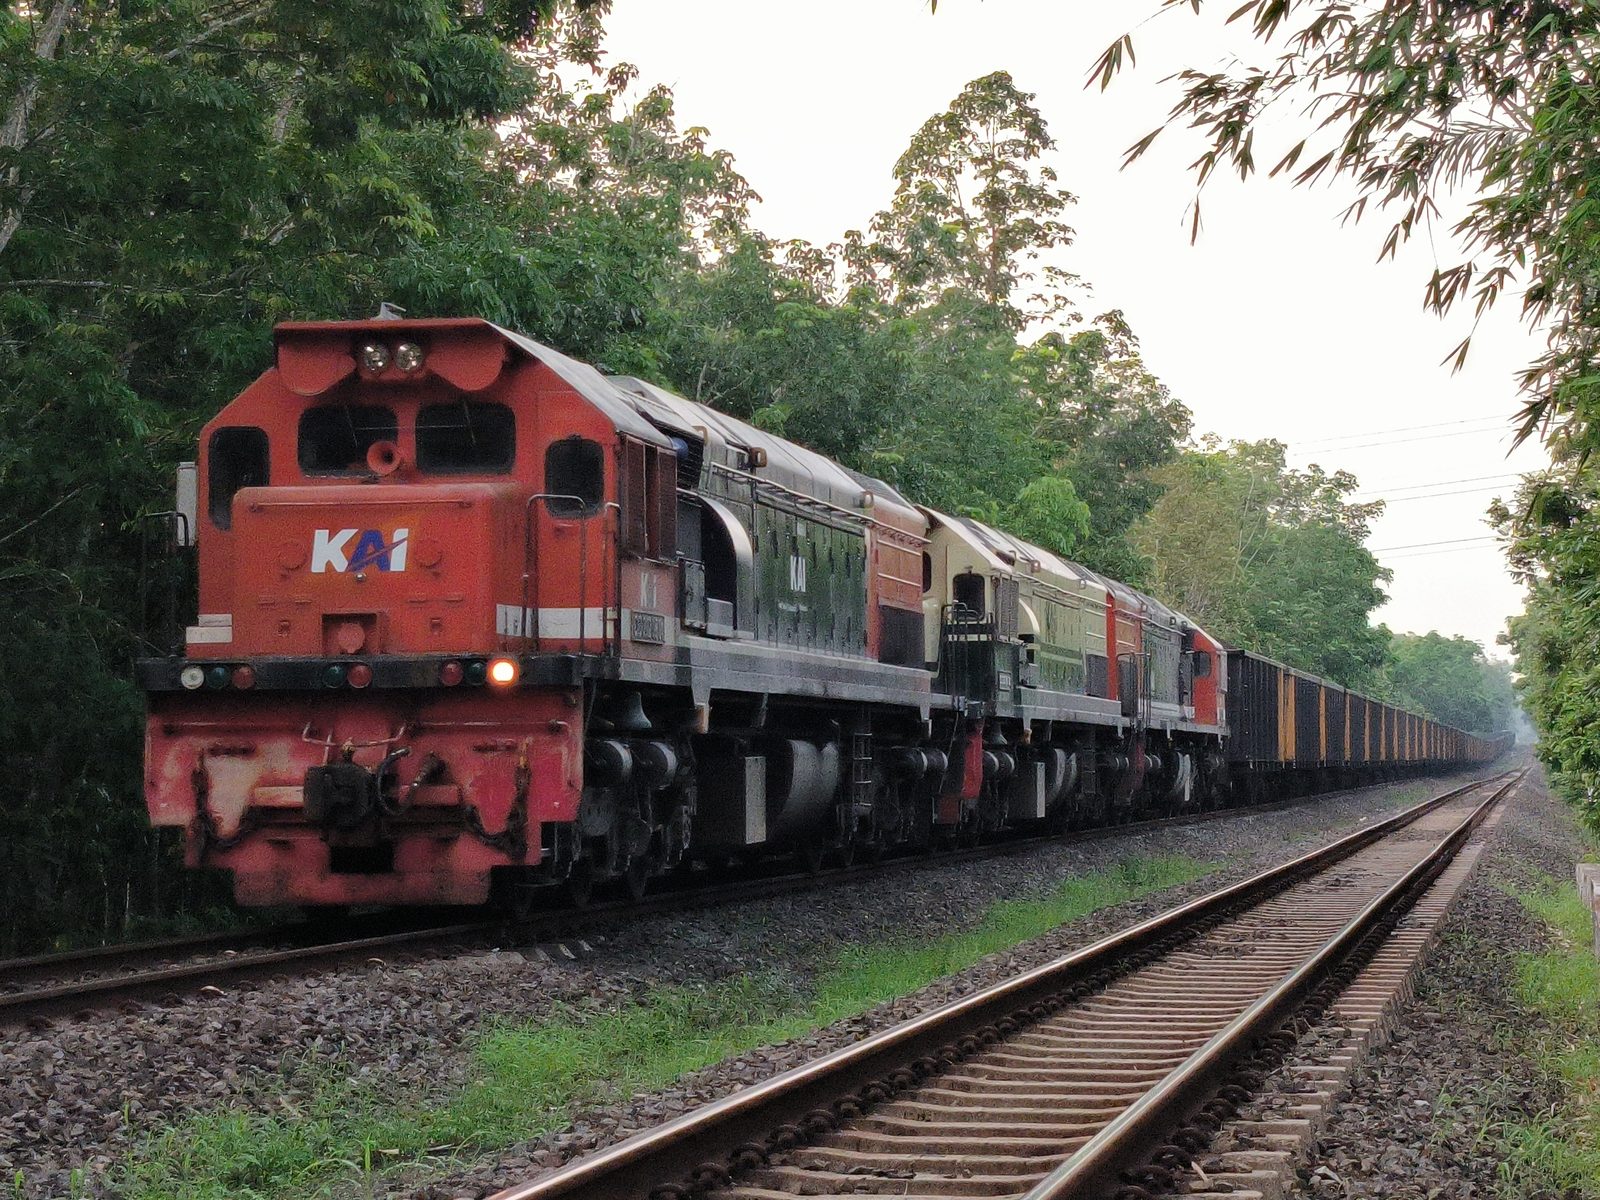
The nine-month 2026 report showed revenue of IDR 35.2 trn and net profit of IDR 4.4 trn – up 12.4% and 216.4% year on year respectively. Net margin rose from 4.4% to 12.5%, and net debt at 30 September 2026 turned negative at minus IDR 197.4 bn. The stock trades at EV/EBITDA LTM 5.0 – 8% above its own three-year average of 4.6 – and with a 3.5% dividend yield looks rather attractive than not, but only thanks to the portal model's +62% upside to fair value.
Key takeaways
— Nine-month revenue rose 12.4% to IDR 35.2 trn, but in the first quarter of 2026 it already fell 0.3% year on year
— Nine-month net profit tripled to IDR 4.4 trn, with net margin up from 4.4% to 12.5%
— Nine-month operating cash flow reached IDR 4.4 trn, almost matching net profit
— Net debt turned negative at 30 September 2026 – minus IDR 197.4 bn against minus IDR 3.9 trn at 30 June
— Trailing twelve-month dividend yield is 3.5%, and the payout rests on profit rather than borrowed money
— EV/EBITDA LTM of 5.0 is 8% above its own three-year average of 4.6, so the stock is dearer than its own history
— The portal model implies +62% upside to fair value on EBITDA repriced to current commodity prices
Attractiveness
Key figures, IDR bn
| Metric | 9M 2025 | 9M 2026 | Change |
|---|---|---|---|
| Revenue | 31 330 | 35 201 | +12.4% |
| EBITDA | 3 072 | — | — |
| Operating profit | 1 596 | — | — |
| Net profit | 1 394 | 4 411 | +216.4% |
| Operating cash flow | 4 204 | 4 436 | +5.5% |
| Capex | 2 449 | — | — |
| EBITDA margin | 9.8% | — | — |
| Net margin | 4.4% | 12.5% | +8.1 pp |
Nine-month revenue rose 12.4% to IDR 35.2 trn, but in the first quarter of 2026 it already fell 0.3% year on year
Nine-month 2026 revenue came to IDR 35.2 trn, 12.4% more than a year earlier. This is a cumulative figure, and it rests on the first two quarters rather than the last one.
The first quarter of 2026 alone delivered IDR 9.9 trn – 0.3% less than in the first quarter of 2025. A year earlier the same quarter was growing at 5.8%, so top-line growth stalled by the start of 2026. The facts do not disclose the cause, and it is not worth substituting seasonality or one-offs.
For a holder this means the 12.4% annual revenue growth is more a base from past periods than current momentum. The next report will show whether revenue returned to growth or the first quarter marked the start of a weaker year.
Nine-month net profit tripled to IDR 4.4 trn, with net margin up from 4.4% to 12.5%
Nine-month 2026 net profit reached IDR 4.4 trn against IDR 1.4 trn a year earlier – growth of 216.4%. Net margin rose from 4.4% to 12.5%, meaning every IDR 100 of revenue now leaves IDR 12.5 of profit instead of IDR 4.4.
Such a jump in margin with revenue up only 12.4% means costs, not sales, drove the profit. The facts do not disclose which cost line shrank, so the source cannot be named – only the result is visible.
For valuation it matters that the IDR 4.4 trn profit is nine months, not a year. Over the trailing twelve months net profit was IDR 5.9 trn, and that is the base used in the multiples below.
Nine-month operating cash flow reached IDR 4.4 trn, almost matching net profit
Nine-month 2026 operating cash flow came to IDR 4.4 trn – almost exactly the net profit. Profit converts into cash rather than piling up in working capital.
Over the trailing twelve months operating cash flow was IDR 6.5 trn against net profit of IDR 5.9 trn, so more cash came in than profit was booked. This removes the main question about the accounts – earnings quality here is confirmed by cash.
Free cash flow after capex is not disclosed in the facts, so how much remains for dividends after investment can only be judged indirectly. But operating cash flow itself is positive and stable.
Net debt turned negative at 30 September 2026 – minus IDR 197.4 bn against minus IDR 3.9 trn at 30 June
At 30 September 2026 net debt stood at minus IDR 197.4 bn, meaning cash on hand exceeds debt. At 30 June the same measure was minus IDR 3.9 trn, a change of +IDR 3.7 trn over the quarter.
A year earlier, at 30 September 2025, net debt was positive at IDR 304.4 bn. Over twelve months it moved by minus IDR 501.8 bn and crossed into negative territory. The company did not merely cut borrowings – it built a cash cushion.
Net debt to LTM EBITDA is minus 0.03, so debt is effectively absent. The facts do not give the direction of this ratio, so we state the level only: there is no leverage, and that removes interest risk from the equation.

Trailing twelve-month dividend yield is 3.5%, and the payout rests on profit rather than borrowed money
Trailing twelve-month dividend yield is 3.5% on the current price. The payout rests on IDR 5.9 trn of profit over the same period and IDR 6.5 trn of operating cash flow – the money for the dividend exists inside the business.
Our estimate for the current year's dividend is 3.5–4.0% of the price, and it hinges on two things: profit holding near IDR 5.9 trn and the current payout ratio. If profit stays at the nine-month level, the payout will not shrink; if the first quarter of 2026 marks the start of a weak year, the dividend will need revisiting.
A 3.5% yield is below the risk-free rate, but for a commodity company with zero debt and a 12.5% margin it is a normal level. A smaller payout could come from falling profit or rising capex, which the facts do not disclose.
EV/EBITDA LTM of 5.0 is 8% above its own three-year average of 4.6, so the stock is dearer than its own history
On EV/EBITDA LTM the stock trades at 5.0 against its own three-year average of 4.6 – 8% above. This is the only valid comparison: the facts do not permit comparison with a sector or peers.
P/E LTM is 5.9 and EV/EBITDA LTM is 5.0. With a market cap of IDR 35.2 trn and LTM EBITDA of IDR 7.0 trn the valuation looks low in absolute terms, but relative to itself the stock is now dearer than its three-year average.
For a holder this means further gains can only come from earnings, not from a re-rating of the multiple. If profit holds at IDR 5.9 trn the current price is justified; if profit returns to last year's level, the multiple will prove stretched.
The portal model implies +62% upside to fair value on EBITDA repriced to current commodity prices
On the portal model, where EBITDA is repriced to current commodity prices at the target EV/EBITDA, fair value is 62% above the current price. This is our own estimate, not a market consensus and not a target price.
The model rests on two assumptions: current commodity prices hold and the multiple stays at target. The first is the main risk: if prices fall, LTM EBITDA of IDR 7.0 trn will prove an inflated base and the whole calculation collapses.
The stock sits in the portal's live model strategies – ID Commodity-Upside and ID FVC (quality). That is a fact of membership by each strategy's screen, not an argument for the verdict.
Valuation on the latest reported figures
| Metric | Value |
|---|---|
| Market cap | 35 234 bn IDR |
| P/E (LTM) | 5.9 |
| EV/EBITDA (LTM) | 5.0 |
| P/B | 1.57 |
| Net debt / EBITDA (LTM) | -0.03 |
| Operating cash flow (LTM) | 6 494 bn |
| ROE | 22.5% |
| Dividend yield (12m) | 3.5% |
| EV/EBITDA, 3-year average | 4.6 |
Bottom line
The strong side of the report was not revenue, up 12.4%, but profit: IDR 4.4 trn for nine months and a 12.5% margin against 4.4% a year earlier. Cash confirms the profit – operating cash flow of IDR 4.4 trn almost matched it, and net debt at 30 September 2026 turned negative at minus IDR 197.4 bn. The weak spot is the first quarter of 2026 with revenue down 0.3%, and it is that quarter which determines whether profit holds. The stock is dearer than its own history: EV/EBITDA LTM of 5.0 against a three-year average of 4.6. The verdict is rather attractive: the 3.5% dividend and the portal model's +62% outweigh the premium to its own history, but only as long as profit holds at IDR 5.9 trn.
Open the company's financial profile PTBA →
See also: market overview · valuation map · stock screeners