Profit fell 8.5%, yet operations generated more cash than was earned
The nine-month 2026 report showed revenue of IDR 113,502 bn (+3.5% YoY) and net profit of IDR 14,446 bn (–8.5%). The net margin fell to 12.7% from 14.4% a year earlier, while operating cash flow reached IDR 48,008 bn. Leverage is moderate at 0.65x LTM EBITDA, and the stock trades below its own three-year history on EV/EBITDA. With an 11.3% dividend yield and a +9% upside on the portal's model, the share looks rather attractive than not.
Key takeaways
— Revenue grew 3.5%, but profit lagged: the margin compressed to 12.7% from 14.4%
— Operating cash flow of IDR 48,008 bn was three times net profit for the nine months
— Debt at 0.65x LTM EBITDA is a moderate level, with net debt at IDR 45,423 bn
— EV/EBITDA of 3.4 versus its own three-year average of 4.7 – the stock is 29% cheaper than its history
— An 11.3% trailing dividend yield remains the main argument for the share
— The portal's model implies +9% upside to fair value
Attractiveness
Key figures, IDR bn
| Metric | 9M 2025 | 9M 2026 | Change |
|---|---|---|---|
| Revenue | 109 617 | 113 502 | +3.5% |
| EBITDA | 54 240 | — | — |
| Operating profit | 29 173 | — | — |
| Net profit | 15 784 | 14 446 | -8.5% |
| Operating cash flow | 49 605 | 48 008 | -3.2% |
| EBITDA margin | 49.5% | — | — |
| Net margin | 14.4% | 12.7% | -1.7 pp |
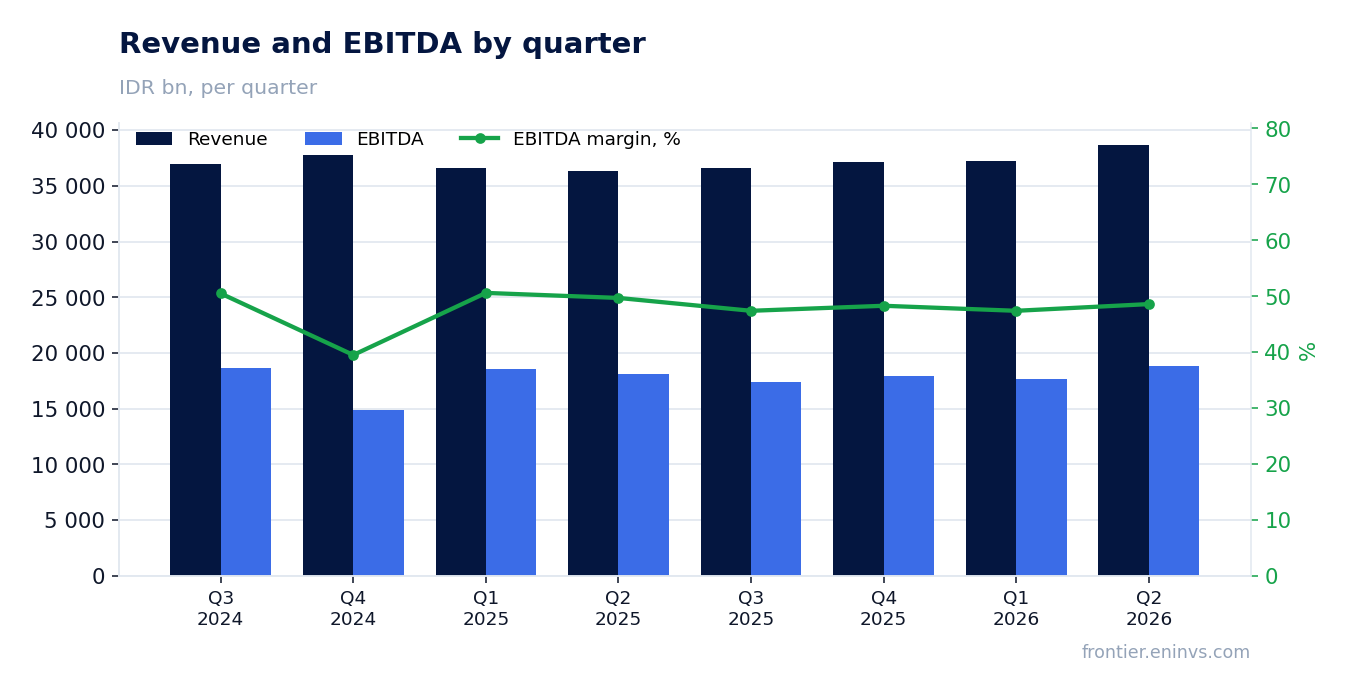
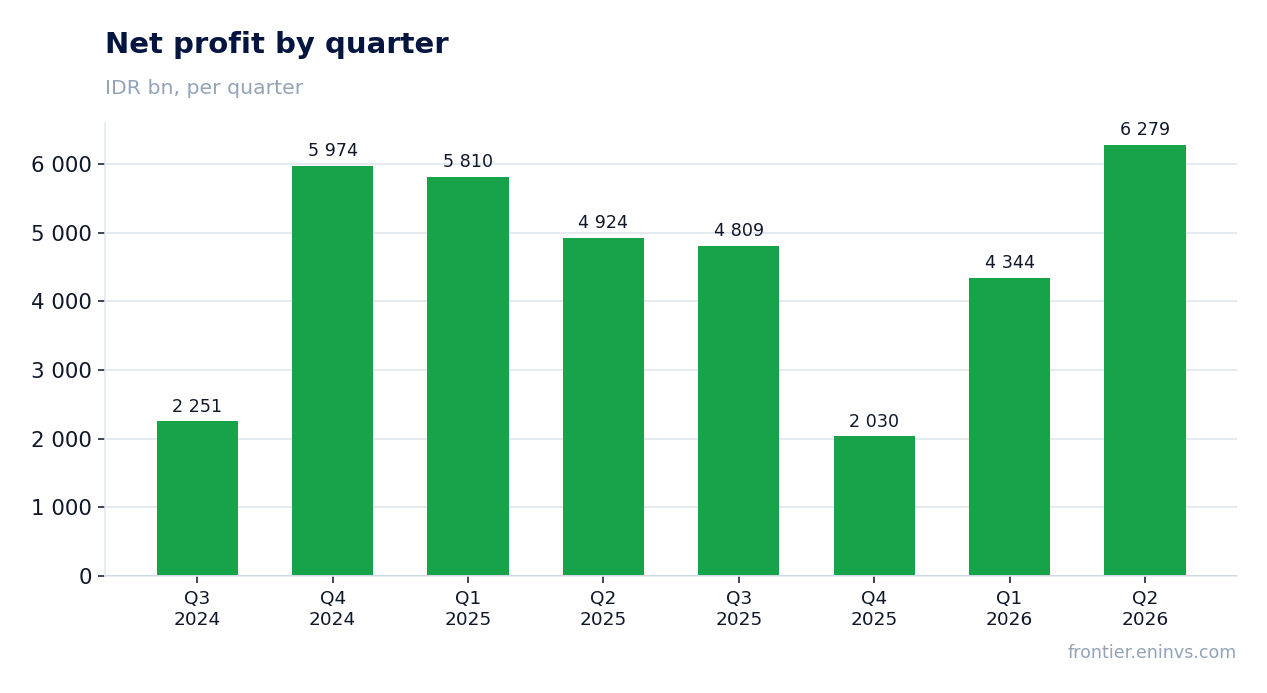
Revenue grew 3.5%, but profit lagged: the margin compressed to 12.7% from 14.4%
For the nine months of 2026, revenue reached IDR 113,502 bn, up 3.5% year on year. The growth is modest but steady: the company is expanding without sharp jumps. Net profit, however, declined 8.5% to IDR 14,446 bn.
The gap between revenue and profit is explained by margin compression: the net margin fell to 12.7% from 14.4% in the same period last year. This means costs grew faster than income. Which cost line produced this effect is not visible from the available data, but the fact of a 1.7 percentage point margin decline is the key negative of the report.
For a shareholder, this is a signal that operating leverage is working in reverse: even with positive revenue dynamics, profit is falling. The next report will show whether this was a one-off dip or a new normal.
Operating cash flow of IDR 48,008 bn was three times net profit for the nine months
Operating cash flow for the nine months of 2026 was IDR 48,008 bn – more than three times net profit. This is a strong result: the business generates real cash, not just accounting profit.
Such a gap usually implies large non-cash charges in profit or a favourable working capital change. The report details do not disclose what exactly produced this effect, but the flow itself remains the main confirmation of business quality.
Over the trailing twelve months, operating cash flow was IDR 79,535 bn, also well above LTM profit of IDR 20,820 bn. Cash generation consistently outpaces accounting profit, and this supports the ability to pay dividends.
Debt at 0.65x LTM EBITDA is a moderate level, with net debt at IDR 45,423 bn
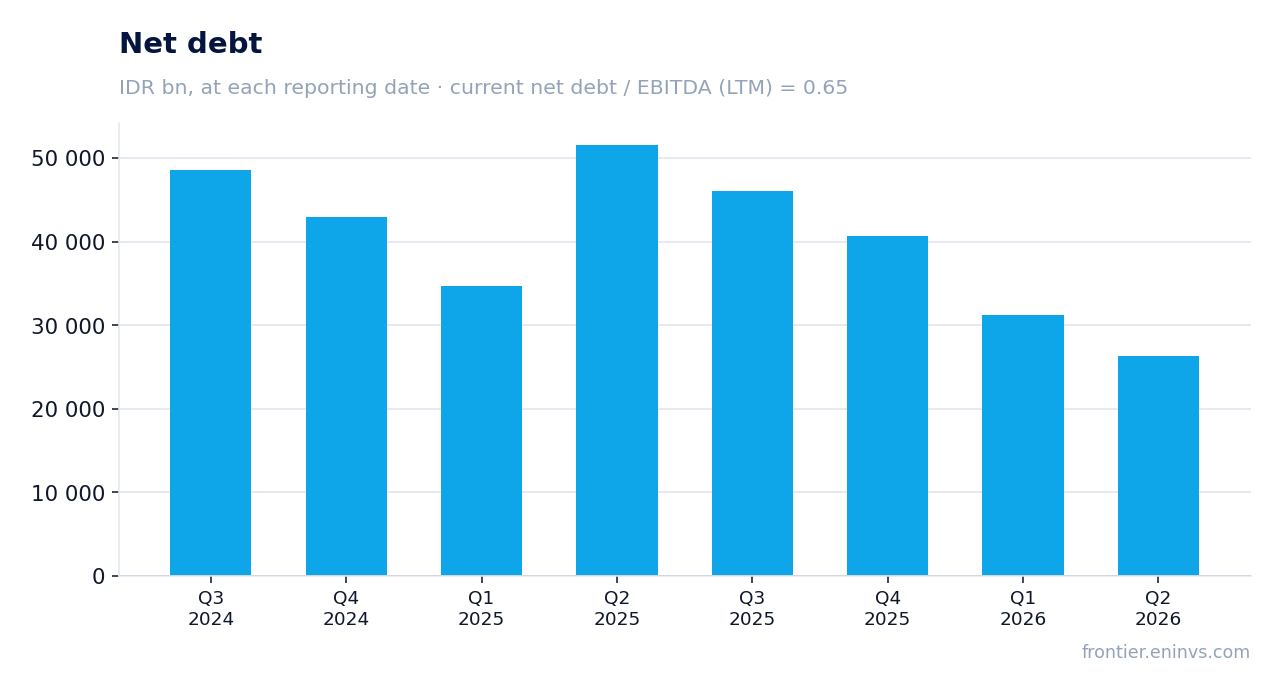
Net debt as of 30 September 2026 was IDR 45,423 bn. That is 0.65x LTM EBITDA – a moderate burden that leaves the company room to manoeuvre.
Over the quarter from 30 June 2026, net debt rose from IDR 26,306 bn to IDR 45,423 bn, a change of +IDR 19,117 bn. Over the year the picture is different: at 30 September 2025 debt stood at IDR 46,124 bn, and over 12 months it declined by IDR 701 bn. The quarterly increase is likely linked to seasonal working capital movement or a payment schedule, but the exact cause is not disclosed in the available data.
A debt-to-EBITDA ratio of 0.65 is a comfortable level. Even if EBITDA declines, the burden will remain manageable, which reduces risk for dividend payments.
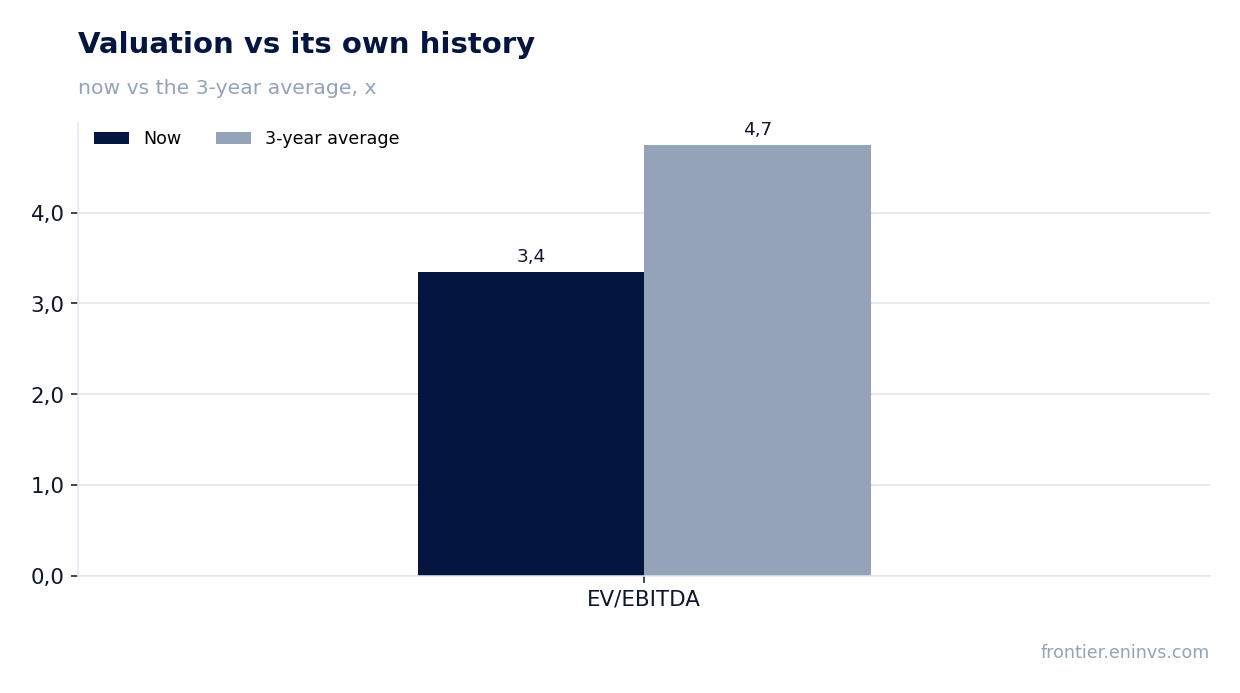
EV/EBITDA of 3.4 versus its own three-year average of 4.7 – the stock is 29% cheaper than its history
The EV/EBITDA multiple for the trailing twelve months is 3.4. That is 29% below its own three-year average of 4.7. The stock trades cheaper than usual relative to its history.
The LTM P/E is 9.4 – also a low level. At the same time, return on equity is 15.0%, indicating a decent return on capital.
The portal's model values the share at a +9% upside to fair value. This is the model's own estimate, not a market consensus, but it confirms that the current price leaves room.
An 11.3% trailing dividend yield remains the main argument for the share
The trailing twelve-month dividend yield is 11.3%. This is a high level, noticeably above the yield on risk-free instruments, and makes the share interesting for income-oriented investors.
Payments are supported by strong operating cash flow: IDR 79,535 bn over the trailing twelve months versus net profit of IDR 20,820 bn. Such a cushion allows the dividend to be maintained even if profit declines, as in the reporting period.
What could reduce the payout: further margin compression and profit decline, as well as rising debt if it requires more funds for servicing. So far, a debt-to-EBITDA ratio of 0.65 leaves room to maintain the dividend.
The portal's model implies +9% upside to fair value
According to the portal's model, which values value creation through EBITDA growth times a target multiple, the fair value of the share is 9% above the current market price. This is the model's own estimate, not a market consensus or a target price.
The 9% upside is moderate, but it is supported by a low EV/EBITDA multiple relative to history and a high dividend yield. Together this creates an attractive return for the shareholder.
It is worth remembering that the model is sensitive to the EBITDA forecast: if profit continues to fall, the valuation could decline. However, the current level of debt and cash flow provide a margin of safety.
Valuation on the latest reported figures
| Metric | Value |
|---|---|
| Market cap | 194 966 bn IDR |
| P/E (LTM) | 9.4 |
| EV/EBITDA (LTM) | 3.4 |
| P/B | 1.49 |
| Net debt / EBITDA (LTM) | 0.65 |
| Operating cash flow (LTM) | 79 535 bn |
| ROE | 15.0% |
| Dividend yield (12m) | 11.3% |
| EV/EBITDA, 3-year average | 4.7 |
Tracked metrics of the idea
The metrics we track our idea "Telkom Indonesia (13 ideas)" of 2026-07-16 by - at the idea date and now. The share price moved -22% over the period. Original write-up: https://frontier.eninvs.com/region/us/article/ideas
Idea: at publication and now
| Metric | 2026-07-16, price 2,530 | Now, price 1,980 |
|---|---|---|
| Fundamental value created, share of market cap | -1% | +9% |
Bottom line
The strong side of the report is cash flow: IDR 48,008 bn for the nine months was three times net profit, and leverage at 0.65x EBITDA remains moderate. The weak side is margin compression to 12.7% from 14.4%, which caused profit to fall 8.5% despite revenue growth of 3.5%. Valuation is cheap: EV/EBITDA of 3.4 versus its own three-year average of 4.7, and an 11.3% dividend yield supports interest in the share. The question for a holder now is whether the margin dip was one-off or sustained: the answer determines whether the dividend will be maintained at its previous level. On balance, the share looks rather attractive.
Open the company's financial profile TLKM →
See also: market overview · valuation map · stock screeners