Bajaj Auto: revenue up 57.4%, but net debt added INR 58.4 bn over the year
Bajaj Auto reported third-quarter 2026 results: revenue of INR 240.0 bn, EBITDA of INR 54.9 bn and net profit of INR 34.4 bn. Year on year revenue rose 57.4%, EBITDA 61.2% and profit 61.9%, with the EBITDA margin at 22.9%. Net debt reached INR 236.0 bn on 30 September 2026 against INR 177.6 bn a year earlier. The stock trades below its own three-year history on EV/EBITDA and looks rather attractive at the current price.
Key takeaways
— Revenue rose 57.4% year on year, but growth decelerated from 65.0% a quarter earlier
— EBITDA added 61.2% and the margin rose to 22.9% from 22.3%
— Net profit grew 61.9% and its margin to 14.3% from 13.9%
— Net debt rose from INR 177.6 bn to INR 236.0 bn over the year
— Leverage of 1.44x EBITDA LTM is a level, not a trend
— EV/EBITDA of 18.6 is 22% below its own three-year average of 24.0
— The 1.4% dividend yield is modest and the payout rests on profit
Attractiveness
Key figures, INR bn
| Metric | Q3 2025 | Q3 2026 | Change |
|---|---|---|---|
| Revenue | 153 | 240 | +57.4% |
| EBITDA | 34.0 | 54.9 | +61.2% |
| Operating profit | 33.4 | 44.9 | +34.2% |
| Net profit | 21.2 | 34.4 | +61.9% |
| EBITDA margin | 22.3% | 22.9% | +0.6 pp |
| Net margin | 13.9% | 14.3% | +0.4 pp |
Revenue rose 57.4% year on year, but growth decelerated from 65.0% a quarter earlier
In the third quarter of 2026 Bajaj Auto's revenue reached INR 240.0 bn, 57.4% more than a year earlier. That is a strong result, but it is more modest than the previous quarter: growth was 57.4% in the second quarter of 2026 and 65.0% in the first. The deceleration is the main signal in the top line.
The absolute gain quarter on quarter is also visible: from INR 208.7 bn in the second quarter to INR 240.0 bn in the third. The company is scaling up, but the annual rate is no longer accelerating. For a holder this means the market may expect more moderate figures from the next reports.
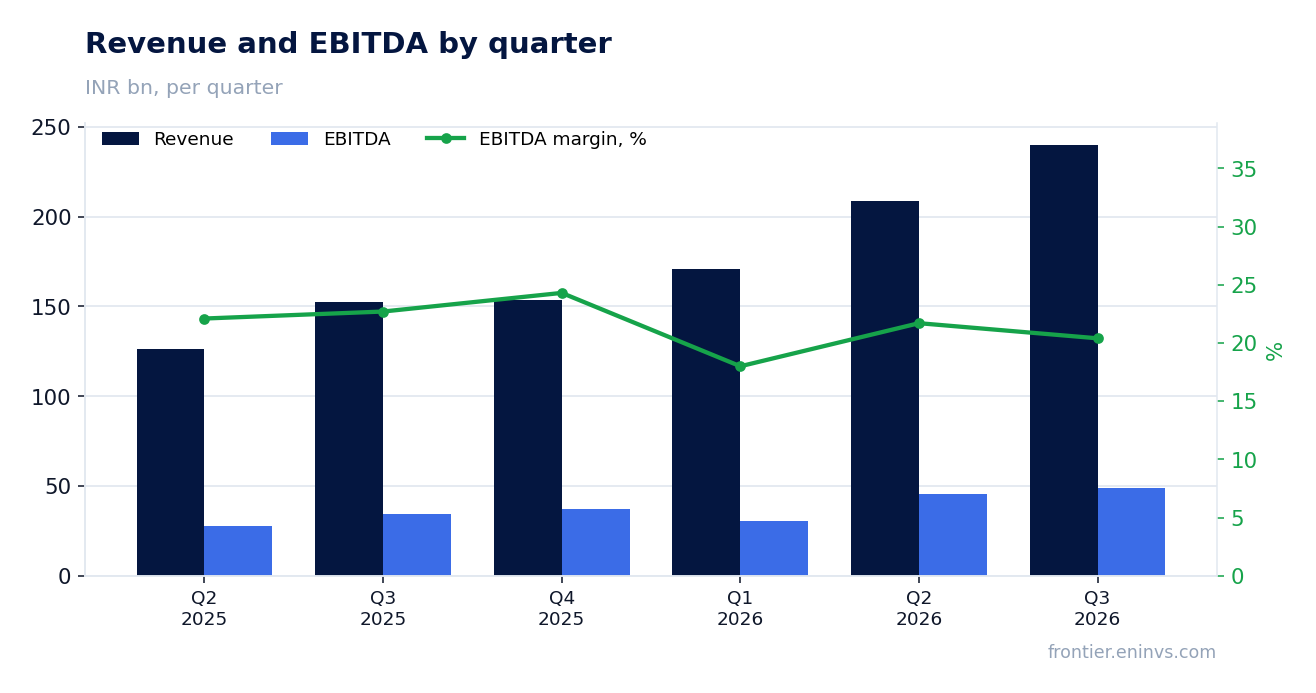
EBITDA added 61.2% and the margin rose to 22.9% from 22.3%
EBITDA for the third quarter of 2026 was INR 54.9 bn, 61.2% more than a year earlier. EBITDA growth outpaced revenue growth, and this showed up in the margin: 22.9% against 22.3% a year earlier. Operating profit reached INR 44.9 bn.
A 0.6 percentage point margin improvement on this revenue base is several billion rupees of additional operating profit. The report does not disclose the cause, but the fact itself matters: the company is not just growing, it is growing at a slightly better profitability.
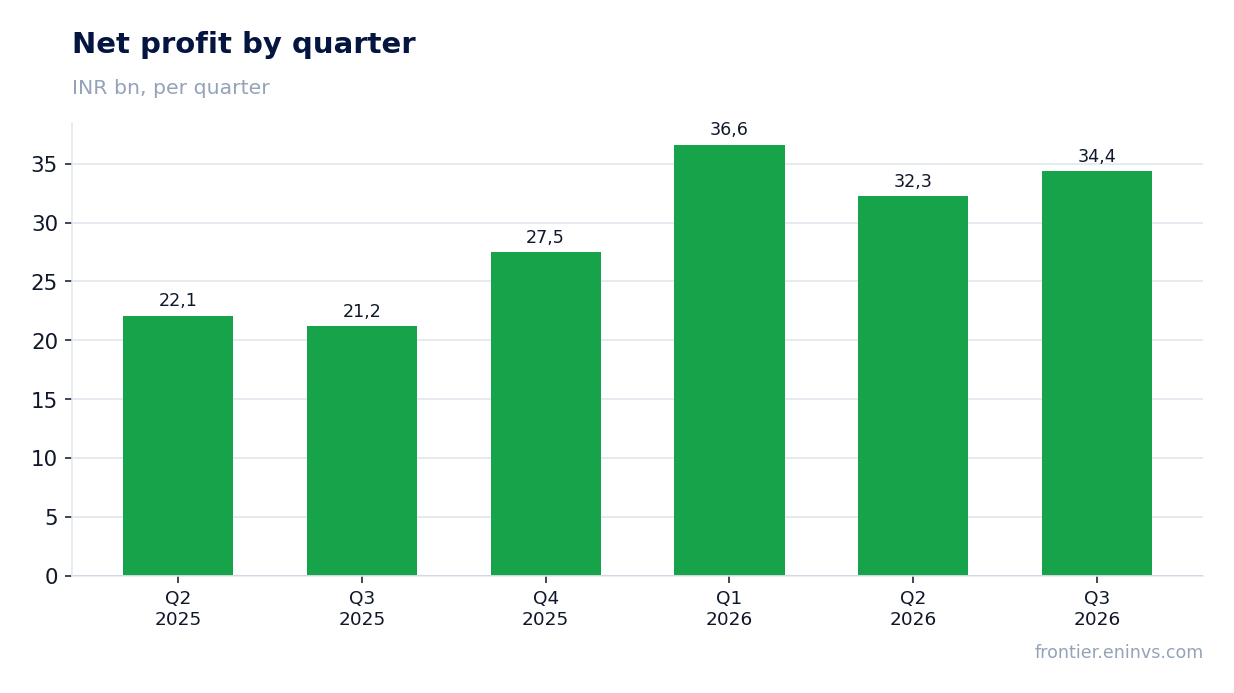
Net profit grew 61.9% and its margin to 14.3% from 13.9%
Net profit for the third quarter of 2026 was INR 34.4 bn, 61.9% more than a year earlier. The net margin rose to 14.3% from 13.9%. Profit grew faster than revenue, confirming better operating efficiency.
Over the trailing twelve months net profit was INR 130.7 bn. This base matters for the dividend burden and the multiples. The report does not flag any one-offs in profit, so the growth looks organic.
Net debt rose from INR 177.6 bn to INR 236.0 bn over the year
Net debt on 30 September 2026 was INR 236.0 bn. A year earlier, on 30 September 2025, it was INR 177.6 bn, so it rose by INR 58.4 bn over the year. Since the start of the year, from 31 March 2026, debt added INR 46.1 bn, from INR 189.9 bn.
Rising debt alongside strong profit means the company is funding working capital or investment with borrowed money. The report does not disclose the purpose. For a holder the fact itself matters: absolute leverage is rising, and it needs to be weighed against cash flow.
Leverage of 1.44x EBITDA LTM is a level, not a trend
The ratio of net debt to trailing-twelve-month EBITDA is 1.44x. That is a moderate level for a company with this profit and profitability. LTM EBITDA is INR 164.3 bn, and debt is covered by it in less than a year and a half.
The ratio cannot be compared with an earlier period: the facts contain no earlier value. So it is correct to speak only of the level. For risk assessment it matters that debt is serviced by profit, not just revenue.
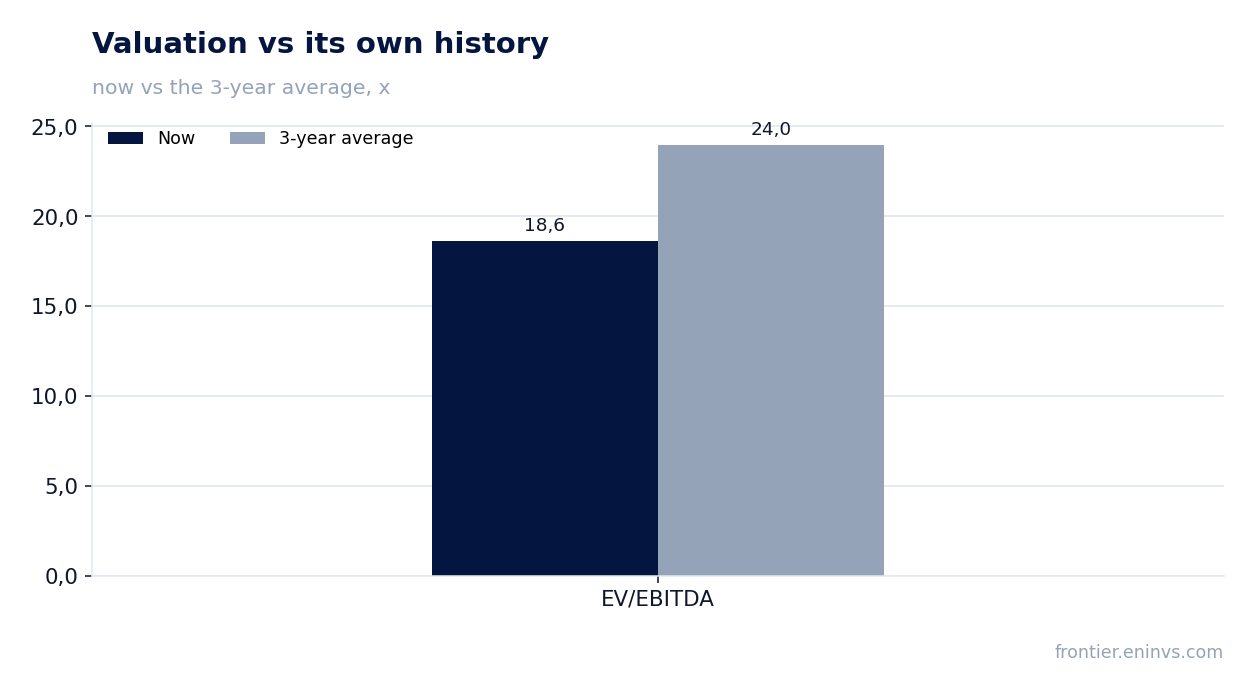
EV/EBITDA of 18.6 is 22% below its own three-year average of 24.0
The trailing-twelve-month EV/EBITDA multiple is 18.6x. The three-year average for the same multiple is 24.0x, so the stock trades 22% below its own history. P/E LTM is 22.0x. This suggests the market values the company more modestly than it did on average over three years.
On the portal's model, fair value implies +23% upside to the current price. This is our own estimate, not a consensus. It rests on EBITDA growth and a target multiple, so if growth decelerates the upside may shrink.
The 1.4% dividend yield is modest and the payout rests on profit
The trailing-twelve-month dividend yield is 1.4%. That is a low level, especially against the key rate. The payout rests on LTM net profit of INR 130.7 bn and a net margin of 14.3%.
Our estimate for the current year's dividend assumes the payout ratio and profit stay at the trailing-twelve-month level. If profit remains around INR 130.7 bn, the payout will be close to last year's. The risk to the dividend is rising debt: INR 236.0 bn may require part of free cash flow for servicing.
Valuation on the latest reported figures
| Metric | Value |
|---|---|
| Market cap | 2 871 bn INR |
| P/E (LTM) | 22.0 |
| EV/EBITDA (LTM) | 18.6 |
| P/B | 7.39 |
| Net debt / EBITDA (LTM) | 1.44 |
| ROE | 36.4% |
| Dividend yield (12m) | 1.4% |
| EV/EBITDA, 3-year average | 24.0 |
Bottom line
The strong side of the report is revenue growth of 57.4% and EBITDA growth of 61.2% with the margin improving to 22.9%. However, growth decelerated from 65.0% a quarter earlier, and net debt rose to INR 236.0 bn. The EV/EBITDA multiple of 18.6 is below its own three-year average of 24.0, making the stock cheaper than its history. On the portal's model the upside is +23%. The verdict is rather attractive, but decelerating growth and rising debt warrant monitoring.
Open the company's financial profile BAJAJAUTO →
See also: market overview · valuation map · stock screeners