Coforge: revenue up 54.8%, but net debt added INR 45.2bn in six months
Coforge reported third-quarter 2026 results: revenue reached INR 61,708m, up 54.8% year on year, EBITDA came in at INR 11,919m with a 19.3% margin versus 4.4% a year earlier, and net profit rose 56.5% to INR 5,881m. Growth is accelerating – second-quarter 2026 revenue growth of 54.8% versus 49.2% in the first quarter – but over the six months from 31 March to 30 September net debt moved from minus INR 6.9bn to INR 38.2bn, and that is the main question hanging over the report. At an EV/EBITDA of 22.0 against its own three-year average of 26.7 the share looks cheaper than its history, and on balance we rate it rather attractive.
Key takeaways
— Revenue grew 54.8% year on year, and growth accelerated versus the first quarter of 2026
— The EBITDA margin rose to 19.3% from 4.4% a year earlier, and that is the main source of profit growth
— Net profit rose 56.5% to INR 5,881m on a stable 9.5% net margin
— Net debt moved from minus INR 6.9bn to INR 38.2bn over six months, and that is the price of growth
— Leverage of 1.01x LTM EBITDA is moderate for a company growing this fast
— EV/EBITDA of 22.0 is 18% below its own three-year average of 26.7
— A 0.6% dividend yield is too small to influence the valuation
Attractiveness
Key figures, INR bn
| Metric | Q3 2025 | Q3 2026 | Change |
|---|---|---|---|
| Revenue | 39.9 | 61.7 | +54.8% |
| EBITDA | 1.73 | 11.9 | +587.4% |
| Operating profit | 5.61 | 9.85 | +75.7% |
| Net profit | 3.76 | 5.88 | +56.5% |
| EBITDA margin | 4.4% | 19.3% | +14.9 pp |
| Net margin | 9.4% | 9.5% | +0.1 pp |
Revenue grew 54.8% year on year, and growth accelerated versus the first quarter of 2026
In the third quarter of 2026 revenue reached INR 61,708m, up 54.8% year on year. This extends a strong run: second-quarter 2026 growth of 54.8% versus 49.2% in the first quarter means the acceleration seen at the start of the year is holding.
Quarterly revenue is rising sequentially: INR 44,504m in the first quarter, INR 55,277m in the second and INR 61,708m in the third. That profile shows the company gaining momentum within the year, not just lapping a weak base.
For a company growing faster than 50% year on year, the key question is what is driving it. The report gives no segment breakdown, so we note the acceleration itself and look to the next report to see whether the pace holds.
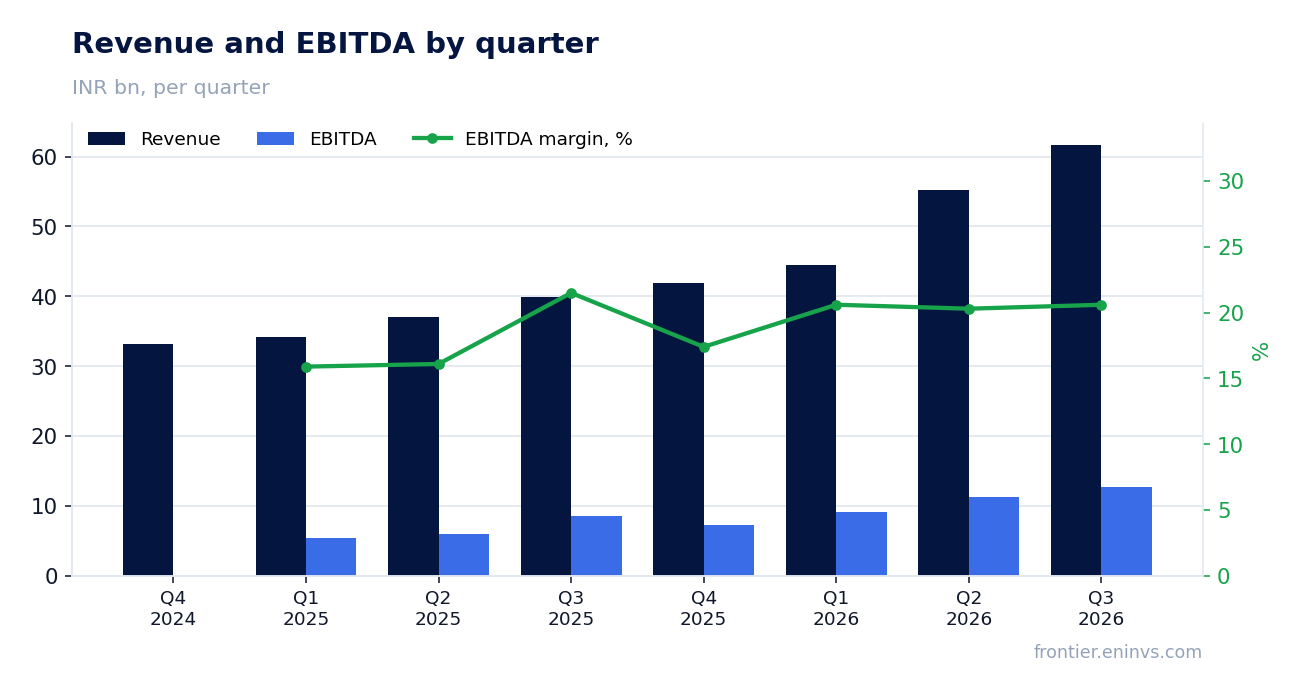
The EBITDA margin rose to 19.3% from 4.4% a year earlier, and that is the main source of profit growth
Third-quarter 2026 EBITDA reached INR 11,919m at a 19.3% margin versus 4.4% a year earlier. That jump in margin is what drove EBITDA up 587.4% year on year while revenue grew 54.8%.
Operating profit was INR 9,847m, so the gap between EBITDA and operating profit – about INR 2.1bn – is depreciation. That is modest relative to revenue and does not distort the margin picture.
The move from a 4.4% to a 19.3% margin is not cosmetic: it is a change in the level of profitability. If it holds, profit will keep growing faster than revenue, but the durability of the margin is the main thing to watch in the next report.
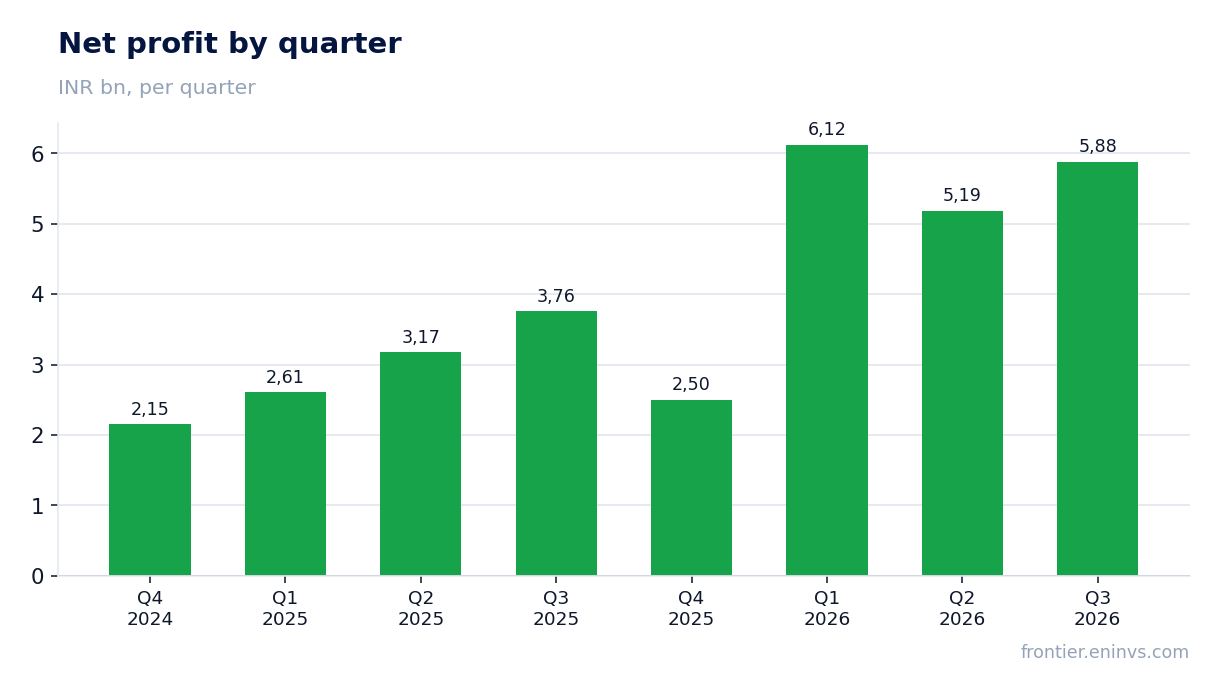
Net profit rose 56.5% to INR 5,881m on a stable 9.5% net margin
Third-quarter 2026 net profit reached INR 5,881m, up 56.5% year on year. The net margin was almost unchanged – 9.5% versus 9.4% – so profit grew with revenue rather than through one-off items.
Profit growth of 56.5% against revenue growth of 54.8% means operating leverage contributed modestly: volume drove most of the increase, not margin expansion. That is a healthy growth profile, even if it is less dramatic than the EBITDA jump.
Over the trailing twelve months net profit was INR 19,692m. That base matters for the P/E of 42.5 we discuss below.
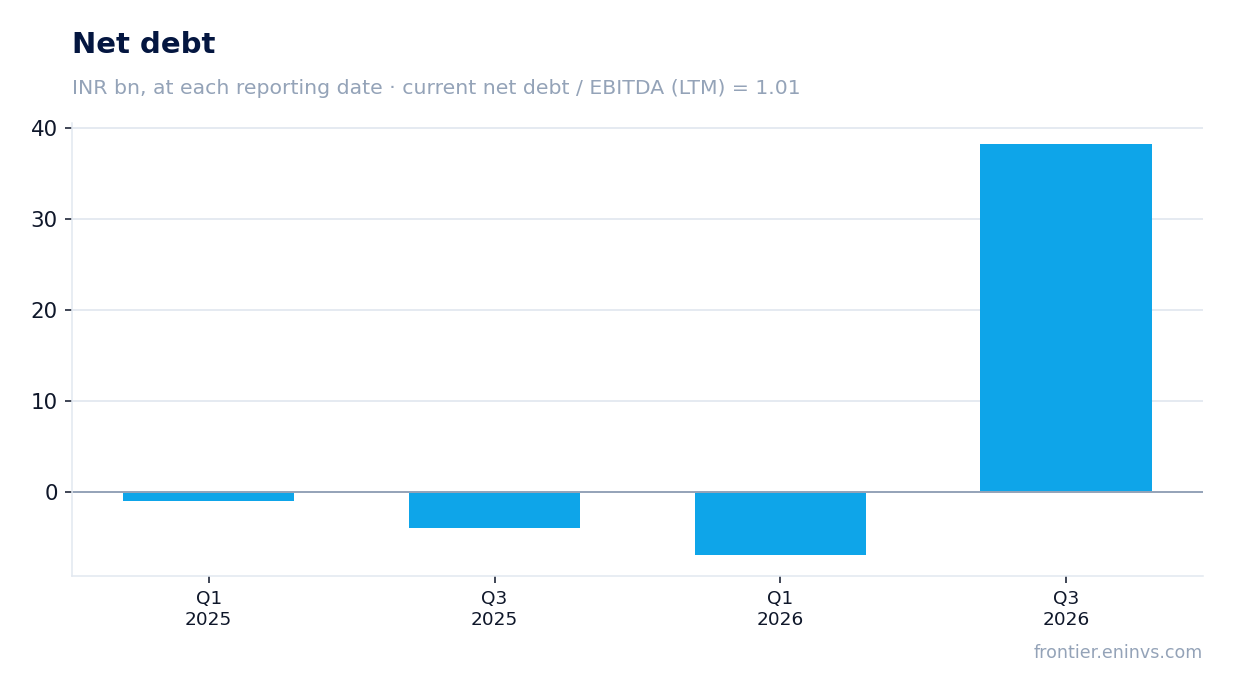
Net debt moved from minus INR 6.9bn to INR 38.2bn over six months, and that is the price of growth
At 30 September 2026 net debt stood at INR 38.2bn versus minus INR 6.9bn at 31 March 2026 – a change of INR 45.2bn over six months. A year earlier, at 30 September 2025, net debt was minus INR 3.9bn, so over twelve months it rose by INR 42.2bn.
The shift from a net cash position to debt is a consequence of growth: the company is financing expansion. Net debt to LTM EBITDA is 1.01x, a moderate level for a company growing revenue above 50%.
We do not have an earlier value for this ratio, so we do not claim leverage rose or fell – we state the current level only. The question is whether debt growth stops when the pace of expansion slows.
Leverage of 1.01x LTM EBITDA is moderate for a company growing this fast
Net debt to trailing-twelve-month EBITDA is 1.01x. With LTM EBITDA of INR 37,812m and net debt of INR 38.2bn, debt is roughly equal to annual EBITDA.
For a growing company that level is not a warning sign: it leaves room for further growth financing. But it does not allow debt to be ignored either: if growth slows, servicing becomes more visible.
Interest expense is not broken out in the report, so we cannot assess the cost of servicing the debt. That is a limitation of the analysis, not a reason to speculate.
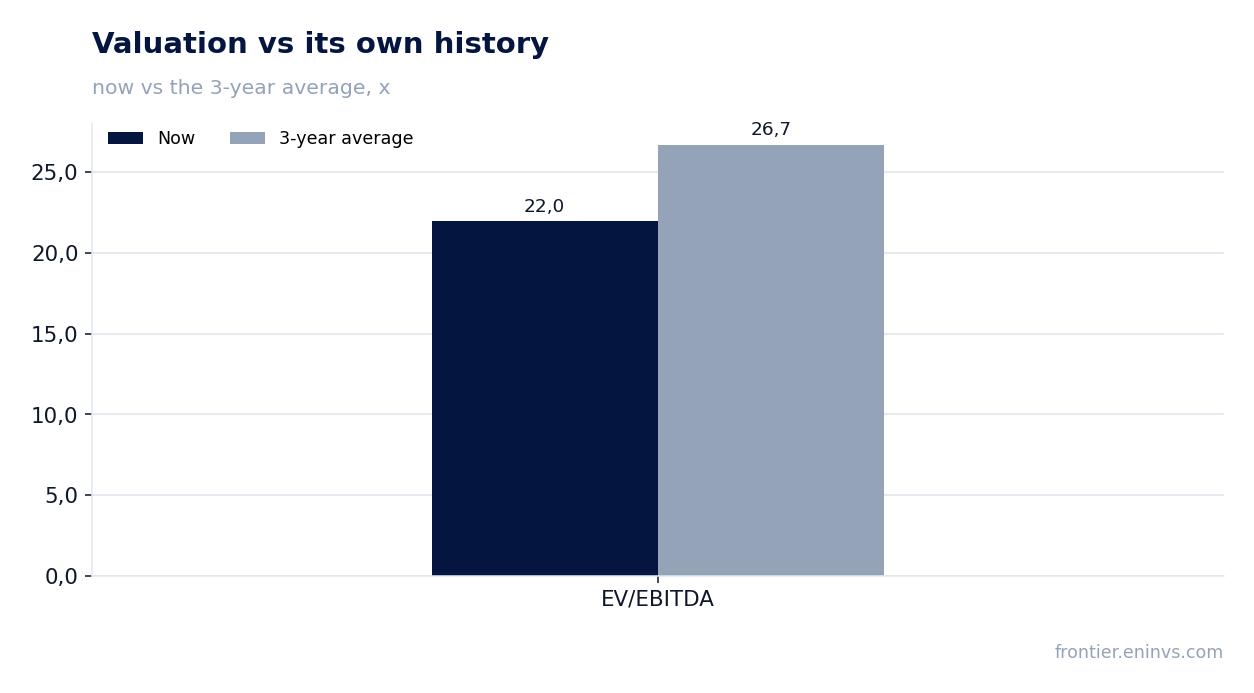
EV/EBITDA of 22.0 is 18% below its own three-year average of 26.7
The trailing-twelve-month EV/EBITDA is 22.0 against its own three-year average of 26.7, so the share trades 18% below its history. That is the only comparison we make: we do not compare with the sector or peers, as we have no such data.
The LTM P/E is 42.5 – a high level, but it reflects growth expectations rather than overvaluation against its own history. On EV/EBITDA the share is cheaper than usual, and that is the main argument for the current valuation.
On the portal's model the upside to fair value is +21%. That is our own estimate, not a market consensus and not a target price.
A 0.6% dividend yield is too small to influence the valuation
The trailing-twelve-month dividend yield is 0.6%. That is a low level that plays no role in the valuation: the return to the investor here should come from business growth, not from payouts.
At that yield the dividend does not even cover inflation, and we do not expect it to become an argument for the share in the coming quarters. The company is directing funds into growth, which makes sense given the current momentum.
If growth slows, the dividend policy question will become more relevant, but for now the payouts are too small to influence a holder's decision.
Valuation on the latest reported figures
| Metric | Value |
|---|---|
| Market cap | 838 bn INR |
| P/E (LTM) | 42.5 |
| EV/EBITDA (LTM) | 22.0 |
| P/B | 8.78 |
| Net debt / EBITDA (LTM) | 1.01 |
| ROE | 14.7% |
| Dividend yield (12m) | 0.6% |
| EV/EBITDA, 3-year average | 26.7 |
Bottom line
The strong points of the report were revenue growth of 54.8% with acceleration versus the first quarter and a recovery in the EBITDA margin to 19.3%. But the growth was paid for with debt: net debt moved from minus INR 6.9bn to INR 38.2bn over six months, and that is the main question for a holder. The EV/EBITDA of 22.0 is below its own three-year average of 26.7, making the share cheaper than its history. On balance we rate the share rather attractive, but margin durability and debt dynamics need confirmation in the next report.
Open the company's financial profile COFORGE →
See also: market overview · valuation map · stock screeners