Avenue Supermarts (DMart): revenue accelerated to +17.8%, but profit rose only 8.5% – margin and debt absorb the effect
On 25 January, Avenue Supermarts (DMart) reported results for the third quarter of 2026. Revenue reached 196,440.1 mn rupees (+17.8% YoY), EBITDA – 14,064.9 mn rupees (+69.0%), net profit – 7,435.7 mn rupees (+8.5%). Revenue growth accelerated versus the second quarter of 2026 (+17.8% vs +14.9%), and the EBITDA margin rose to 7.2% from 5.0% a year earlier, while the net margin declined to 3.8% from 4.1%. At the current price the share looks rather attractive: the EV/EBITDA multiple of 37.0 is below its own three-year average of 62.1, and the portal model implies +9% upside, but rising debt and weak profit conversion cap the assessment.
Key takeaways
— Revenue grew 17.8% YoY, and growth accelerated versus the second quarter of 2026 (+14.9%)
— EBITDA jumped 69.0% on a margin recovery to 7.2% from 5.0% a year earlier
— Net profit added only 8.5% because the net margin declined to 3.8% from 4.1%
— Net debt rose to 24,717.9 mn rupees on 30 September 2026 from 551.5 mn rupees a year earlier
— The net debt to EBITDA LTM ratio stands at 0.44 – a moderate level that still warrants monitoring
— EV/EBITDA LTM of 37.0 is 41% below its own three-year average of 62.1 – the share is cheaper than its history
— The portal model estimates +9% upside to fair value
Attractiveness
Key figures, INR bn
| Metric | Q3 2025 | Q3 2026 | Change |
|---|---|---|---|
| Revenue | 167 | 196 | +17.8% |
| EBITDA | 8.32 | 14.1 | +69.0% |
| Operating profit | 9.60 | 10.8 | +12.0% |
| Net profit | 6.85 | 7.44 | +8.5% |
| EBITDA margin | 5.0% | 7.2% | +2.2 pp |
| Net margin | 4.1% | 3.8% | -0.3 pp |
Revenue grew 17.8% YoY, and growth accelerated versus the second quarter of 2026 (+14.9%)
Revenue for the third quarter of 2026 reached 196,440.1 mn rupees, up 17.8% from a year earlier. This is an acceleration from the second quarter of 2026, when growth was 14.9%. The quarterly pattern shows the company gaining momentum after a relatively modest first quarter (+14.9%).
Revenue growth is supported by store network expansion and higher like-for-like sales, although the facts do not break down these drivers. The acceleration in the second quarter of 2026 versus the first set a positive impulse that the third quarter confirmed. For a retailer, such dynamics signal healthy demand and effective expansion.
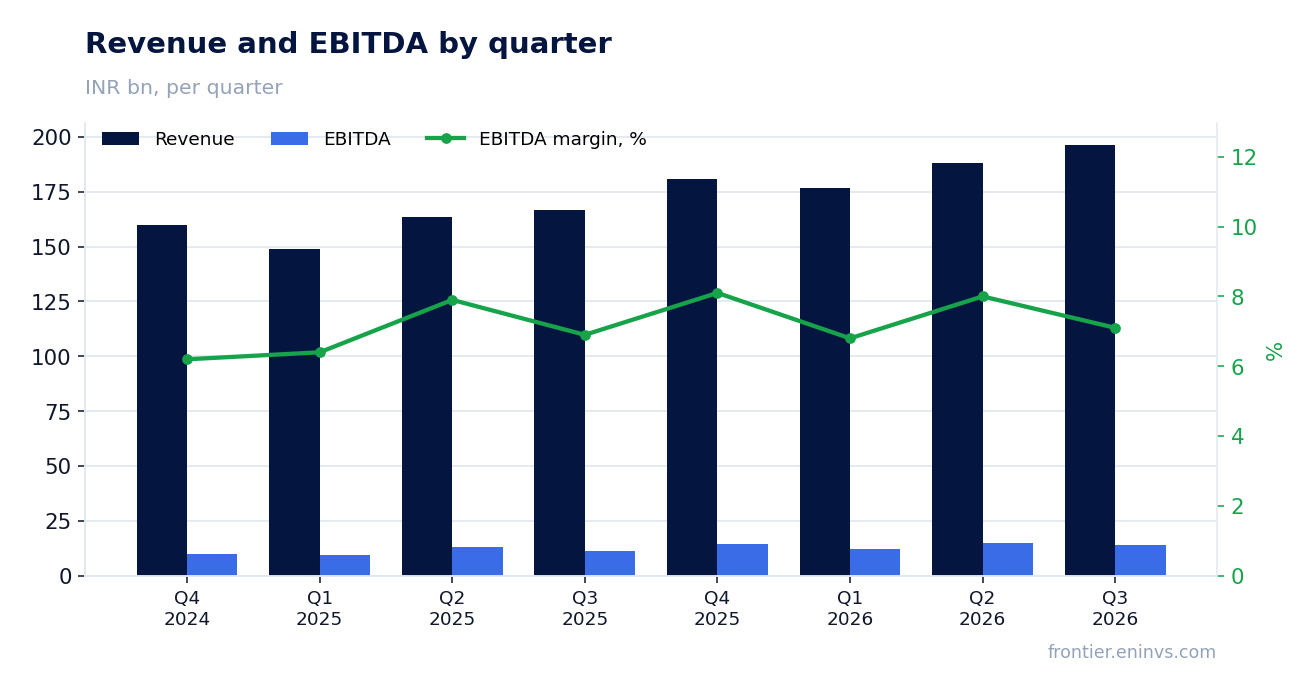
EBITDA jumped 69.0% on a margin recovery to 7.2% from 5.0% a year earlier
EBITDA for the third quarter of 2026 reached 14,064.9 mn rupees, up 69.0% from a year earlier. The jump is explained not only by revenue growth but also by an expansion in the EBITDA margin to 7.2% from 5.0% in the third quarter of 2025. The 2.2 percentage point margin improvement is the key driver of profitability.
The margin increase may stem from better procurement terms, lower promotional activity or operating efficiency, though the facts do not specify the cause. Importantly, operating profit also rose – to 10,752.1 mn rupees from 9,601.8 mn rupees a year earlier. This confirms the improvement is not an accounting effect.
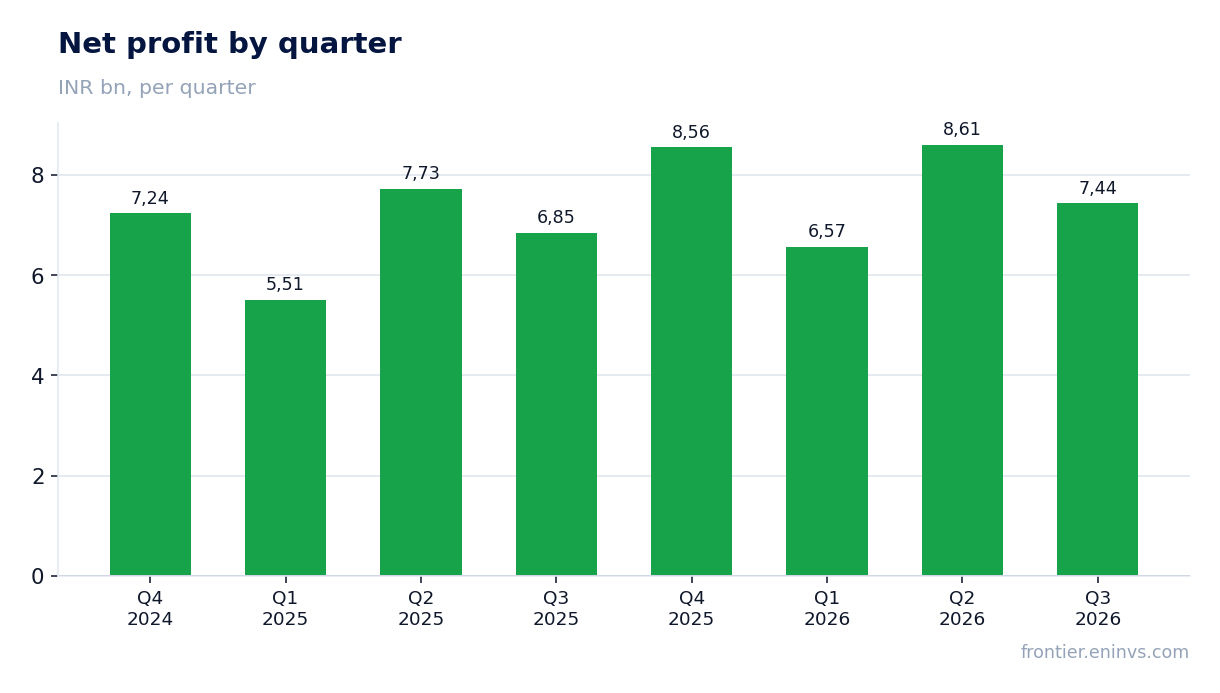
Net profit added only 8.5% because the net margin declined to 3.8% from 4.1%
Net profit for the third quarter of 2026 reached 7,435.7 mn rupees, up 8.5% YoY. This is significantly slower than EBITDA growth (+69.0%) and revenue growth (+17.8%). The reason is a decline in the net margin to 3.8% from 4.1% a year earlier. The gap between operating and net profit points to higher expenses below the operating line.
The pressure likely came from interest expenses and depreciation linked to rising debt and network expansion investment. Net debt on 30 September 2026 stood at 24,717.9 mn rupees versus 551.5 mn rupees a year earlier, increasing the interest burden. As a result, despite a strong operating performance, earnings per share grow more modestly.
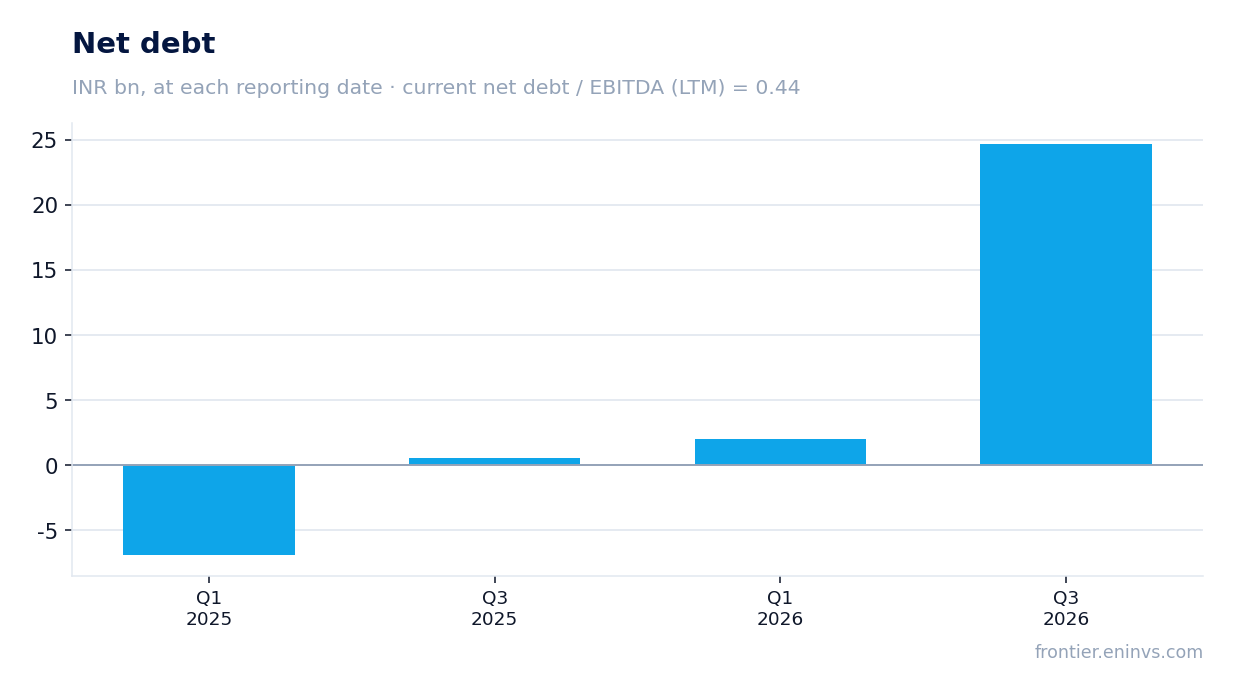
Net debt rose to 24,717.9 mn rupees on 30 September 2026 from 551.5 mn rupees a year earlier
Net debt on 30 September 2026 stood at 24,717.9 mn rupees, up from 551.5 mn rupees on 30 September 2025, an increase of 24,166.4 mn rupees over the year. Over the six months since 31 March 2026, debt rose from 1,996.9 mn rupees to 24,717.9 mn rupees. This growth reflects active financing of network expansion and possibly higher working capital.
The net debt to EBITDA LTM ratio stands at 0.44 – a moderate level for a retailer but one that warrants attention. Rising absolute debt with stable EBITDA could push the ratio higher in the future. Interest expenses linked to debt servicing are already pressuring net profit, as seen in the declining net margin.
The net debt to EBITDA LTM ratio stands at 0.44 – a moderate level that still warrants monitoring
The net debt to EBITDA LTM ratio on 30 September 2026 is 0.44. This means debt is covered by operating profit in less than six months. For a retailer, this level is considered comfortable, especially given stable EBITDA generation. However, it is important that the ratio is based on LTM EBITDA, which includes a strong third quarter.
The debt level itself is not critical, but its sharp rise over the year – from 551.5 mn rupees to 24,717.9 mn rupees – requires monitoring. If EBITDA continues to grow, the ratio may remain stable or even decline. Otherwise, the debt burden will become a constraint on profit and investment.
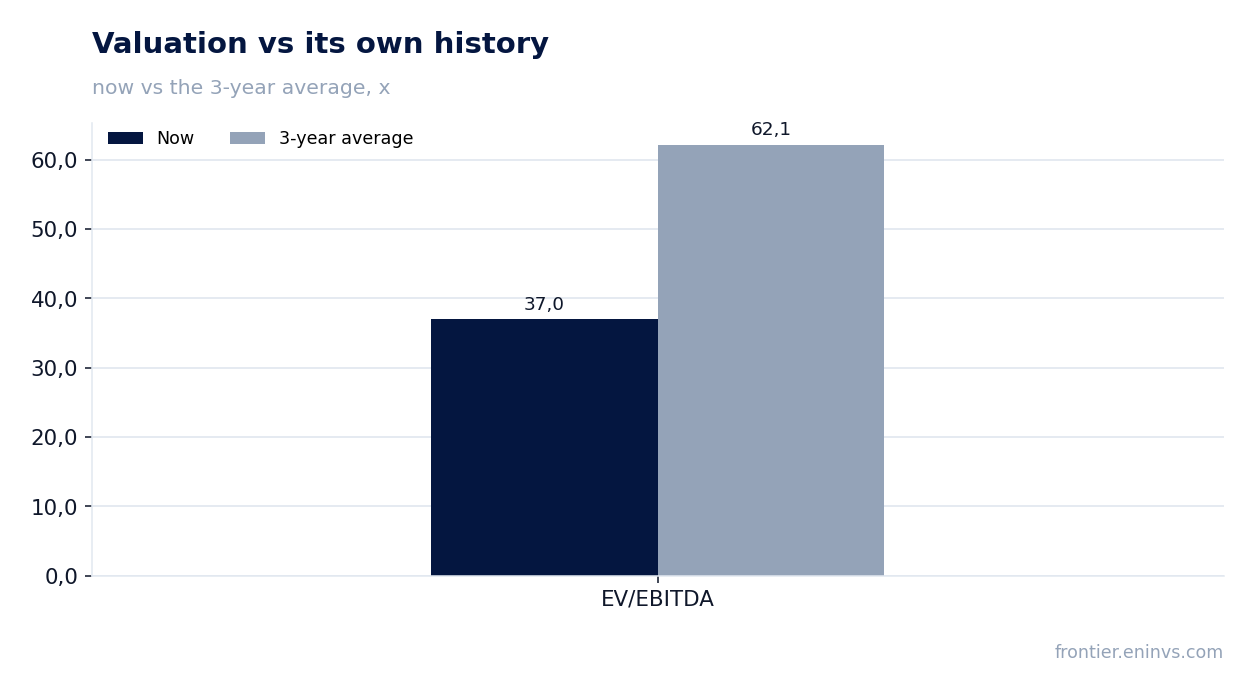
EV/EBITDA LTM of 37.0 is 41% below its own three-year average of 62.1 – the share is cheaper than its history
The EV/EBITDA LTM multiple currently stands at 37.0, which is 41% below its own three-year average of 62.1. This means the share trades cheaper than its average over the past three years. The lower multiple may reflect either a price correction or EBITDA growth outpacing market capitalisation growth.
For an investor, this signals potential undervaluation relative to history. However, it is worth considering that the market may be pricing in risks related to rising debt and slower net profit growth. The P/E LTM is 66.1, which also requires comparison with historical levels, but the facts do not provide a three-year average for P/E.
The portal model estimates +9% upside to fair value
According to the portal model, which compares EBITDA growth with a target multiple and market capitalisation, the upside to fair value is estimated at +9%. This is the portal's own estimate, not a market consensus or a target price. The model incorporates current fundamentals and assumes moderate growth.
The 9% upside cannot be called significant, but it is positive. It aligns with the conclusion that the share trades below its historical valuation on EV/EBITDA. However, the model does not account for potential risks related to debt and interest expenses, which could limit profit growth.
Valuation on the latest reported figures
| Metric | Value |
|---|---|
| Market cap | 2 060 bn INR |
| P/E (LTM) | 66.1 |
| EV/EBITDA (LTM) | 37.0 |
| P/B | 8.42 |
| Net debt / EBITDA (LTM) | 0.44 |
| ROE | 11.8% |
| EV/EBITDA, 3-year average | 62.1 |
Bottom line
The strong side of the report is revenue acceleration to +17.8% and EBITDA margin recovery to 7.2%, which drove EBITDA growth of 69.0%. However, net profit rose only 8.5% due to a lower net margin and higher interest expenses linked to rising debt. The debt burden remains moderate (0.44 to EBITDA), but its rapid growth requires attention. The share's valuation below its own history (EV/EBITDA 37.0 vs average 62.1) and the portal model's +9% upside make it rather attractive, but not without risks.
Open the company's financial profile DMART →
See also: market overview · valuation map · stock screeners