HCL Technologies: revenue accelerates for a third straight quarter, but the margin holds rather than expands
HCL Technologies' results for the third quarter of 2026 showed revenue of INR 356.2 bn, EBITDA of INR 76.7 bn and net profit of INR 51.3 bn. Year-on-year revenue growth accelerated from 12.3% in the prior quarter to 13.9%, and the company remains in a net cash position of INR 90.9 bn. With an EV/EBITDA of 13.8, in line with its own three-year average, and a dividend yield of 4.2%, the share looks rather attractive than neutral – but only if the revenue acceleration holds.
Key takeaways
— Revenue grew 13.9% year on year – an acceleration from 12.3% a quarter earlier
— EBITDA margin at 21.5% and net margin at 14.4% – profitability holds but does not expand
— Net cash position of INR 90.9 bn rose by INR 10.4 bn over six months
— EV/EBITDA of 13.8 sits exactly at its own three-year average of 13.6
— Dividend yield of 4.2% against a P/E of 23.2 and ROE of 27.1%
— On the portal's model, upside to fair value is +7%
Attractiveness
Key figures, INR bn
| Metric | — | Q3 2026 | Change |
|---|---|---|---|
| Revenue | — | 356 | — |
| EBITDA | — | 76.7 | — |
| Operating profit | — | 66.6 | — |
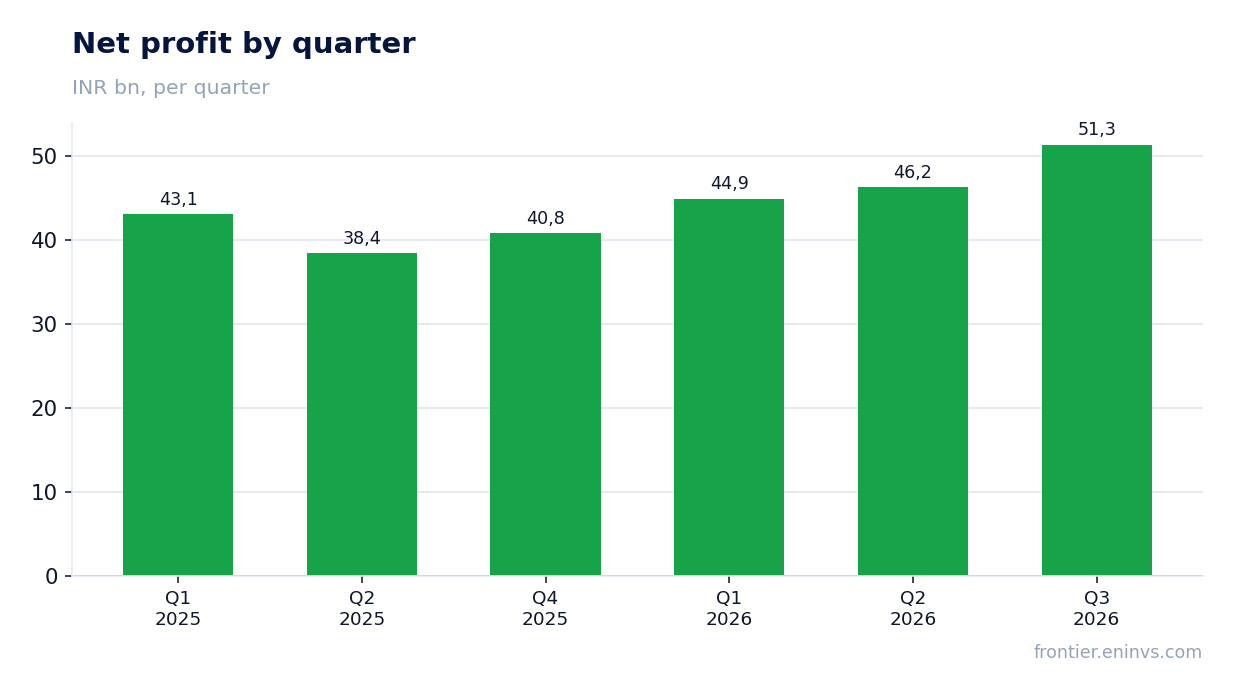
| Net profit | — | 51.3 | — |
| EBITDA margin | — | 21.5% | — |
| Net margin | — | 14.4% | — |
Revenue grew 13.9% year on year – an acceleration from 12.3% a quarter earlier
Revenue for the third quarter of 2026 came in at INR 356.2 bn. That is 13.9% more than a year earlier and faster than the 12.3% growth recorded in the prior quarter. The acceleration is confirmed by the sequential trend: quarterly revenue rose from INR 339.8 bn in the first quarter to INR 345.8 bn in the second and INR 356.2 bn in the third.
Growth has now accelerated for a second consecutive quarter when measured against the 12.3% figure. For a company of this scale, that means demand for its services is not merely stable but expanding. Without segment data, however, it is impossible to say which part of the business delivered the increase – the facts contain no such breakdown.
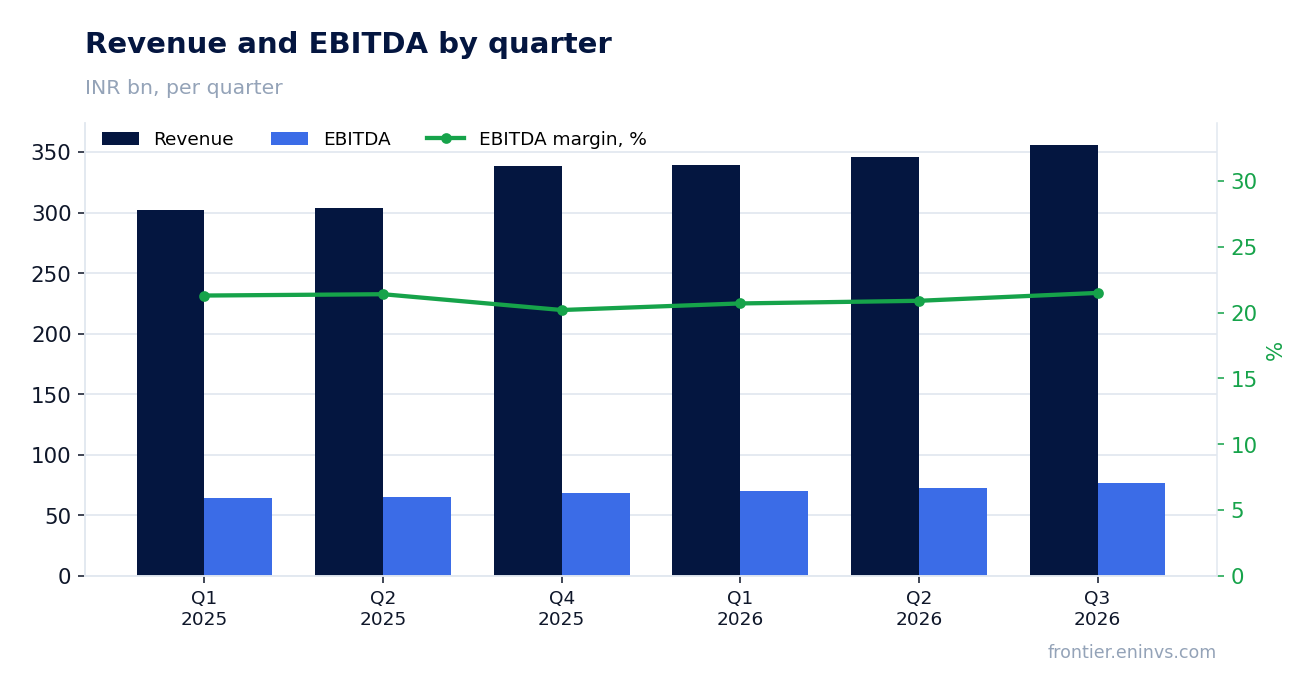
EBITDA margin at 21.5% and net margin at 14.4% – profitability holds but does not expand
EBITDA for the third quarter was INR 76.7 bn, giving a margin of 21.5%. Operating profit reached INR 66.6 bn and net profit INR 51.3 bn, a net margin of 14.4%. This is a stable level, not growth: the margin holds within a narrow band rather than expanding.
With revenue of INR 356.2 bn and EBITDA of INR 76.7 bn, the gap between operating and net profit is small at INR 15.3 bn. That means interest costs and taxes do not consume a significant share of the operating result. A company with a net cash position pays little interest, and that supports the net margin.
Net cash position of INR 90.9 bn rose by INR 10.4 bn over six months
Net debt as of 30 September 2026 stood at minus INR 90.9 bn, meaning the company holds a net cash position. At 31 March 2026 the figure was minus INR 80.5 bn, so over six months the cash cushion grew by INR 10.4 bn. The ratio of net debt to trailing twelve-month EBITDA is minus 0.33, confirming the absence of debt burden.
Operating cash flow was INR 39.9 bn in the first quarter of 2026 and INR 27.4 bn in the second. With capital expenditure of INR 3.0 bn and INR 3.4 bn respectively, the company generates free cash flow sufficient to keep building its cash position. The facts contain no third-quarter cash flow or capex data, so the quarterly picture cannot be completed.
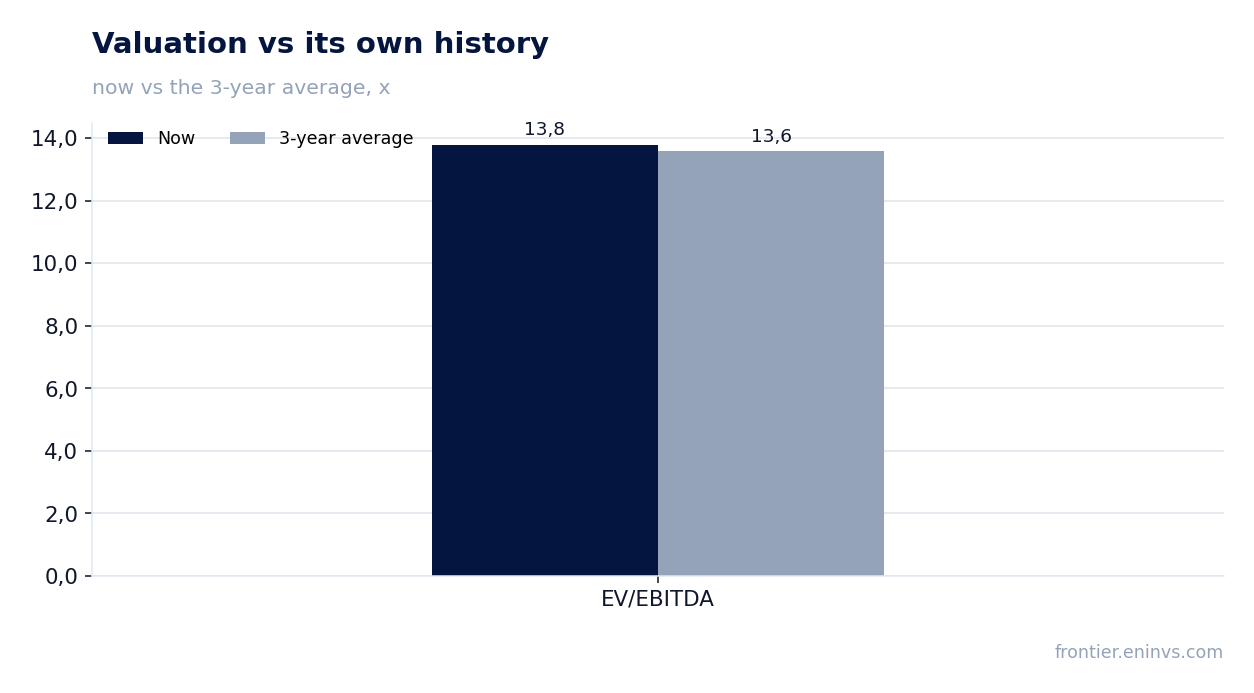
EV/EBITDA of 13.8 sits exactly at its own three-year average of 13.6
The trailing twelve-month EV/EBITDA multiple is 13.8. That is 2% above its own three-year average of 13.6, meaning the share is valued exactly as it has been on average over three years. There is neither a discount nor a premium to its own history.
The trailing twelve-month P/E is 23.2 against an ROE of 27.1%. The price-to-earnings ratio looks high, but the return on equity justifies it: the company earns on shareholder capital more than it costs on this multiple. On the portal's model, fair value implies upside of +7%, which is modest but positive.
Dividend yield of 4.2% against a P/E of 23.2 and ROE of 27.1%
The trailing twelve-month dividend yield is 4.2%. With trailing twelve-month net profit of INR 166.4 bn and a market capitalisation of INR 3,859.4 bn, the company returns a notable share of profit to shareholders. The exact dividend for 2026 is not disclosed in the facts, so our estimate of the future payout rests on the current yield and profit.
A yield of 4.2% competes with deposit rates, but with an ROE of 27.1% the company can both pay dividends and reinvest in growth. The risk to the dividend is a slowdown in revenue or a fall in margin that would cut profit. If profit stays at the trailing twelve-month level, the 4.2% payout looks sustainable.
On the portal's model, upside to fair value is +7%
Our valuation model, based on EBITDA growth and a target multiple, gives upside to fair value of +7%. That is a moderate but positive signal: the share is valued close to fair, without a large cushion but also without overheating.
The model is sensitive to the sustainability of EBITDA growth. If revenue continues to accelerate and the margin holds at 21.5%, fair value will rise. If growth slows to 12.3% or below, the upside will shrink. For now, the third-quarter data support the first scenario.
Valuation on the latest reported figures
| Metric | Value |
|---|---|
| Market cap | 3 859 bn INR |
| P/E (LTM) | 23.2 |
| EV/EBITDA (LTM) | 13.8 |
| P/B | 5.13 |
| Net debt / EBITDA (LTM) | -0.33 |
| ROE | 27.1% |
| Dividend yield (12m) | 4.2% |
| EV/EBITDA, 3-year average | 13.6 |
Bottom line
The strong side of the report is revenue acceleration to 13.9% and a net cash position of INR 90.9 bn. The weak side is that the margin holds at 21.5% but does not grow, and the 13.8 multiple sits exactly at its own history. A dividend yield of 4.2% and +7% upside on the portal's model provide moderate support. The verdict is rather attractive, but without a large cushion: a higher rating would require either further margin expansion or revenue growth above 13.9%.
Open the company's financial profile HCLTECH →
See also: market overview · valuation map · stock screeners