JSW Steel: profit tripled, but the entire gain rests on last year's low base
JSW Steel reported third-quarter 2026 results. Revenue reached INR 536.97 bn (+18.9% YoY), EBITDA – INR 108.53 bn at a 20.2% margin versus 4.4% a year earlier, and net profit – INR 52.79 bn (+225.3%). At an EV/EBITDA of 9.8 against its own three-year average of 12.6 the share looks cheaper than its history, and the verdict is 'rather attractive', but the main risk is that the comparison is against a disastrous quarter a year ago.
Key takeaways
— Revenue grew 18.9% YoY, an acceleration from 9.9% a quarter earlier
— The 20.2% EBITDA margin versus 4.4% a year ago is a recovery from a disastrous base, not a new level
— Net profit of INR 52.79 bn tripled, but the prior quarter contained INR 163.7 bn of a one-off nature
— Debt rose to INR 801.3 bn, and net debt/EBITDA LTM stands at 2.05 – a moderate burden
— EV/EBITDA of 9.8 is 22% below its own three-year average of 12.6 – the share is cheaper than its history
— A dividend yield of 0.57% is too small to be an argument for the share
Attractiveness
Key figures, INR bn
| Metric | Q3 2025 | Q3 2026 | Change |
|---|---|---|---|
| Revenue | 452 | 537 | +18.9% |
| EBITDA | 19.8 | 109 | +448.4% |
| Operating profit | 45.6 | 79.2 | +73.6% |
| Net profit | 16.2 | 52.8 | +225.3% |
| EBITDA margin | 4.4% | 20.2% | +15.8 pp |
| Net margin | 3.6% | 9.8% | +6.2 pp |
Revenue grew 18.9% YoY, an acceleration from 9.9% a quarter earlier
In the third quarter of 2026 JSW Steel's revenue reached INR 536.97 bn, up 18.9% year on year. A quarter earlier growth was 9.9%, so the pace accelerated. This is the highest quarterly figure in the available history: the previous peak was INR 497.98 bn in the first quarter of 2026.
The acceleration rests on a low base: in the third quarter of 2025 revenue was INR 451.52 bn, growing only 9.3% YoY at the time. The comparison with a weak quarter flatters the current pace, and the durability of growth will only be visible against a more normal base.
The next quarter matters for the trend: if revenue holds above INR 500 bn with the margin intact, that would confirm the growth was not a one-off rebound.
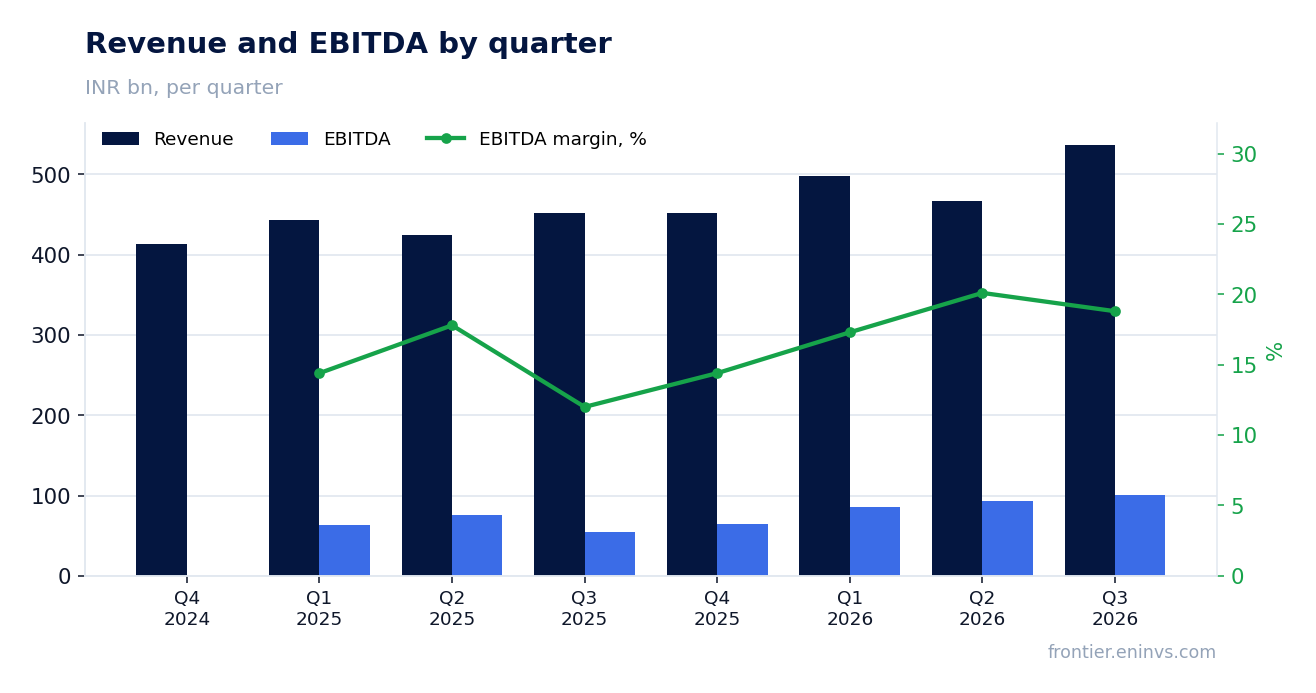
The 20.2% EBITDA margin versus 4.4% a year ago is a recovery from a disastrous base, not a new level
EBITDA in the third quarter of 2026 was INR 108.53 bn, with a margin of 20.2%. A year earlier the margin was only 4.4%, so the 448.4% EBITDA growth mainly reflects a low base rather than a jump in operating efficiency.
Operating profit was INR 79.2 bn, and the gap between EBITDA and operating profit – about INR 29.3 bn – is depreciation. That is a stable item that does not change the margin picture but shows that a smaller part of the operating result reaches net profit.
Whether the margin holds at 20% is the key question. If it stays there next quarter, current profit will prove not to be one-off; if it returns to last year's levels, the entire profit gain will turn out to be a base effect.
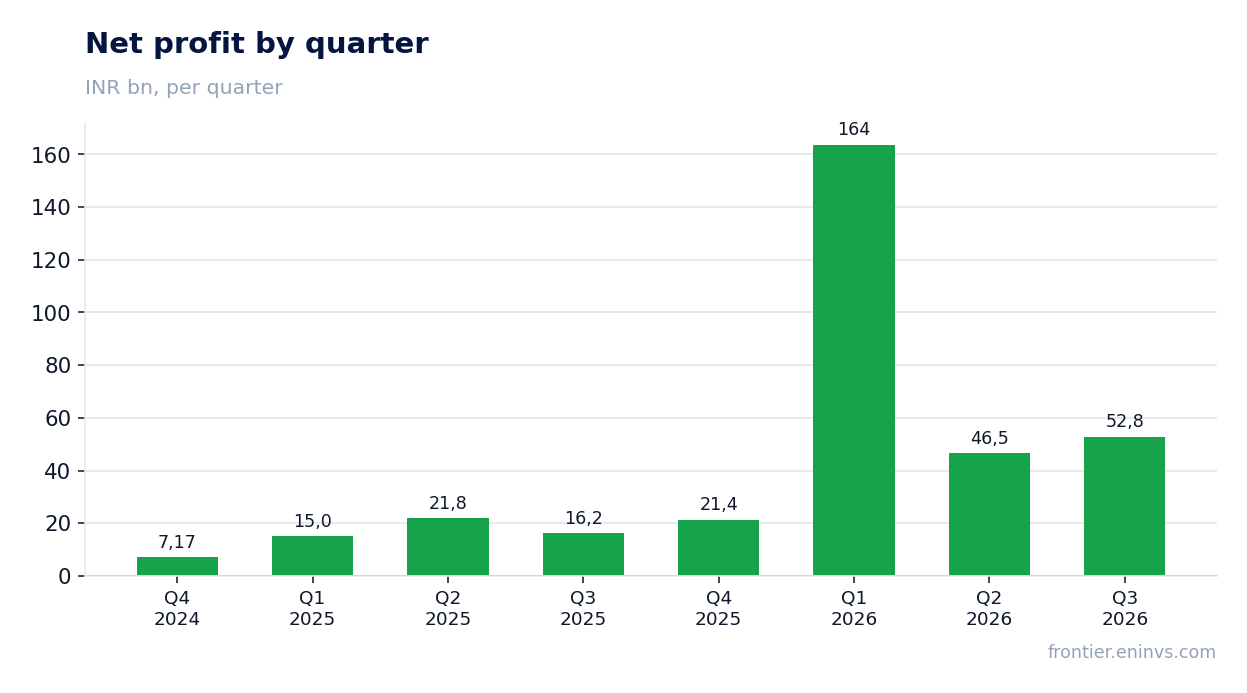
Net profit of INR 52.79 bn tripled, but the prior quarter contained INR 163.7 bn of a one-off nature
Net profit in the third quarter of 2026 was INR 52.79 bn versus INR 16.23 bn a year earlier, up 225.3%. The net margin rose to 9.8% from 3.6%. Profit grew faster than revenue because the margin recovered from an extremely low level.
The first quarter of 2026 shows how dependent profit is on one-offs: net profit was then INR 163.7 bn on revenue of INR 497.98 bn, a margin of about 33%. That level is incompatible with operating activity and points to a one-off gain within profit.
The current INR 52.79 bn is a return to normal profitability, not a record. To judge sustainability, profit in the next two quarters matters: if it stays in the INR 45–55 bn range, the annual result will be predictable.
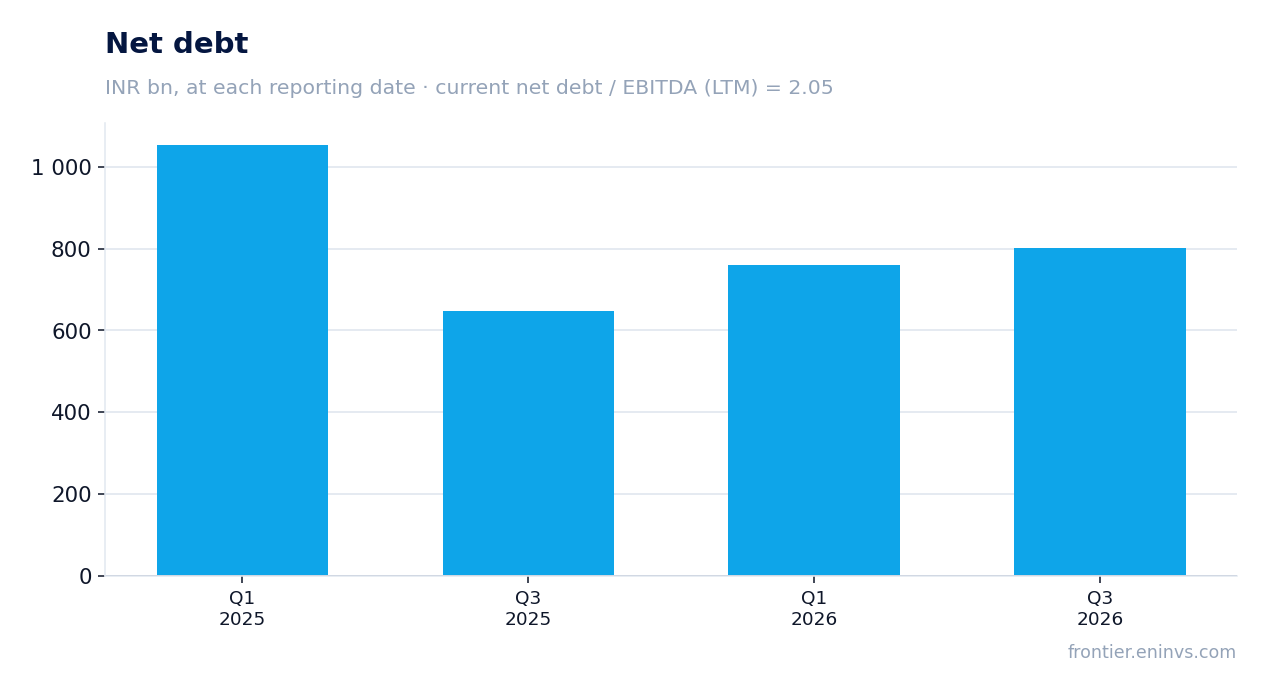
Debt rose to INR 801.3 bn, and net debt/EBITDA LTM stands at 2.05 – a moderate burden
Net debt at 30 September 2026 was INR 801.3 bn. Since 31 March 2026 it rose from INR 760.6 bn, an increase of INR 40.7 bn, and over 12 months – from INR 647.8 bn at 30 September 2025, an increase of INR 153.5 bn.
The ratio of net debt to trailing-twelve-month EBITDA is 2.05. That is a moderate level for a steel company: debt is covered by operating profit in roughly two years. Rising absolute debt at such profit does not create acute pressure on the finances.
Interest expense is not disclosed in the facts, so it is impossible to assess how much profit goes to servicing debt. But with LTM EBITDA of INR 390.23 bn, even a noticeable rate should not consume a significant part of the operating result.
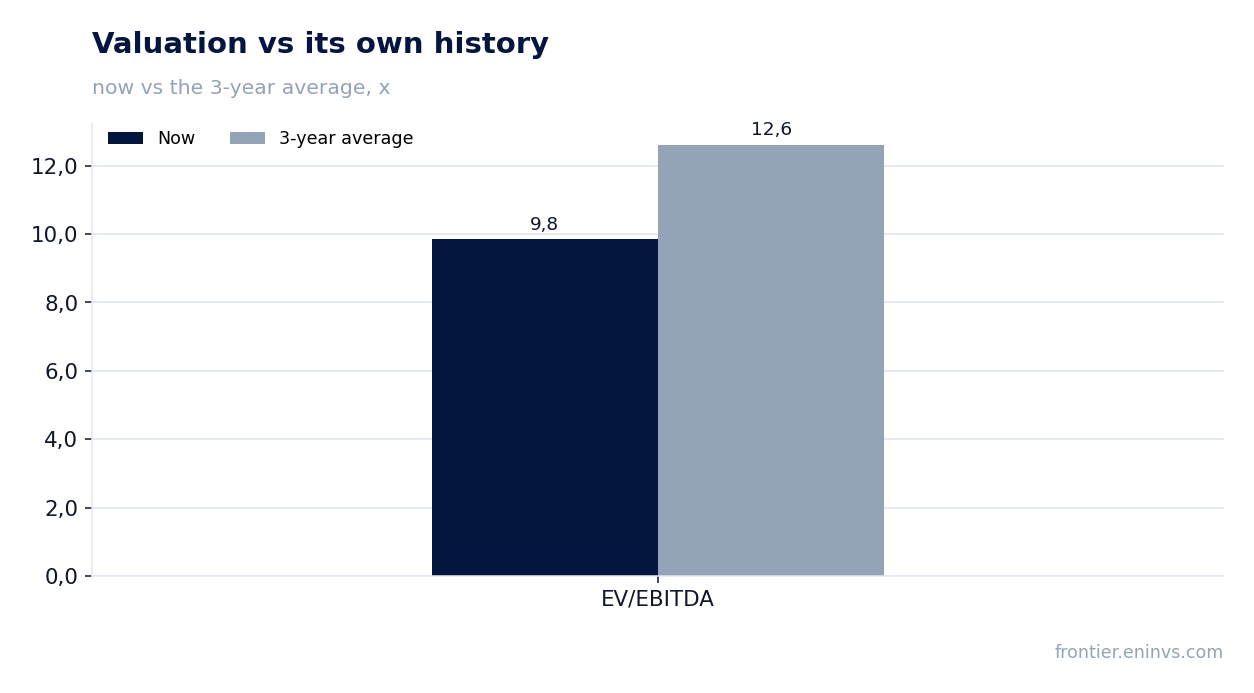
EV/EBITDA of 9.8 is 22% below its own three-year average of 12.6 – the share is cheaper than its history
The trailing-twelve-month EV/EBITDA multiple is 9.8, while its own three-year average is 12.6. The share trades 22% below its history on this measure, meaning the market values current profit more cheaply than usual.
P/E LTM is 10.8, and return on equity is 19.3%. The combination of a modest P/E with double-digit ROE suggests the market is not pricing in the sustainability of current profit: it remembers that a year ago the margin was 4.4%.
A re-rating needs a signal that the 20% margin is a new level rather than a rebound. If the next quarter shows profit above INR 50 bn with the margin intact, the discount to its own history could narrow.
A dividend yield of 0.57% is too small to be an argument for the share
The trailing-twelve-month dividend yield is 0.57%. With a market capitalisation of INR 3,081.27 bn, that is about INR 17.5 bn of payouts, negligible against LTM net profit of INR 284.39 bn. The company directs a small share of profit to dividends.
A 0.57% yield underperforms even the risk-free rate, so the dividend cannot be a reason to buy. The investor's main return here depends on profit growth and multiple re-rating, not on payouts.
A fall in profit or a rise in capital spending could reduce payouts: with debt of INR 801.3 bn the company may prefer to direct free cash to debt reduction. But at the current low payout share, the dividend is unlikely to shrink noticeably.
Valuation on the latest reported figures
| Metric | Value |
|---|---|
| Market cap | 3 081 bn INR |
| P/E (LTM) | 10.8 |
| EV/EBITDA (LTM) | 9.8 |
| P/B | 3.08 |
| Net debt / EBITDA (LTM) | 2.05 |
| ROE | 19.3% |
| Dividend yield (12m) | 0.6% |
| EV/EBITDA, 3-year average | 12.6 |
Bottom line
What was strong in the report was the recovery of revenue to INR 536.97 bn and the margin to 20.2% – the company returned to normal profitability after a disastrous quarter. What was weak is that the entire profit gain rests on a low base, and the prior quarter contained INR 163.7 bn of a one-off nature. Debt of INR 801.3 bn at 2.05 times EBITDA remains moderate but is rising. The key question for a holder is whether the 20% margin holds next quarter; at an EV/EBITDA of 9.8 against its own average of 12.6 the share looks rather attractive, but only if profit does not roll back.
Open the company's financial profile JSWSTEEL →
See also: market overview · valuation map · stock screeners