Persistent Systems: revenue accelerated to 30.3% but profit fell by a quarter as margin buckled under growth
In its Q3 2026 report, Persistent Systems posted revenue of INR 46,639.04 mn, up 30.3% year on year, with growth accelerating from 29.1% in the prior quarter. However, EBITDA fell 2.8% to INR 6,579.26 mn and net profit dropped 25.4% to INR 3,515.14 mn: the EBITDA margin compressed from 18.9% to 14.1% and the net margin from 13.2% to 7.5%. At an EV/EBITDA of 31.4 versus its own three-year average of 38.2 the stock is cheaper than its history, but the profit decline and the portal model's -4% upside leave the share unattractive on balance – a neutral verdict.
Key takeaways
— Revenue grew 30.3% year on year, accelerating from 29.1% in the prior quarter
— EBITDA fell 2.8% and its margin compressed from 18.9% to 14.1% as costs outpace revenue
— Net profit dropped 25.4% to INR 3,515.14 mn, with the net margin falling from 13.2% to 7.5%
— Over the trailing twelve months net profit was INR 18,032.7 mn on revenue of INR 168,000.0 mn
— EV/EBITDA of 31.4 is 18% below its own three-year average of 38.2 – the stock is cheaper than its history
— The portal model puts the share's upside to fair value at -4%
— Trailing twelve-month dividend yield is 0.70% – a modest payout relative to profit
Attractiveness
Key figures, INR bn
| Metric | Q3 2025 | Q3 2026 | Change |
|---|---|---|---|
| Revenue | 35.8 | 46.6 | +30.3% |
| EBITDA | 6.77 | 6.58 | -2.8% |
| Operating profit | 5.83 | 4.67 | -19.9% |
| Net profit | 4.71 | 3.52 | -25.4% |
| Operating cash flow | 5.39 | — | — |
| Capex | 0.61 | — | — |
| EBITDA margin | 18.9% | 14.1% | -4.8 pp |
| Net margin | 13.2% | 7.5% | -5.7 pp |
Revenue grew 30.3% year on year, accelerating from 29.1% in the prior quarter
In Q3 2026, Persistent Systems' revenue reached INR 46,639.04 mn, up 30.3% from the same quarter a year earlier. This is an acceleration from 29.1% growth in the prior quarter: the company has been gaining momentum for two consecutive quarters.
Revenue growth has been accelerating throughout the year: 29.1% in Q1 2026 and 30.3% in Q2 2026. For a company whose trailing twelve-month revenue reached INR 168,000.0 mn, such a pace means demand for its services remains strong.
However, the revenue acceleration is not accompanied by profit growth: both EBITDA and net profit declined in the reported quarter. This indicates that costs are rising faster than income, and revenue growth is not yet converting into profit.
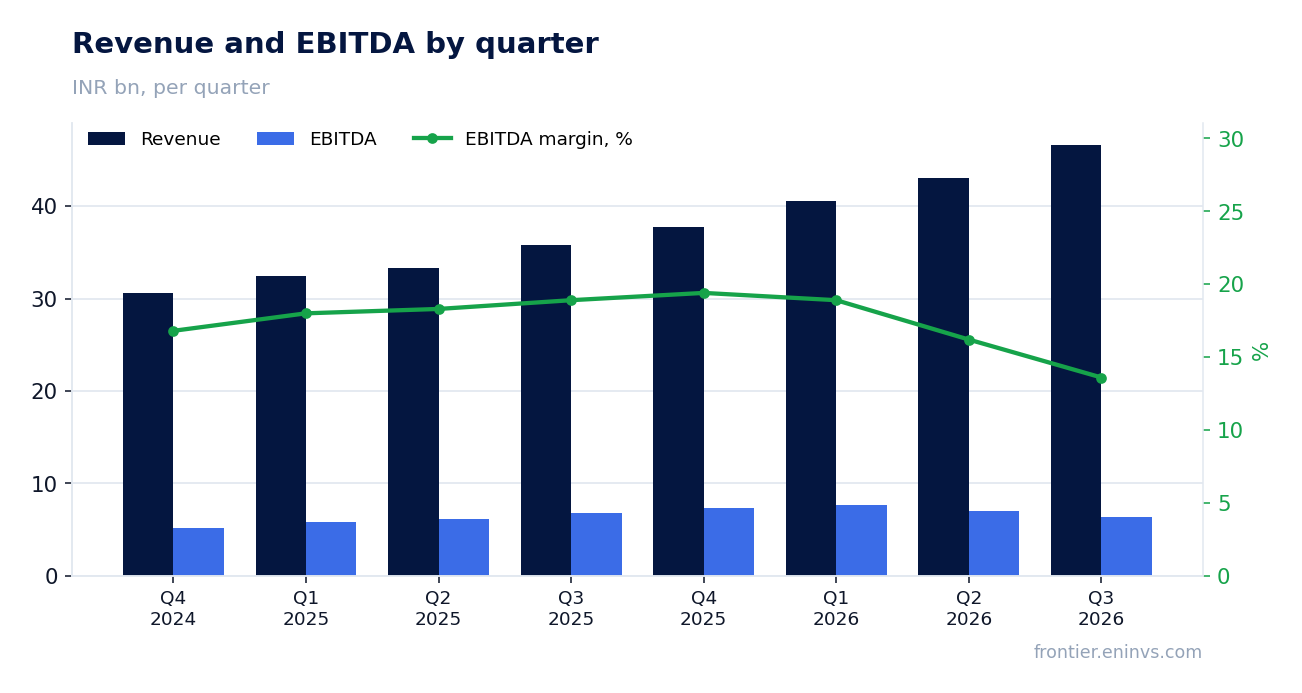
EBITDA fell 2.8% and its margin compressed from 18.9% to 14.1% as costs outpace revenue
EBITDA in Q3 2026 was INR 6,579.26 mn, down 2.8% from a year earlier. With revenue growing 30.3%, this means operating expenses increased significantly faster than income.
The EBITDA margin compressed from 18.9% to 14.1%. A decline of 4.8 percentage points is substantial for a company whose revenue is growing at a double-digit pace. Operating profit also fell, to INR 4,668.08 mn from INR 5,827.04 mn a year earlier.
The margin compression may be linked to a change in revenue mix or rising personnel and contractor costs, but the provided data do not disclose the causes. For investors, the key point is that revenue growth is not translating into EBITDA growth – this is the central risk in the current report.
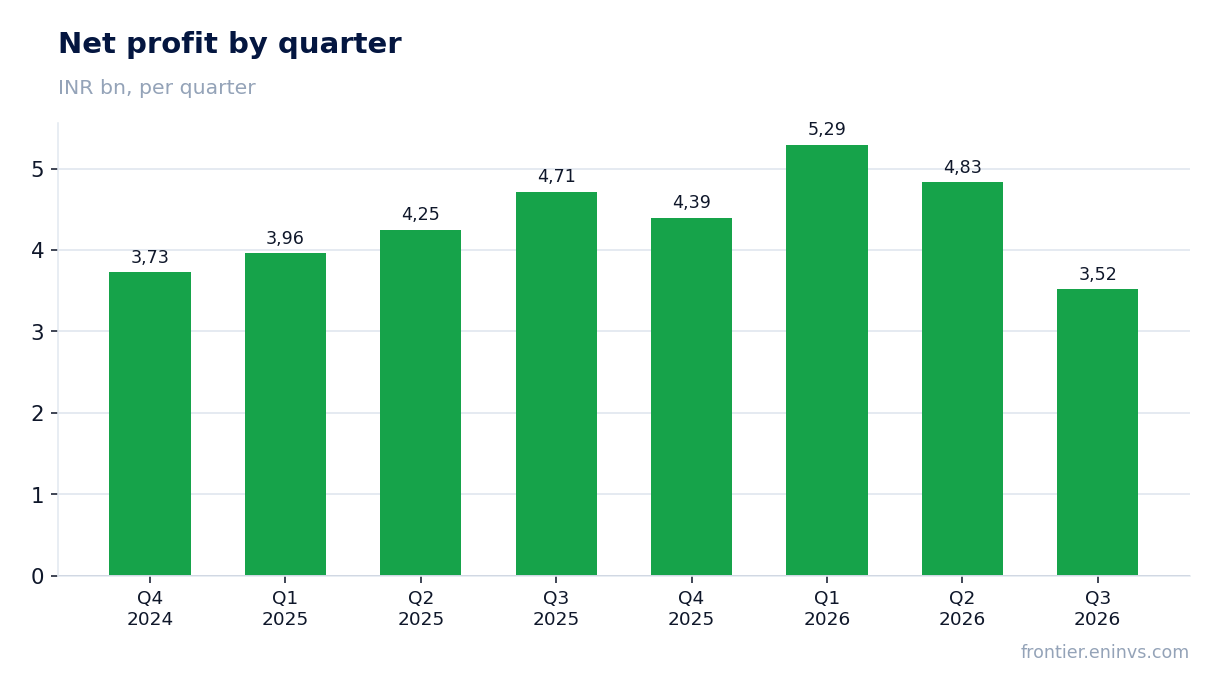
Net profit dropped 25.4% to INR 3,515.14 mn, with the net margin falling from 13.2% to 7.5%
Net profit in Q3 2026 was INR 3,515.14 mn, down 25.4% from a year earlier. The profit decline is deeper than the EBITDA decline, pointing to rising expenses below the operating line – possibly interest or tax costs.
The net margin fell from 13.2% to 7.5%. This is the lowest level in recent quarters: net profit was INR 5,292.6 mn in Q1 2026 and INR 4,830.43 mn in Q2 2026, and it continued to decline in Q3.
Falling net profit alongside rising revenue is a warning signal. If the company cannot regain control over costs, pressure on profit will persist, and the current valuation may not be as cheap as the EV/EBITDA multiple suggests.
Over the trailing twelve months net profit was INR 18,032.7 mn on revenue of INR 168,000.0 mn
Over the trailing twelve months ended 30 September 2026, Persistent Systems' revenue was INR 168,000.0 mn and net profit was INR 18,032.7 mn. These figures reflect the combined result of four quarters and should not be directly compared with the reported quarter's growth rates.
The trailing twelve-month net margin is about 10.7%. This is below the level in the reported quarter a year earlier, confirming the downward trend in profitability.
Annual profit of INR 18,032.7 mn serves as the base for the P/E LTM of 50.2. Such a multiple implies that the market expects profit recovery despite the current decline.
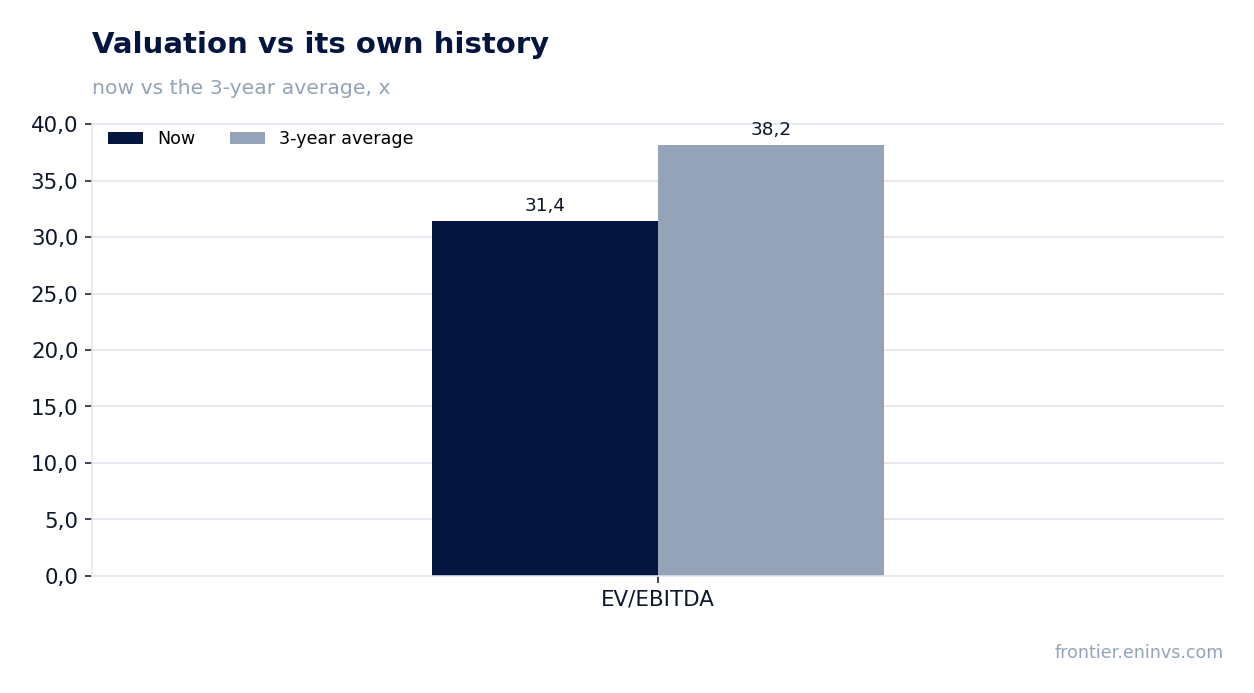
EV/EBITDA of 31.4 is 18% below its own three-year average of 38.2 – the stock is cheaper than its history
The trailing twelve-month EV/EBITDA multiple is 31.4, which is 18% below its own three-year average of 38.2. On this measure the stock trades cheaper than its average over the past three years.
However, the lower multiple may reflect not only a cheaper share price but also falling EBITDA: if profit continues to decline, the multiple's denominator will shrink and the current valuation will not look as low. P/E LTM of 50.2 looks high for a company with declining profit.
The comparison with its own history shows that the market has already priced in some de-rating, but not necessarily fully. For a final conclusion, it matters whether the margin recovers in the coming quarters.
The portal model puts the share's upside to fair value at -4%
On the portal's model, the fundamental value of the share based on EBITDA growth and the target multiple implies -4% upside to the current market price. This means the share trades slightly above its fair value on our model.
The portal model's estimate is not a market consensus or a target price – it is our own calculation based on current metrics. Negative upside indicates that the current price leaves no margin for growth.
Combined with falling profit and margin compression, the portal model confirms that the share does not look attractive for purchase at current levels, despite the multiple being below its history.
Trailing twelve-month dividend yield is 0.70% – a modest payout relative to profit
The trailing twelve-month dividend yield is 0.70%. This is a modest level that does not compensate for the risk of falling profit and does not provide meaningful support for the share.
With trailing twelve-month net profit of INR 18,032.7 mn and a market capitalisation of INR 905,804.125 mn, dividend payments look insignificant. The company prefers to direct profit into development rather than shareholder payouts.
For income-oriented investors, Persistent Systems is not of interest: a 0.70% yield is well below risk-free rates. The dividend factor does not change the neutral verdict.
Valuation on the latest reported figures
| Metric | Value |
|---|---|
| Market cap | 906 bn INR |
| P/E (LTM) | 50.2 |
| EV/EBITDA (LTM) | 31.4 |
| P/B | 11.56 |
| ROE | 16.5% |
| Dividend yield (12m) | 0.7% |
| EV/EBITDA, 3-year average | 38.2 |
Bottom line
The report's strong point is the acceleration of revenue growth to 30.3% year on year, indicating demand for the company's services. However, this growth is not converting into profit: EBITDA fell 2.8%, net profit dropped 25.4%, and the margin compressed. The decline in the EV/EBITDA multiple to 31.4 versus the three-year average of 38.2 makes the stock cheaper than its history, but the portal model points to -4% upside and a 0.70% dividend yield is not attractive. The verdict is neutral: arguments for a lower valuation and for revenue growth balance each other, but a recovery in margin is needed to improve the verdict.
Open the company's financial profile PERSISTENT →
See also: market overview · valuation map · stock screeners