State Bank of India: profit up 20% while net interest income fell by a quarter
State Bank of India reported third-quarter 2026 results on 12 February: net profit reached 253.6 bn rupees, up 20.0% year on year, on net interest income of 706.0 bn rupees. Interest income fell 22.8% year on year after a 10.2% rise the previous quarter – a deceleration, and profit is not resting on it. At a trailing P/E of 10.3 and a return on equity of 15.7%, the share looks rather attractive, but profit growth without interest-income growth needs explaining.
Key takeaways
— Net profit rose 20.0% year on year to 253.6 bn rupees while net interest income fell 22.8%
— Interest income fell 22.8% after a 10.2% rise the previous quarter – a deceleration, not a reversal
— Trailing twelve-month profit reached 904.3 bn rupees on interest income of 3,700.0 bn rupees
— A 15.7% return on equity at a P/E of 10.3 means earnings repay the share price in about ten years
— A 1.7% dividend yield is modest for a bank with this return on equity and does not cover the deposit rate
— On the portal's model, fair value is 11% above the current price
Attractiveness
Key figures, INR bn
| Metric | Q3 2025 | Q3 2026 | Change |
|---|---|---|---|
| Net profit | 211 | 254 | +20.0% |
Net profit rose 20.0% year on year to 253.6 bn rupees while net interest income fell 22.8%
In the third quarter of 2026, net profit reached 253.6 bn rupees, 20.0% above the year-earlier level. That is the best quarterly result in the available history: 241.1 bn the previous quarter and 211.4 bn a year ago.
Net interest income for the same quarter was 706.0 bn rupees, 22.8% below the year-earlier figure. Interest income fell by more than profit grew, so the profit growth did not come from the lending business.
Profit rising while interest income falls is the central contradiction of the report. Without a breakdown of income, it is impossible to say what offset the decline: fees, one-off items or lower costs. The durability of the profit growth depends on that answer.
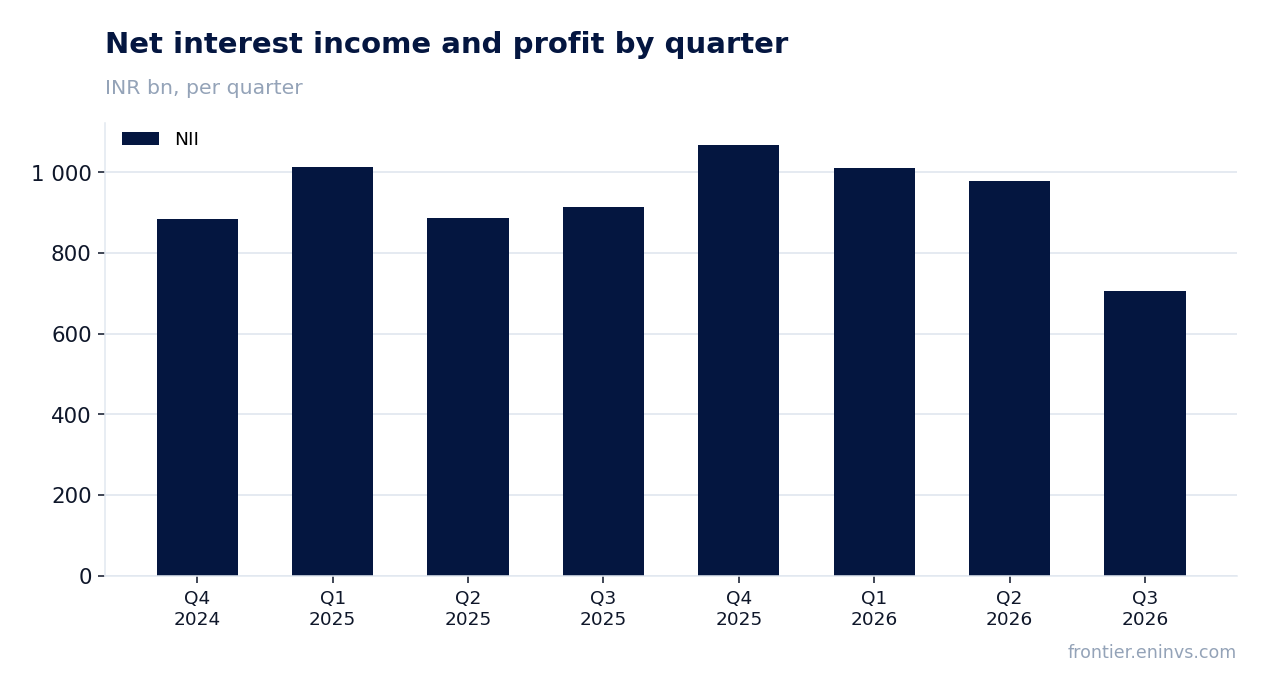
Interest income fell 22.8% after a 10.2% rise the previous quarter – a deceleration, not a reversal
The trajectory of interest income reversed sharply: it grew 10.2% year on year in the second quarter of 2026 and fell 22.8% in the third. That is a deceleration, and the sharpest in the available history of quarterly comparisons.
A quarter earlier, net interest income was 978.1 bn rupees; now it is 706.0 bn. A fall of 272.1 bn in a single quarter is not seasonal noise but a change of regime.
For a bank, net interest income is the main source of profit. A quarter-on-quarter decline of this size while profit rises means profit rests on items that may not recur next quarter.
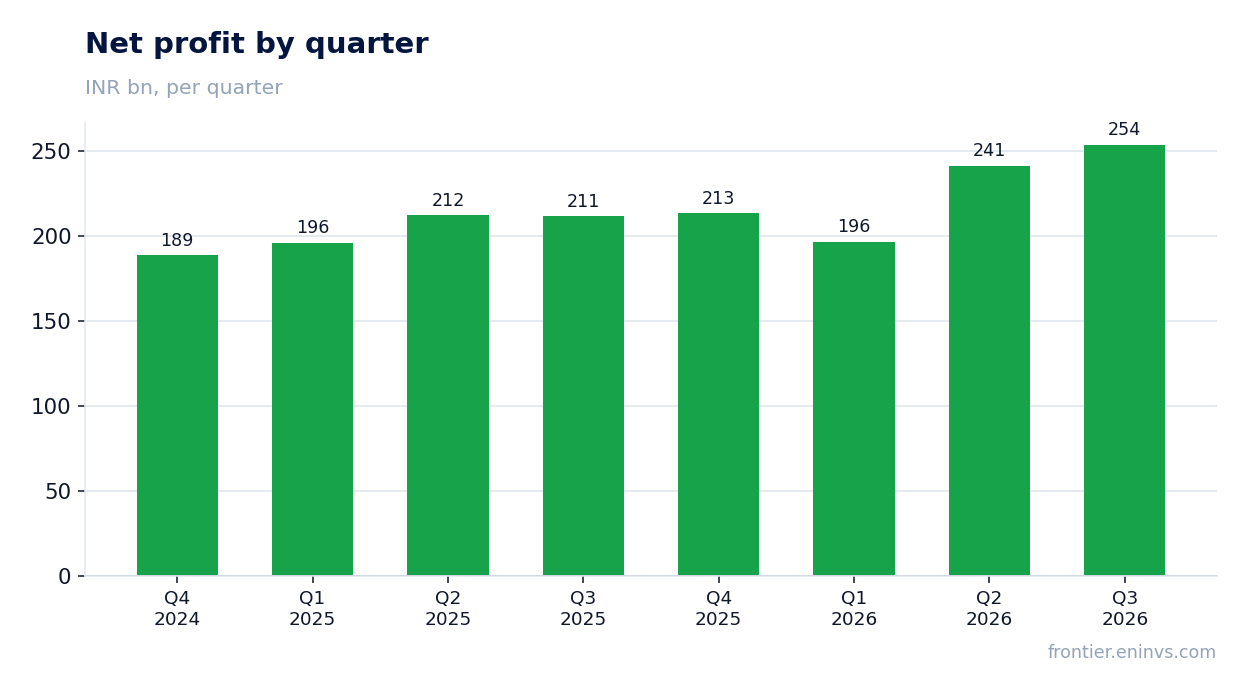
Trailing twelve-month profit reached 904.3 bn rupees on interest income of 3,700.0 bn rupees
Over the trailing twelve months, net profit was 904.3 bn rupees and net interest income 3,700.0 bn rupees. That is the base for the 10.3 P/E and the 15.7% return on equity.
Trailing profit is 3.6 times the quarterly figure – the quarter is not an anomaly but part of a steady annual flow. Yet the annual base includes quarters with strong interest income that are not repeating.
A 15.7% return on equity at a P/E of 10.3 means the market values the bank below book. That is typical for banks with uncertain interest-income dynamics, and this report reinforces that uncertainty.
A 15.7% return on equity at a P/E of 10.3 means earnings repay the share price in about ten years
The trailing P/E is 10.3 and return on equity 15.7%. At that return, equity doubles in about five years, while the market pays ten times less than annual profit.
Market capitalisation is 9,289.8 bn rupees against trailing profit of 904.3 bn. Profit over capitalisation gives 10.3 – a level at which the market prices in neither growth nor stability of earnings.
On the portal's model, fair value is 11% above the current price. That is our own estimate, not a market consensus, and it rests on current earnings rather than their growth.
A 1.7% dividend yield is modest for a bank with this return on equity and does not cover the deposit rate
The trailing twelve-month dividend yield is 1.7%. With a 15.7% return on equity, the bank earns far more than it pays out, so most of profit stays in capital.
A 1.7% yield is below deposit rates in most developed economies. For an income buyer that is a weak argument; for a buyer counting on capital growth, what matters more is where the undistributed 14 percentage points of return go.
A fall in profit could cut the payout: if interest income keeps shrinking, profit will follow and the dividend will have to be trimmed. While profit grows the risk is small, but it is directly tied to interest-income dynamics.
On the portal's model, fair value is 11% above the current price
The portal's model puts fair value 11% above the current price. The calculation rests on current earnings and a 15.7% return on equity at a P/E of 10.3.
The estimate does not account for the risk of falling interest income. If trailing profit of 904.3 bn rupees shrinks along with interest income, fair value will fall with it.
An 11% upside is moderate. It does not offset the risk of a quarter-on-quarter profit decline if interest income stays at the current level. The valuation is therefore rather attractive, not unconditionally so.
Valuation on the latest reported figures
| Metric | Value |
|---|---|
| Market cap | 9 290 bn INR |
| P/E (LTM) | 10.3 |
| P/B | 1.56 |
| ROE | 15.7% |
| Dividend yield (12m) | 1.7% |
Bottom line
The strong side of the report is profit: 253.6 bn rupees, up 20.0% year on year, with a 15.7% return on equity. The weak side is interest income: a 22.8% fall after a 10.2% rise the previous quarter, and profit does not rest on it. A 10.3 P/E and the portal's 11% upside make the share rather attractive, but the key question for a holder is whether profit holds once interest income stops falling. A 1.7% dividend yield offers no margin of safety.
Open the company's financial profile SBIN →
See also: market overview · valuation map · stock screeners