Sun Pharmaceutical: revenue up 11.2% but net profit down 36.2% – the gap is a one-off base effect from last year
Sun Pharmaceutical reported results for the third quarter of 2026. Revenue came in at 161.0 bn rupees (+11.2% year on year), EBITDA at 39.9 bn (+10.7%), and net profit at 19.9 bn (–36.2%). The EBITDA margin held at 24.8%, while the net margin fell from 21.5% to 12.4% on a high base from last year. With an EV/EBITDA of 22.9 against its own three-year average of 27.2 and a net cash position of 157.1 bn rupees, the share looks attractive at the current price.
Key takeaways
— Revenue grew 11.2% year on year, and the pace accelerated versus the previous quarter
— The EBITDA margin held at 24.8% despite revenue growth
— Net profit fell 36.2% on a high base from last year, not on operating deterioration
— The net cash position rose to 157.1 bn rupees, providing a cushion
— The EV/EBITDA multiple of 22.9 is below its own three-year average of 27.2 – the stock is cheaper than its history
— The dividend yield of 0.9% is modest, but payouts remain stable
Attractiveness
Key figures, INR bn
| Metric | Q3 2025 | Q3 2026 | Change |
|---|---|---|---|
| Revenue | 145 | 161 | +11.2% |
| EBITDA | 36.1 | 39.9 | +10.7% |
| Operating profit | 33.7 | 39.1 | +16.0% |
| Net profit | 31.2 | 19.9 | -36.2% |
| EBITDA margin | 24.9% | 24.8% | -0.1 pp |
| Net margin | 21.5% | 12.4% | -9.1 pp |
Revenue grew 11.2% year on year, and the pace accelerated versus the previous quarter
Revenue for the third quarter of 2026 came in at 161.0 bn rupees, 11.2% above the level a year earlier. Growth accelerated: in the second quarter of 2026 the pace was 11.2%, and in the first it was 10.1%. This points to sustained demand for the company's products.
The key therapeutic areas drove the increase, although the facts do not provide a segment breakdown. Importantly, the company maintains momentum against a high base from last year, when third-quarter 2025 revenue was already substantial.
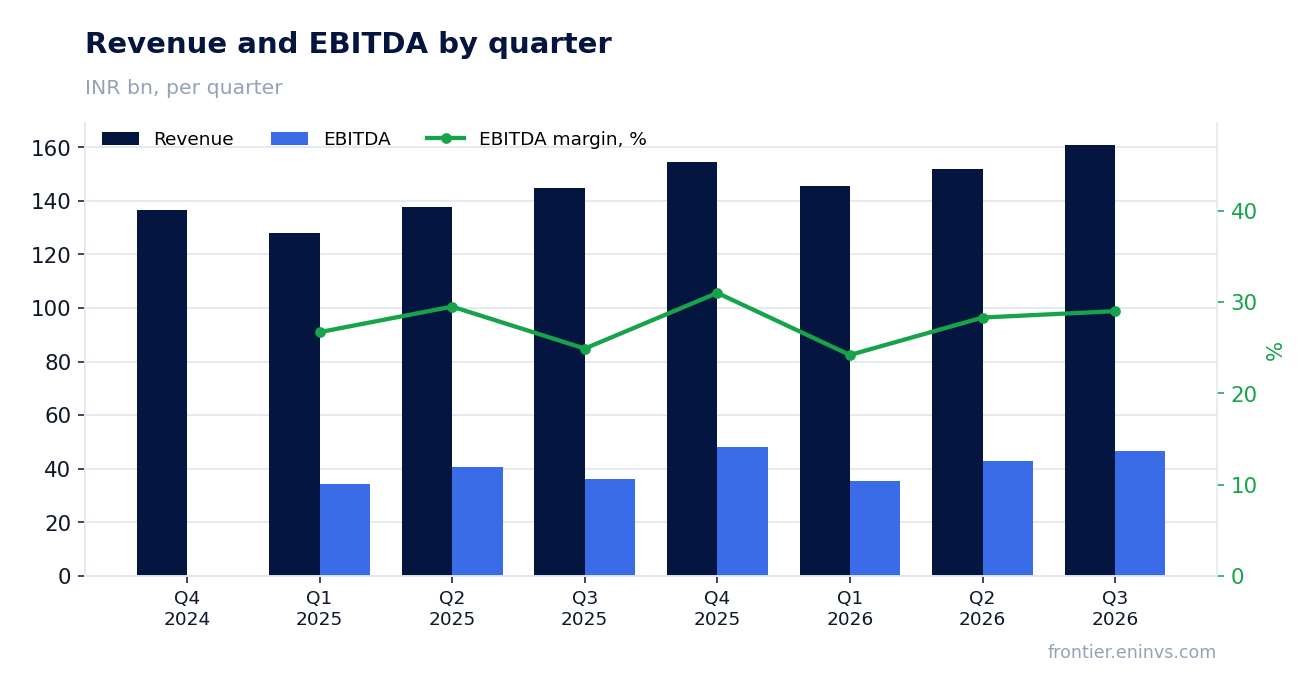
The EBITDA margin held at 24.8% despite revenue growth
EBITDA for the third quarter of 2026 was 39.9 bn rupees, up 10.7% year on year. The EBITDA margin was 24.8%, essentially unchanged from 24.9% a year earlier. This indicates that revenue growth did not come with significant cost pressure.
Operating profit reached 39.1 bn rupees, also confirming stable operating efficiency. The company managed to hold the margin amid revenue growth, which points to cost control.
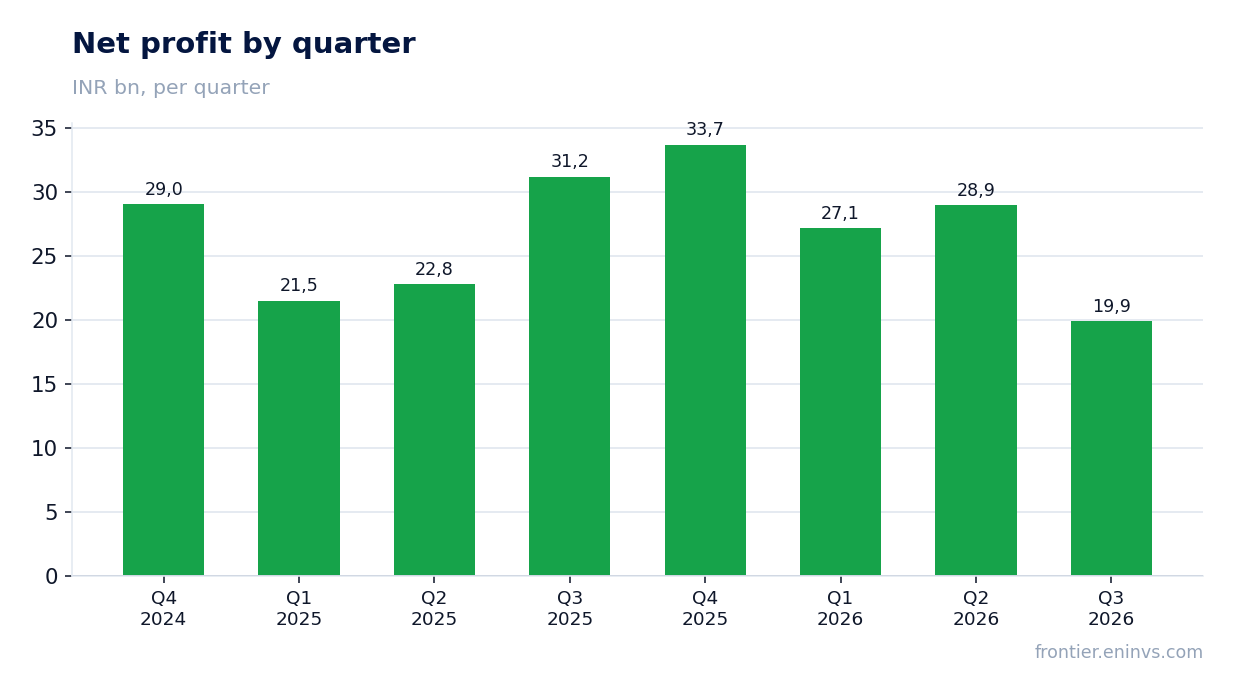
Net profit fell 36.2% on a high base from last year, not on operating deterioration
Net profit for the third quarter of 2026 was 19.9 bn rupees, 36.2% below the level a year earlier. However, this decline is explained by a high base: in the third quarter of 2025 profit was 31.2 bn rupees, which included one-off factors not repeated in the current period.
The net margin fell from 21.5% to 12.4%, but this is a consequence of last year's base, not of operating deterioration. Operating profit and EBITDA grew, confirming that the business is performing steadily and the profit decline is technical in nature.
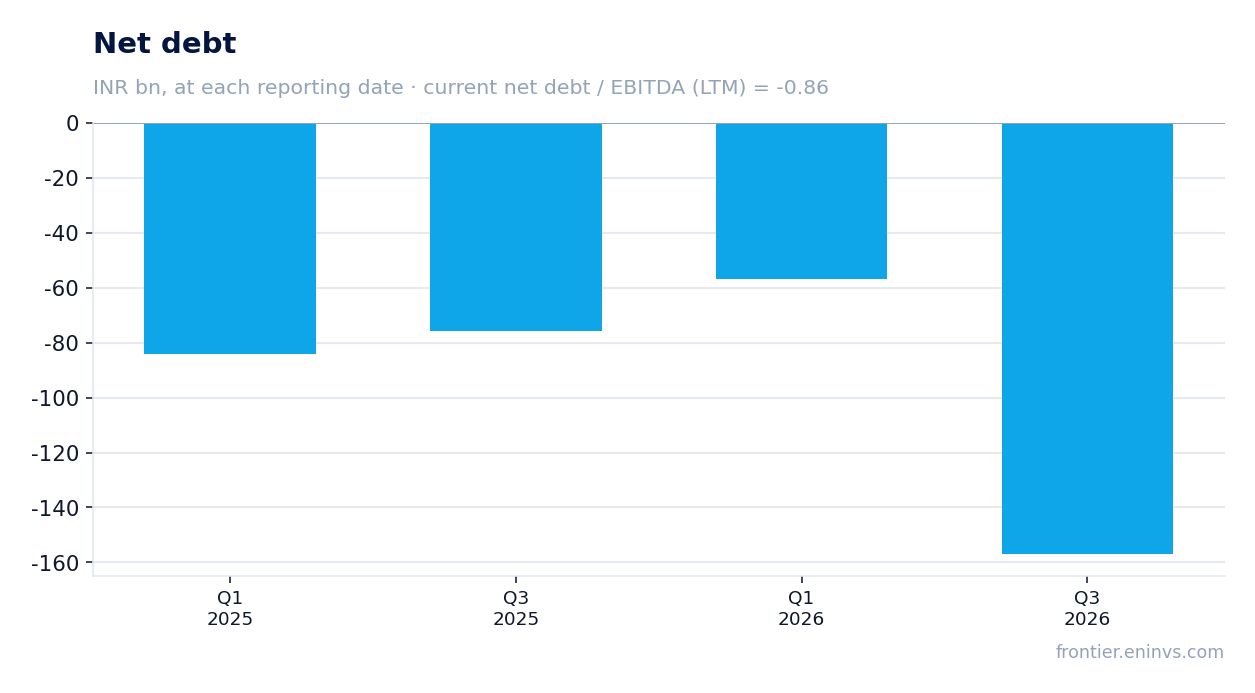
The net cash position rose to 157.1 bn rupees, providing a cushion
Net debt as of 30 September 2026 was minus 157.1 bn rupees, meaning the company has a net cash position. This is a substantial liquidity cushion that allows it to fund development without borrowing.
The net debt to LTM EBITDA ratio is –0.86, confirming the absence of debt burden. Over the last 12 months the net cash position increased by 81.4 bn rupees – from 75.7 bn on 30 September 2025 to 157.1 bn on 30 September 2026. This strengthens the company's financial stability.
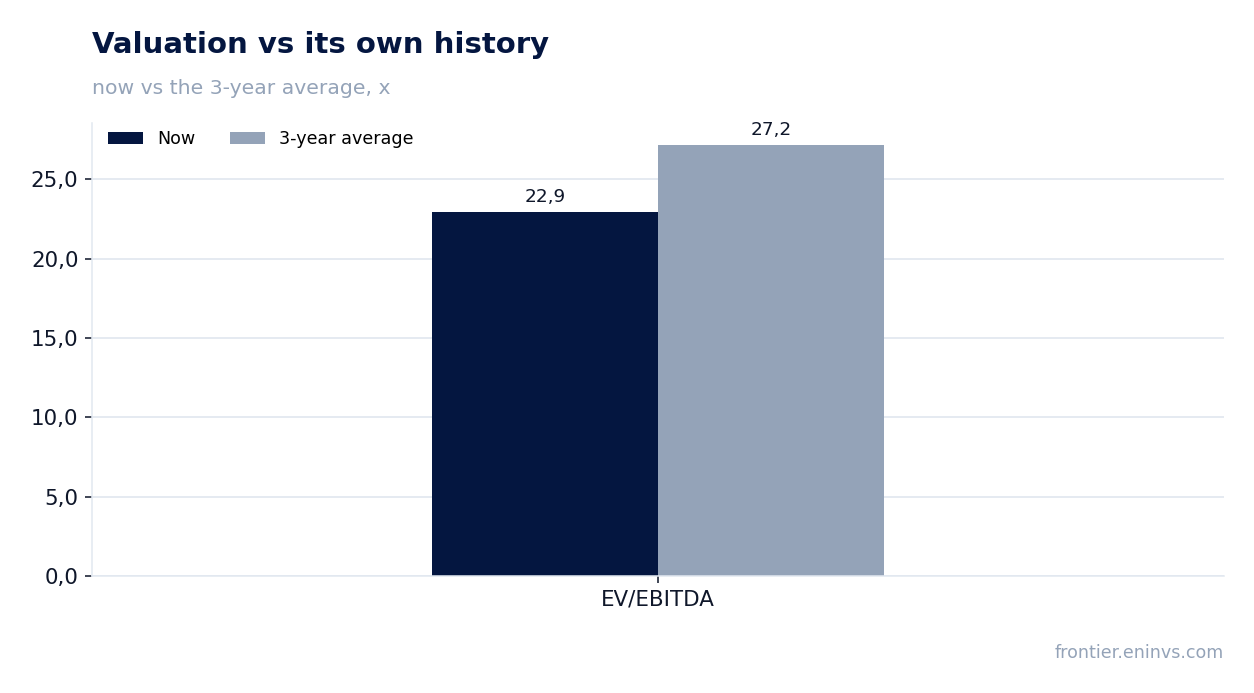
The EV/EBITDA multiple of 22.9 is below its own three-year average of 27.2 – the stock is cheaper than its history
The LTM EV/EBITDA is 22.9, 16% below its own three-year average of 27.2. This means that on this multiple the stock trades cheaper than it usually has over the past three years. Such a valuation may attract investors looking for undervalued securities.
The LTM P/E is 38.7, reflecting the current profit level. Given the net cash position and stable operating cash flow, the current valuation looks reasonable. On the portal's model, the upside of the share to fair value is estimated at +18%.
The dividend yield of 0.9% is modest, but payouts remain stable
The dividend yield over the last 12 months is 0.9%. This is a low figure, reflecting the company's conservative dividend policy. However, the stability of payments and a strong balance sheet support the expectation that dividends will be maintained.
For the current year we estimate dividend payments based on established practice. The key factor remains the payout ratio and the absence of large one-off write-offs. A dividend cut is possible only in the event of a significant deterioration in financial results, which is unlikely given current dynamics.
Valuation on the latest reported figures
| Metric | Value |
|---|---|
| Market cap | 4 245 bn INR |
| P/E (LTM) | 38.7 |
| EV/EBITDA (LTM) | 22.9 |
| P/B | 5.08 |
| Net debt / EBITDA (LTM) | -0.86 |
| ROE | 9.2% |
| Dividend yield (12m) | 0.9% |
| EV/EBITDA, 3-year average | 27.2 |
Bottom line
Bottom line: Sun Pharmaceutical delivered steady revenue growth of 11.2% and held its EBITDA margin at 24.8%. The 36.2% drop in net profit is explained by a high base from last year and does not reflect a deterioration in the business. The net cash position of 157.1 bn rupees and an EV/EBITDA of 22.9 against a three-year average of 27.2 make the share attractive at the current price. The key question for a holder is whether revenue growth will hold in the coming quarters.
Open the company's financial profile SUNPHARMA →
See also: market overview · valuation map · stock screeners