Tech Mahindra: revenue up 15.6% while EBITDA jumped 80.6% – but growth has decelerated for a second quarter
Tech Mahindra's report for the quarter ended 30 September 2026 showed revenue of 161.8 bn INR (+15.6% YoY), EBITDA of 28.7 bn (+80.6%) and net profit of 15.9 bn (+32.7%). The EBITDA margin rose to 17.7% from 11.4% a year earlier, and the net margin to 9.8% from 8.5%. Yet revenue growth decelerated from 17.7% in the prior quarter to 15.6%, and the EV/EBITDA multiple of 17.0 sits below its own three-year average of 19.5. The share looks rather attractive: growth and margin are strong, net debt is negative, and the valuation is below its own history, but the deceleration and the portal model's zero upside keep it from a higher rating.
Key takeaways
— Revenue rose 15.6% YoY to 161.8 bn INR, but growth decelerated from 17.7% a quarter earlier
— EBITDA jumped 80.6% to 28.7 bn INR, lifting the margin to 17.7% from 11.4%
— Net profit grew 32.7% to 15.9 bn INR, with the net margin reaching 9.8%
— Net debt is negative: a cash cushion of 46.6 bn INR as of 30 September 2026
— EV/EBITDA of 17.0 is below its own three-year average of 19.5 – the share is cheaper than its history
— Dividend yield of 2.85% on trailing twelve-month payouts
— The portal model sees no upside: fair value matches the current price
Attractiveness
Key figures, INR bn
| Metric | Q3 2025 | Q3 2026 | Change |
|---|---|---|---|
| Revenue | 140 | 162 | +15.6% |
| EBITDA | 15.9 | 28.7 | +80.6% |
| Operating profit | 17.0 | 23.9 | +40.5% |
| Net profit | 11.9 | 15.9 | +32.7% |
| EBITDA margin | 11.4% | 17.7% | +6.3 pp |
| Net margin | 8.5% | 9.8% | +1.3 pp |
Revenue rose 15.6% YoY to 161.8 bn INR, but growth decelerated from 17.7% a quarter earlier
In the quarter ended 30 September 2026, Tech Mahindra's revenue reached 161.8 bn INR, up 15.6% from a year earlier. This is a strong result: the company has grown at double-digit rates for four consecutive quarters.
However, growth decelerated: revenue rose 17.7% YoY in the prior quarter and 15.6% now. The 2.1 percentage point slowdown shows momentum weakening, although the absolute growth rate remains high.
The facts do not specify which segments or clients drove the increase. What can be said is that revenue is growing faster than its four-quarter average, and this supports the other financial metrics.
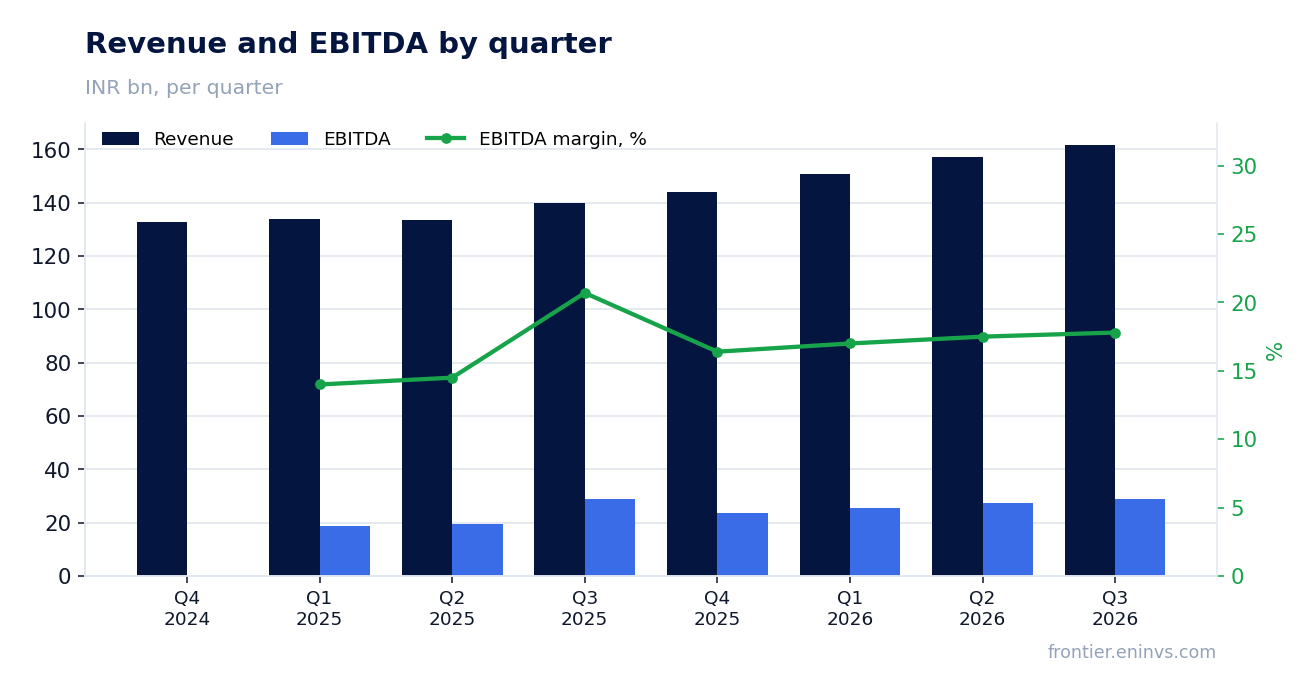
EBITDA jumped 80.6% to 28.7 bn INR, lifting the margin to 17.7% from 11.4%
EBITDA for the reported quarter was 28.7 bn INR, up 80.6% from a year earlier. This growth significantly outpaces the revenue increase, meaning the company improved operational efficiency.
The EBITDA margin rose to 17.7% from 11.4% in the same quarter last year. The 6.3 percentage point margin expansion is the key factor behind the outsized profit growth.
The facts do not break down cost lines, so it is impossible to say which expense category delivered the savings. But the combination of 15.6% revenue growth and 80.6% EBITDA growth shows operating leverage worked at full force.
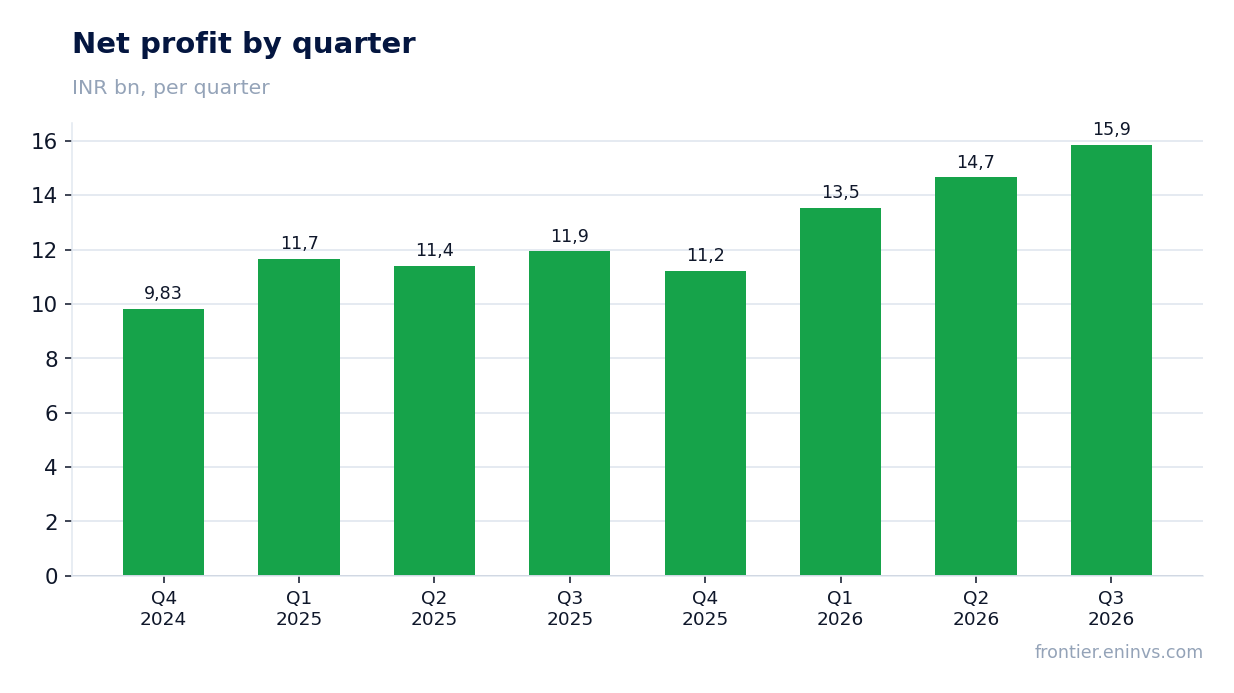
Net profit grew 32.7% to 15.9 bn INR, with the net margin reaching 9.8%
Net profit for the quarter was 15.9 bn INR, up 32.7% YoY. Profit growth is slower than EBITDA growth, explained by a higher prior-year base and, likely, dynamics in below-operating lines.
The net margin rose to 9.8% from 8.5% a year earlier. The 1.3 percentage point improvement is more modest than the EBITDA margin gain but still confirms the overall profitability trend.
Operating profit for the quarter was 23.9 bn INR. The gap between operating and net profit – 8.0 bn – covers taxes and other items, for which the facts provide no detail.
Net debt is negative: a cash cushion of 46.6 bn INR as of 30 September 2026
As of 30 September 2026, Tech Mahindra's net debt stood at minus 46.6 bn INR, meaning the company holds a cash cushion rather than debt. This level fully removes any concern about leverage.
Since 31 March 2026, net debt moved from minus 49.8 bn INR to minus 46.6 bn (+3.2 bn). The cash cushion shrank by 3.2 bn INR over six months but remains substantial.
The net debt to EBITDA ratio for the trailing twelve months is minus 0.46. The negative value confirms the company funds operations from its own resources rather than borrowings.
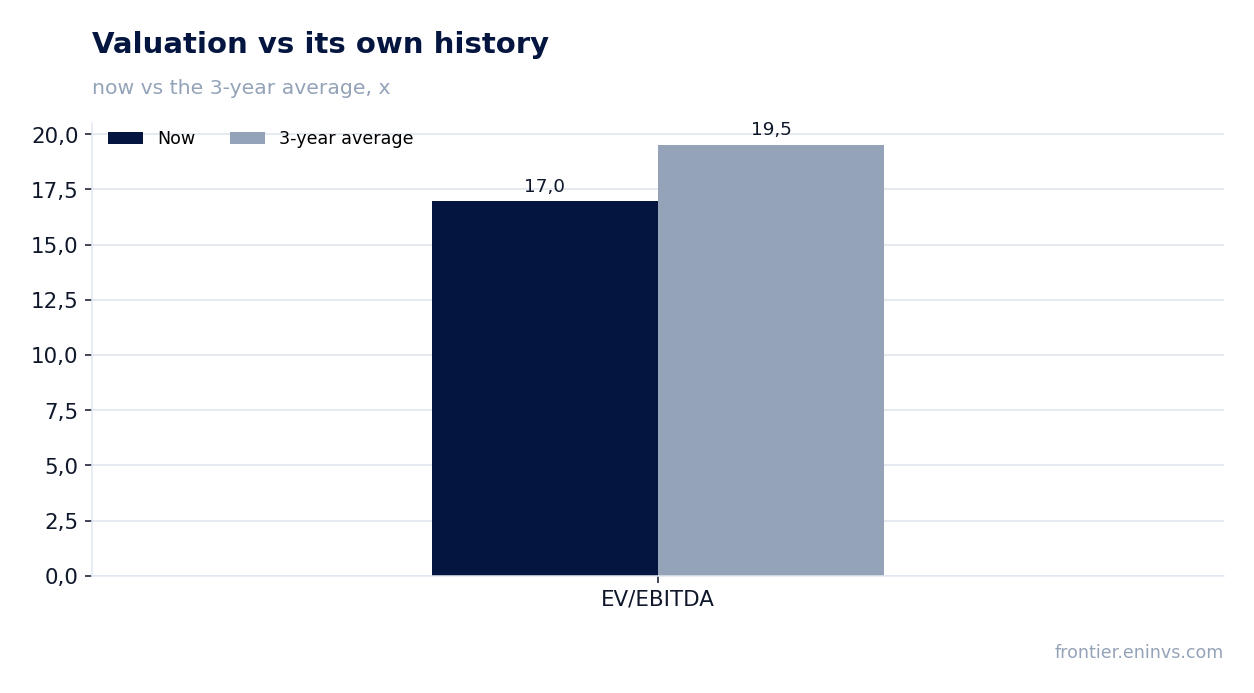
EV/EBITDA of 17.0 is below its own three-year average of 19.5 – the share is cheaper than its history
The EV/EBITDA multiple for the trailing twelve months is 17.0, 13% below its own three-year average of 19.5. This means the share trades cheaper on this metric than its average over the past three years.
The trailing twelve-month P/E is 31.7. The relationship between EV/EBITDA and P/E reflects the company's cash cushion: negative net debt lowers EV relative to market capitalisation.
Return on equity (ROE) for the trailing twelve months is 21.2%. This is a high figure that supports the investment case even at a moderate multiple.
Dividend yield of 2.85% on trailing twelve-month payouts
The trailing twelve-month dividend yield is 2.85%. This is a moderate level that provides holders with regular income but is not the main driver of returns.
The facts do not provide the dividend per share or the payout ratio, so it is impossible to assess what share of profit goes to dividends. What can be said is that the company pays dividends and their yield is close to 3%.
With trailing twelve-month net profit of 55.3 bn INR and market capitalisation of 1,754.6 bn INR, a 2.85% dividend yield corresponds to payouts of roughly 50 bn INR, or about 90% of profit. This is a high payout ratio that could limit dividend growth in the future.
The portal model sees no upside: fair value matches the current price
According to the portal model, which compares EBITDA growth with the target multiple and market capitalisation, Tech Mahindra's fair value matches the current price. The upside is 0%.
This means the market has already priced in current growth rates and margin levels. To create upside, the company would need to either accelerate revenue growth, further improve margins, or see the multiple decline.
The portal model is our own calculation, not a market consensus. It does not account for possible one-off factors and is not a target price.
Valuation on the latest reported figures
| Metric | Value |
|---|---|
| Market cap | 1 755 bn INR |
| P/E (LTM) | 31.7 |
| EV/EBITDA (LTM) | 17.0 |
| P/B | 5.92 |
| Net debt / EBITDA (LTM) | -0.46 |
| ROE | 21.2% |
| Dividend yield (12m) | 2.8% |
| EV/EBITDA, 3-year average | 19.5 |
Bottom line
Tech Mahindra's quarter delivered strong results: revenue grew 15.6%, EBITDA jumped 80.6%, and net profit rose 32.7%. The EBITDA margin climbed to 17.7% and the net margin to 9.8%. The company holds negative net debt of 46.6 bn INR and a high return on equity of 21.2%. However, revenue growth has decelerated for a second consecutive quarter, and the portal model sees no upside. The share looks rather attractive: the EV/EBITDA multiple is below its own history, the financial position is strong, and the 2.85% dividend yield provides regular income. But a move to 'attractive' would require either a return to accelerating growth or more upside in the model.
Open the company's financial profile TECHM →
See also: market overview · valuation map · stock screeners