TVS Motor: quarterly profit up 67%, but debt consumes the growth
25 августа TVS Motor раскрыла результаты за первый квартал 2026 финансового года: выручка выросла на 33,5% год к году, до 162 955,2 млн INR, EBITDA – на 35,8%, а чистая прибыль – на 67,1%, до 10 194,3 млн INR. Рентабельность по EBITDA поднялась до 15,3% с 15,1%, чистая маржа – до 6,3% с 5,0%. При этом долговая нагрузка остаётся высокой: net debt / EBITDA за последние 12 месяцев – 3,13, а акции торгуются с мультипликатором EV/EBITDA 25,4 против среднего за три года 22,6. На текущей цене бумага выглядит скорее привлекательной, но только если рост прибыли продолжится и компания начнёт сокращать долг.
Key takeaways
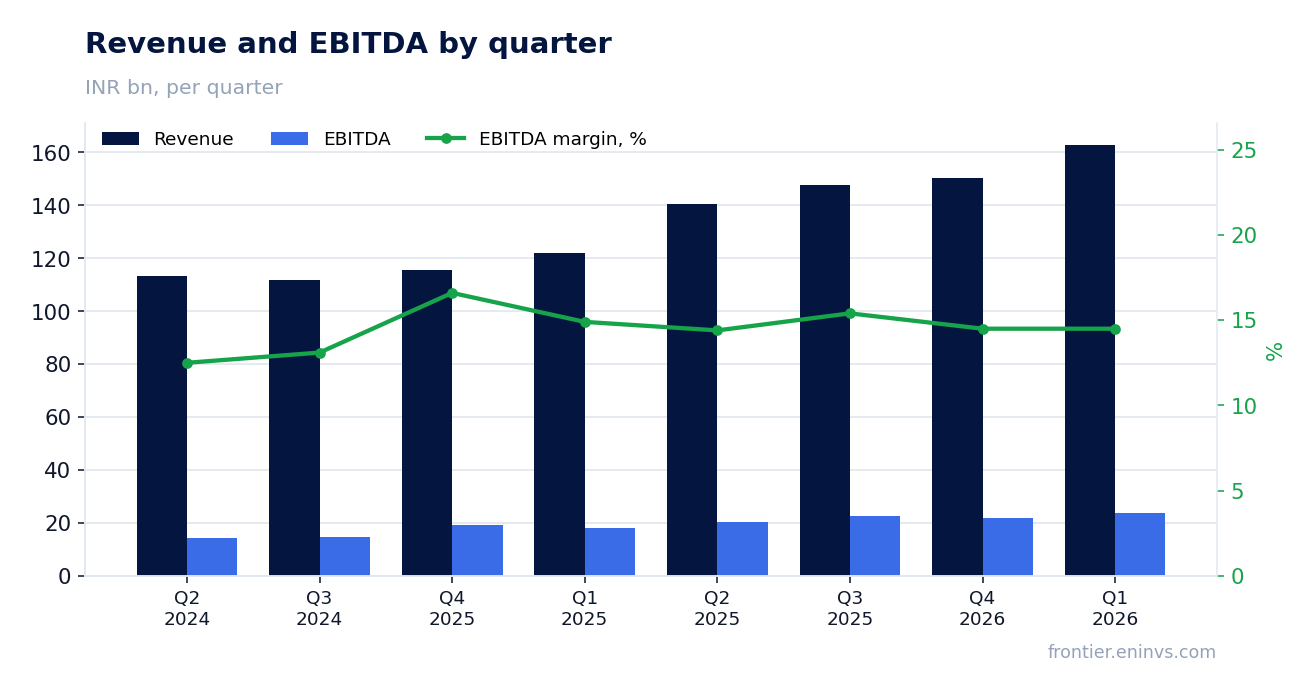
— Revenue accelerated to +33.5% on strong two-wheeler and three-wheeler sales
— EBITDA margin rose 0.2 pp on operating leverage and cost control
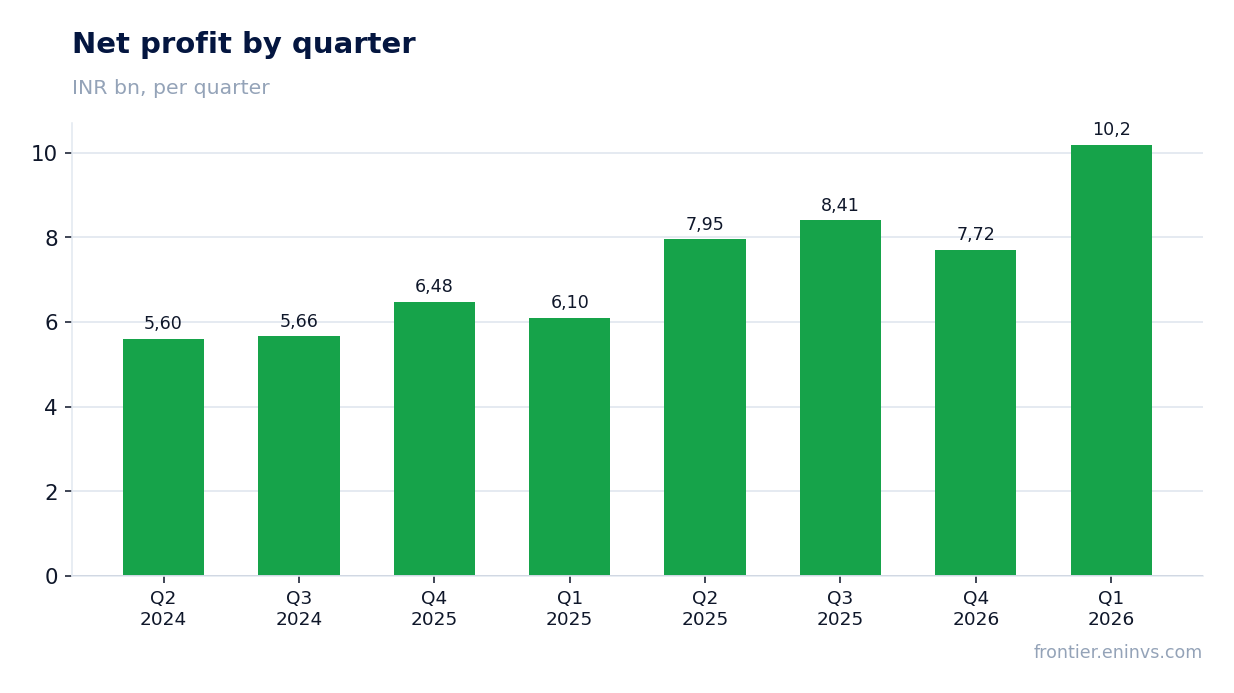
— Net profit grew 67.1% – faster than EBITDA, thanks to a lower effective tax rate
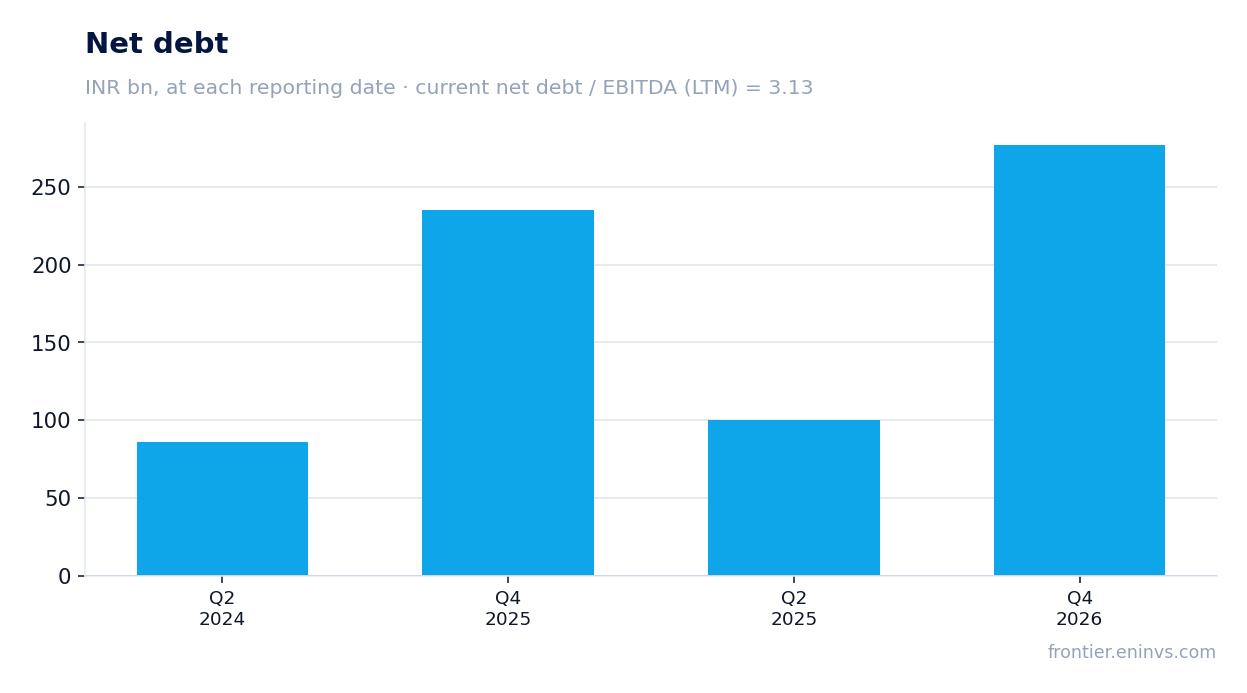
— Debt burden remains high: net debt/EBITDA at 3.13, with debt up INR 177.0 bn over the quarter
— Trailing dividend yield is just 0.29%, below the key rate
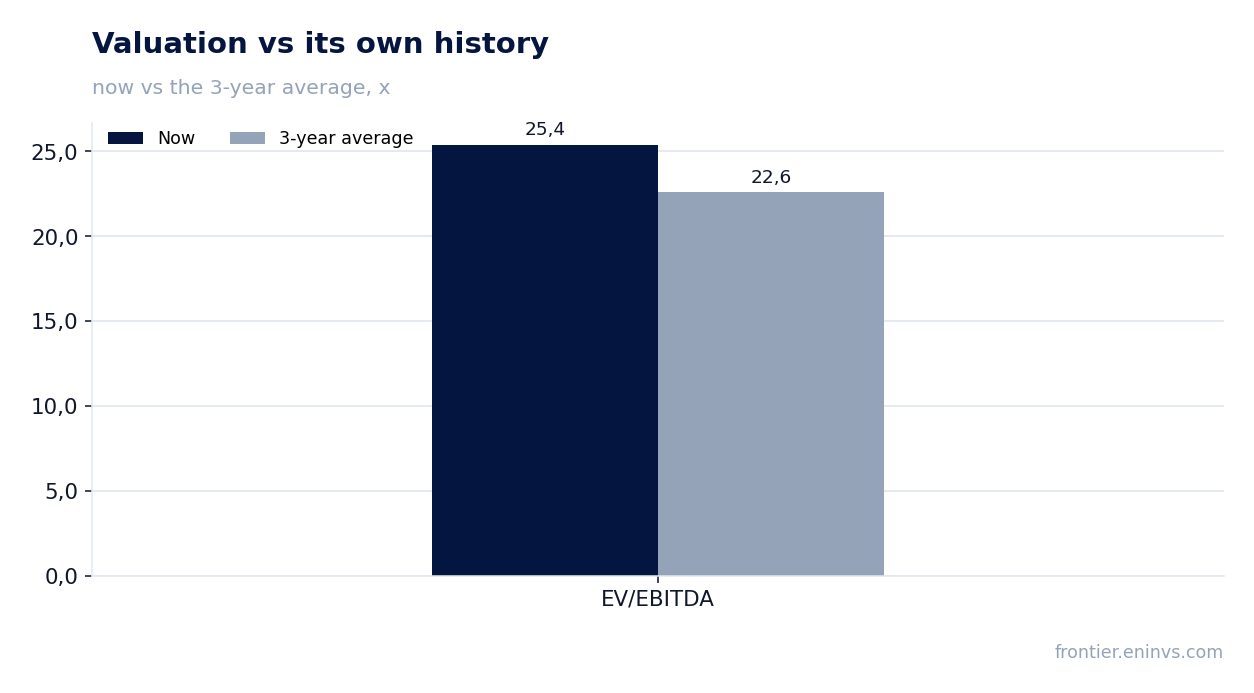
— Valuation is above its own history: EV/EBITDA 25.4 vs 22.6 three-year average
— Portal model implies +17% upside to fair value
Attractiveness
Key figures, INR bn
| Metric | Q1 2025 | Q1 2026 | Change |
|---|---|---|---|
| Revenue | 122 | 163 | +33.5% |
| EBITDA | 18.4 | 25.0 | +35.8% |
| Operating profit | 15.0 | 20.0 | +33.7% |
| Net profit | 6.10 | 10.2 | +67.1% |
| EBITDA margin | 15.1% | 15.3% | +0.2 pp |
| Net margin | 5.0% | 6.3% | +1.3 pp |
Revenue accelerated to +33.5% on strong two-wheeler and three-wheeler sales
In Q1 FY2026, TVS Motor's revenue reached INR 162,955.2 mn, up 33.5% year-on-year. This is an acceleration from prior quarters: Q2 FY2025 grew 23.9%, Q3 31.7%, Q4 30.4%. The company continues to expand sales both domestically and in export markets, particularly in motorcycles and three-wheelers.
Operating profit rose to INR 20,034.7 mn from INR 14,990.1 mn a year earlier, reflecting operating leverage: revenue grows faster than fixed costs. This confirms the resilience of the business model, though further acceleration will depend on sustained demand and competitive dynamics.
EBITDA margin rose 0.2 pp on operating leverage and cost control
EBITDA in the reported quarter reached INR 23,574.7 mn, up 35.8% year-on-year. EBITDA margin stood at 15.3% versus 15.1% in the same period last year. The margin increase is modest, but it comes amid accelerating revenue, indicating that the company keeps costs under control.
The margin improvement is a result of operating leverage: some costs (marketing, administrative) grow slower than revenue. At the same time, raw material costs and logistics may have exerted pressure, but the company offsets this through scale and pricing.
Net profit grew 67.1% – faster than EBITDA, thanks to a lower effective tax rate
Net profit for Q1 FY2026 stood at INR 10,194.3 mn versus INR 6,100.4 mn a year earlier. The 67.1% growth significantly outpaces EBITDA dynamics (+35.8%), indicating one-off factors or a lower tax burden. The report does not disclose details, but the gap between operating and net profit growth typically arises from changes in the effective tax rate or non-operating income.
Net margin rose to 6.3% from 5.0% a year earlier. If net profit growth were driven only by operations, the margin would have increased less. Therefore, part of the increase may be irregular, and in coming quarters net profit growth will likely moderate to a pace closer to EBITDA growth.
Debt burden remains high: net debt/EBITDA at 3.13, with debt up INR 177.0 bn over the quarter
As of the latest balance sheet date, TVS Motor's net debt stood at INR 276,974.8 mn. It increased by INR 177.0 bn over the quarter and by INR 42.0 bn over the last 12 months. Net debt to EBITDA for the trailing twelve months is 3.13, a high level for an automaker.
The debt increase is partly related to investments in new models and capacity expansion, as well as possible dividend payments. However, with trailing EBITDA of INR 88,581.0 mn, debt servicing requires a significant portion of operating cash flow, which over the same period was only INR 18,700.0 mn – indicating a gap between profitability and cash generation.
Trailing dividend yield is just 0.29%, below the key rate
Over the last 12 months, TVS Motor paid dividends corresponding to a yield of 0.29% at the current price. This is significantly below the key rate, making the stock unattractive for income-oriented investors. The company pays dividends irregularly and with a low payout ratio, preferring to reinvest profits in growth.
At such a yield, dividends are not a reason to buy the stock. If the company maintains its low-payout policy, investors will rely solely on capital appreciation, which requires sustained profit growth and debt reduction.
Valuation is above its own history: EV/EBITDA 25.4 vs 22.6 three-year average
The current EV/EBITDA multiple is 25.4 – above the three-year average of 22.6. The company's market capitalization is INR 1,972,133.6 mn, corresponding to a trailing P/E of 57.5. Such valuation implies that investors expect continued high profit growth.
The premium to its own history may be justified by accelerating revenue growth and margin improvement, but it leaves little room for disappointment. If growth slows or debt burden does not start declining, the multiple could compress.
Portal model implies +17% upside to fair value
According to our value-creation model, based on EBITDA growth and a target multiple, the stock's upside potential is +17% from the current price. This implies that even at the current elevated valuation, the market has not fully priced in expected operating profit growth.
The model assumes EBITDA will continue to grow at a pace close to recent quarters and that the multiple will remain near current levels. If the company disappoints on growth or increases debt, the potential may not materialize.
Valuation on the latest reported figures
| Metric | Value |
|---|---|
| Market cap | 1 972 bn INR |
| P/E (LTM) | 57.5 |
| EV/EBITDA (LTM) | 25.4 |
| P/B | 20.62 |
| Net debt / EBITDA (LTM) | 3.13 |
| Operating cash flow (LTM) | 18.7 bn |
| ROE | 40.2% |
| Dividend yield (12m) | 0.3% |
| EV/EBITDA, 3-year average | 22.6 |
Bottom line
In Q1 FY2026, TVS Motor delivered strong revenue and profit growth, accelerating to +33.5% revenue and +67.1% net profit. However, part of the net profit increase is likely one-off, and leverage remains high: net debt/EBITDA at 3.13, with debt up INR 177.0 bn over the quarter. Operating cash flow over the last 12 months (INR 18,700.0 mn) is significantly below EBITDA (INR 88,581.0 mn), indicating a gap between profit and cash. At the current valuation (EV/EBITDA 25.4 vs 22.6 average), the stock looks rather attractive, but only if profit growth continues and the company starts generating stronger cash flow. Verdict: rather attractive.
Open the company's financial profile TVSMOTOR →
See also: market overview · valuation map · stock screeners