TVS Motor: revenue accelerated to +38.7%, but profit outpaces debt
On 25 November, TVS Motor reported results for the third quarter of 2026. Revenue came in at 194,744.4 mn INR, EBITDA at 28,190.3 mn INR, and net profit at 11,945.1 mn INR. Revenue growth accelerated from +33.5% in the first quarter to +38.7% in the second, while net profit rose 50.2% year on year. At the same time, leverage remains high and the EV/EBITDA multiple is above its own three-year history. The share looks neutral: strong operating momentum is offset by a rich valuation and debt.
Key takeaways
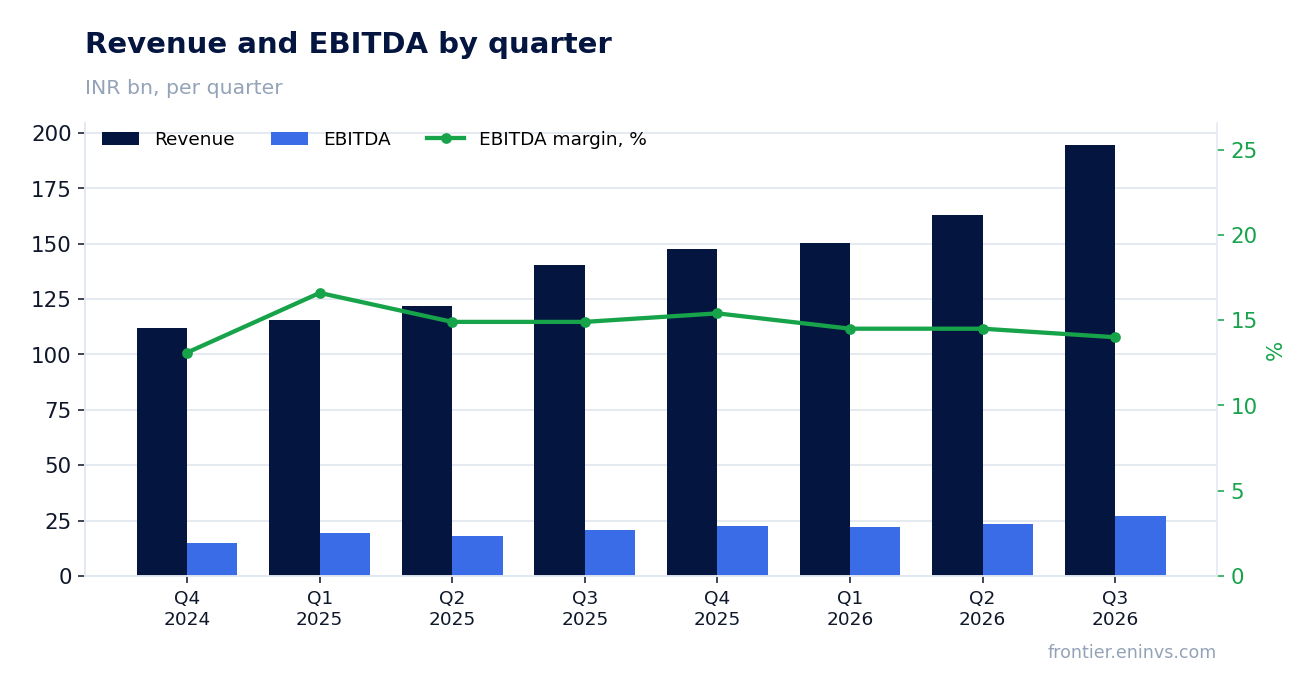
— Revenue rose 38.7% year on year, and growth accelerated versus the first quarter
— EBITDA grew 35.1%, but the margin fell to 14.5% from 14.9% a year earlier
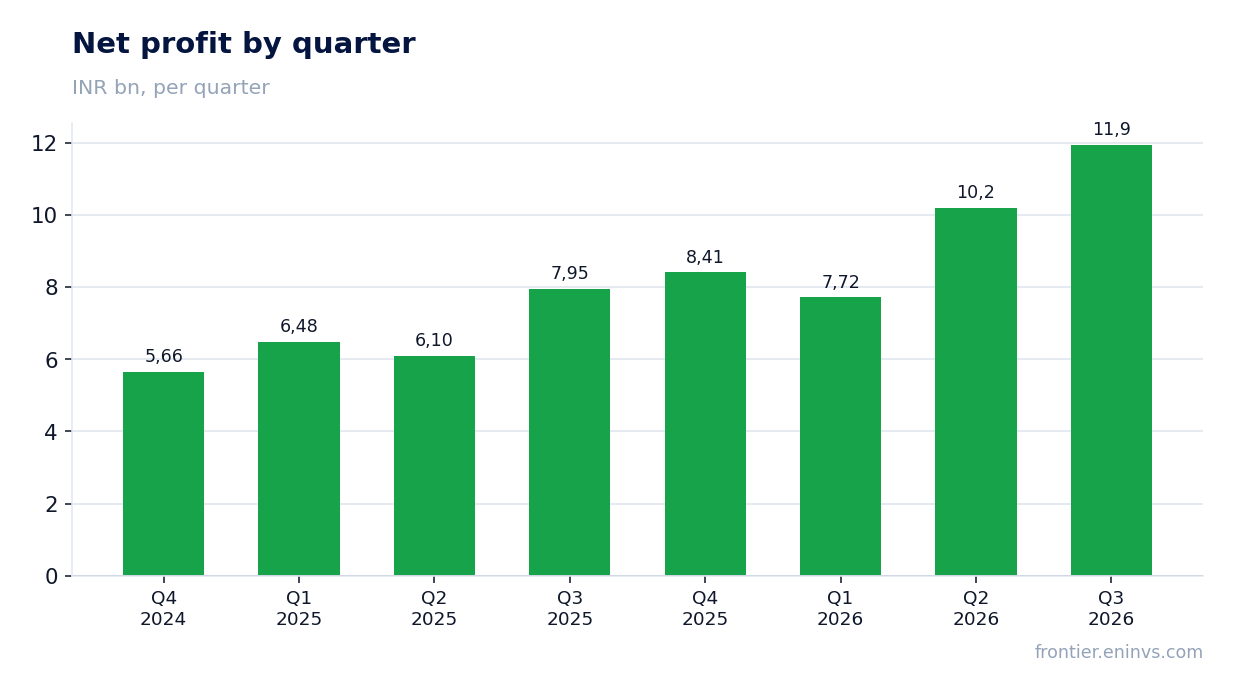
— Net profit rose 50.2% – faster than EBITDA – lifting the margin to 6.1%
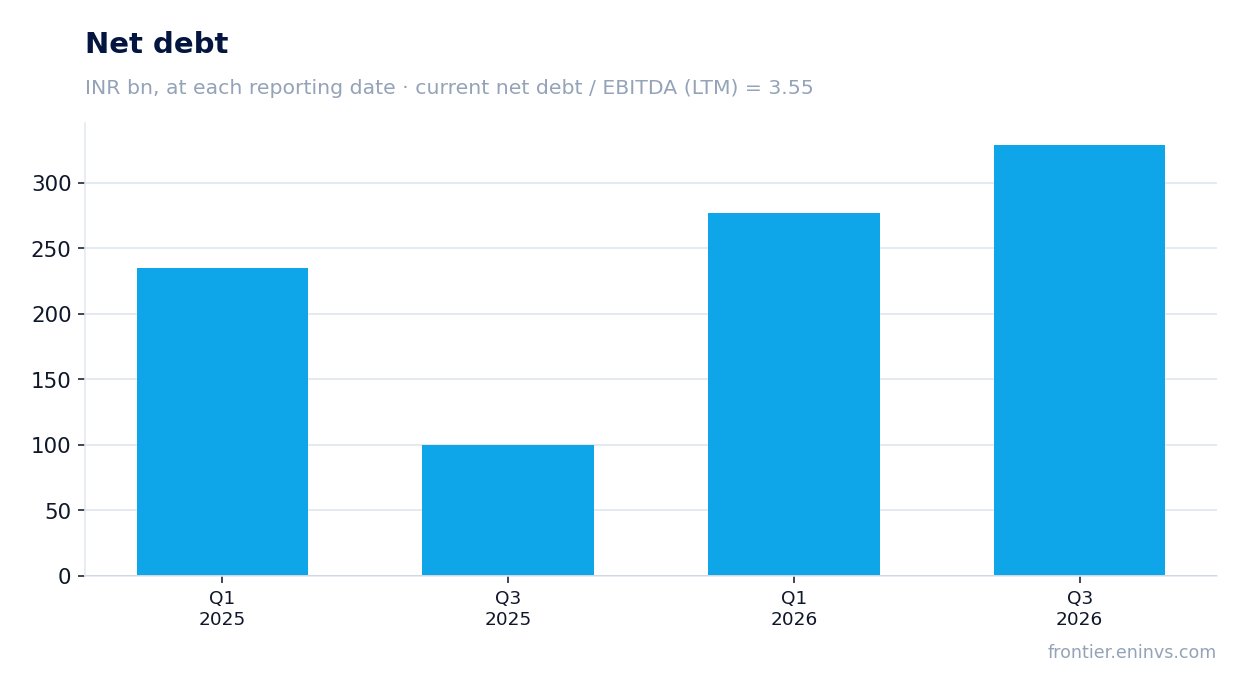
— Debt rose to 329.2 bn INR, with net debt/EBITDA LTM at 3.55
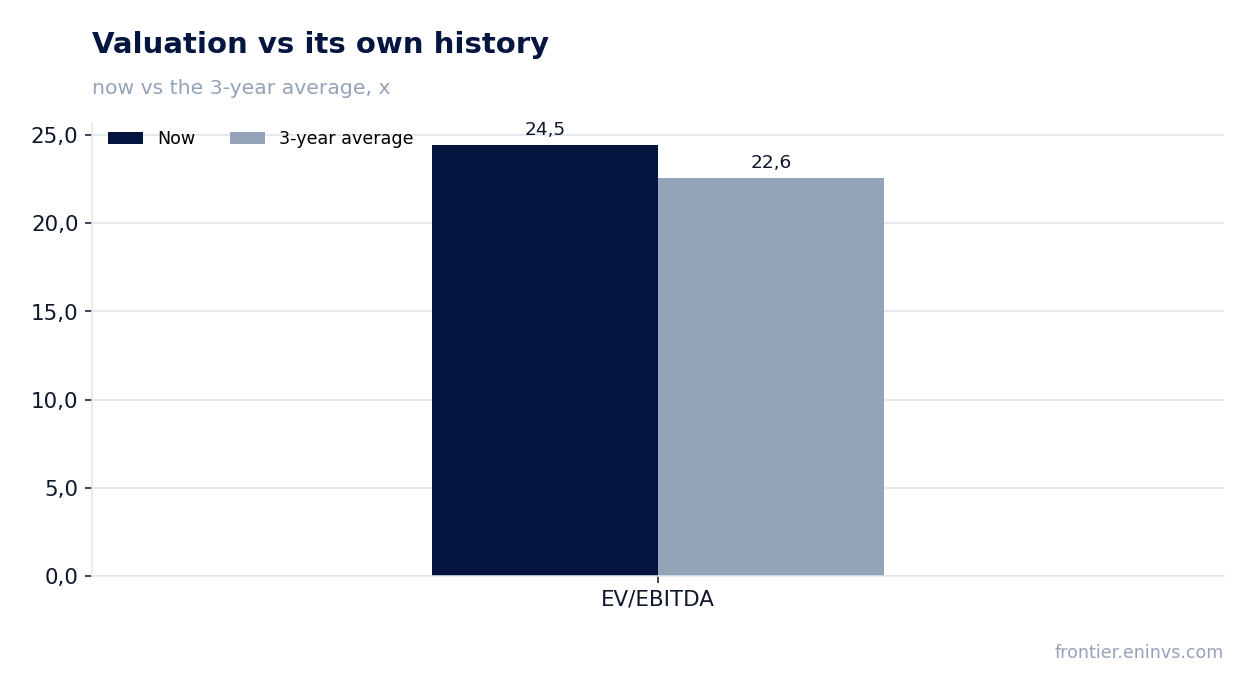
— EV/EBITDA LTM of 24.5 is above its own three-year average of 22.6 – the share is more expensive than its history
— Dividend yield is just 0.29%, below the key rate and not compensating for risk
— On the portal's model, upside to fair value is +8%
Attractiveness
Key figures, INR bn
| Metric | Q3 2025 | Q3 2026 | Change |
|---|---|---|---|
| Revenue | 140 | 195 | +38.7% |
| EBITDA | 20.9 | 28.2 | +35.1% |
| Operating profit | 17.9 | 23.7 | +32.4% |
| Net profit | 7.95 | 11.9 | +50.2% |
| EBITDA margin | 14.9% | 14.5% | -0.4 pp |
| Net margin | 5.7% | 6.1% | +0.4 pp |
Revenue rose 38.7% year on year, and growth accelerated versus the first quarter
In the third quarter of 2026, TVS Motor's revenue reached 194,744.4 mn INR, up 38.7% year on year. This is an acceleration from the first quarter, when growth was 33.5%. In the second quarter revenue was 162,955.2 mn INR, so the quarterly momentum is consistently strengthening.
The acceleration in revenue growth points to strong demand for the company's products. However, without segment and volume data from the report, it is impossible to say what made the main contribution – price or volume. Still, the very fact of acceleration against a broadly slowing market sets TVS Motor apart.
EBITDA grew 35.1%, but the margin fell to 14.5% from 14.9% a year earlier
EBITDA in the third quarter of 2026 was 28,190.3 mn INR, up 35.1% year on year. EBITDA growth lags revenue growth, which pushed the EBITDA margin down to 14.5% from 14.9% a year earlier. This means costs are rising faster than revenue.
The 0.4 percentage point margin decline is moderate, but it shows that the revenue acceleration comes at the cost of some pressure on expenses. Operating profit was 23,672.7 mn INR, and its dynamics will also depend on the company's ability to keep costs under control.
Net profit rose 50.2% – faster than EBITDA – lifting the margin to 6.1%
Net profit in the third quarter of 2026 reached 11,945.1 mn INR, up 50.2% year on year. Profit growth outpaces EBITDA growth, and the net margin rose to 6.1% from 5.7%. This points to a lower relative burden from interest expenses or taxes.
Faster net profit growth alongside a declining EBITDA margin may be explained by one-off factors, but their composition is not disclosed in the provided data. If profit grew due to non-operating items, the sustainability of such growth is questionable. Nevertheless, the absolute level of profit remains strong.
Debt rose to 329.2 bn INR, with net debt/EBITDA LTM at 3.55
Net debt as of 30 September 2026 was 329,181.4 mn INR. Since 31 March 2026 it has increased by 52.2 bn INR, and over 12 months by 229.2 bn INR. The net debt/EBITDA ratio for the trailing twelve months stands at 3.55, which is a high level.
The debt increase is partly explained by financing working capital and investments, but without cash flow data it is difficult to assess debt quality. High leverage limits financial flexibility and increases sensitivity to interest rates. At the same time, EBITDA over the last twelve months was 92,837.2 mn INR, which covers the debt, but only just.
EV/EBITDA LTM of 24.5 is above its own three-year average of 22.6 – the share is more expensive than its history
The EV/EBITDA multiple for the trailing twelve months is 24.5, which is 8% above its own three-year average of 22.6. This means the share is trading more expensively than usual over the past three years. For a company with growing revenue this is not unusual, but it creates a risk of correction if growth slows.
The P/E LTM stands at 52.1, which also points to a high valuation. At the same time, the dividend yield is only 0.29%, while ROE is 43.3%. The high return on equity partly justifies the premium, but the current price already reflects considerable optimism.
Dividend yield is just 0.29%, below the key rate and not compensating for risk
The dividend yield over the last twelve months is 0.29%. This is well below the key rate and holds little interest for income-oriented investors. The company prefers to direct profit into development rather than shareholder payouts.
With a payout ratio that can be assessed as low, the current dividend is not a supporting factor for the share price. If profit declines or debt rises, the dividend could be cut. For a shareholder, the main return must come from capital appreciation, not dividends.
On the portal's model, upside to fair value is +8%
According to the portal's fundamental model, which compares EBITDA growth with a target multiple and market capitalisation, the upside to fair value is estimated at +8%. This is a moderate potential that does not imply a significant advantage for the buyer.
The model takes into account current growth rates and valuation, but is not a market consensus or a target price. If revenue acceleration persists and the margin stabilises, the upside could increase. However, high leverage and the premium to its own history limit the room for growth.
Valuation on the latest reported figures
| Metric | Value |
|---|---|
| Market cap | 1 993 bn INR |
| P/E (LTM) | 52.1 |
| EV/EBITDA (LTM) | 24.5 |
| P/B | 20.84 |
| Net debt / EBITDA (LTM) | 3.55 |
| ROE | 43.3% |
| Dividend yield (12m) | 0.3% |
| EV/EBITDA, 3-year average | 22.6 |
Bottom line
The strong side of the report is the acceleration in revenue growth to 38.7% and a 50.2% rise in net profit. However, part of this growth may be tied to one-off factors, and the EBITDA margin declined. Leverage remains high, and the valuation is above its own history. The question for a holder now is whether the company can sustain growth and improve margins to justify the current price. Verdict – neutral.
Open the company's financial profile TVSMOTOR →
See also: market overview · valuation map · stock screeners