UltraTech Cement: revenue up 18.8% but margin compressed to 16.4% – profit barely moves
On 25 October UltraTech Cement reported results for the third quarter of 2026. Revenue rose 18.8% year on year to 232.9 bn INR, net profit added 21.3% to 14.9 bn INR, but the EBITDA margin came in at 16.4% against minus 0.2% a year earlier – the margin recovery is incomplete and profit remains below the levels of the first half. At the current price the stock trades at EV/EBITDA of 19.4 – below its own three-year average of 24.8 – and the portal's model puts upside to fair value at +12%; with a dividend yield of 2.1% and leverage of 1.58 EBITDA, the share looks rather attractive, but the fragility of the margin keeps us from a higher rating.
Key takeaways
— Revenue rose 18.8% year on year, and quarterly momentum accelerated: +18.8% after +15.9% in the first quarter of 2026
— EBITDA margin of 16.4% against minus 0.2% a year earlier – a recovery, but still far from first-half levels
— Net profit of 14.9 bn INR added 21.3% year on year, but fell almost by half quarter on quarter
— Net debt rose from 135.0 bn INR on 30 September 2025 to 282.7 bn on 30 September 2026 (+147.6 bn)
— Dividend yield of 2.1% with a payout ratio that leaves room for manoeuvre
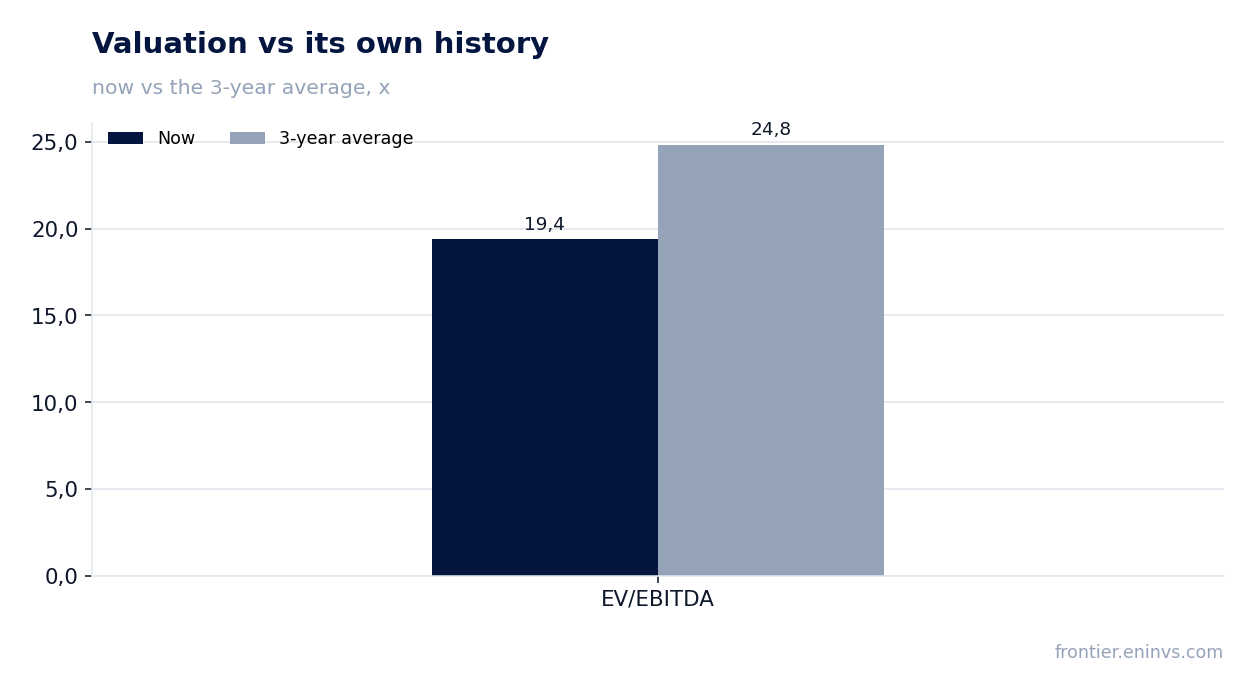
— EV/EBITDA of 19.4 is below its own three-year average of 24.8 – the stock is cheaper than its history
— The portal's model implies +12% upside to fair value, but it hinges on EBITDA recovery
Attractiveness
Key figures, INR bn
| Metric | Q3 2025 | Q3 2026 | Change |
|---|---|---|---|
| Revenue | 196 | 233 | +18.8% |
| EBITDA | -0.36 | 38.2 | to profit |
| Operating profit | 19.5 | 25.1 | +28.8% |
| Net profit | 12.3 | 14.9 | +21.3% |
| EBITDA margin | -0.2% | 16.4% | +16.6 pp |
| Net margin | 6.3% | 6.4% | +0.1 pp |
Revenue rose 18.8% year on year, and quarterly momentum accelerated: +18.8% after +15.9% in the first quarter of 2026
Revenue for the third quarter of 2026 came in at 232.9 bn INR, 18.8% above the same quarter a year earlier. This is noticeably below the peak levels of the first half: growth was 15.9% in the first quarter of 2026 and 18.8% in the second, and the current quarter is at least on par with the second.
Quarterly momentum accelerated relative to the first quarter of 2026: +18.8% versus +15.9%. This means demand for cement remains robust and the company continues to grow volumes. However, the absolute revenue level declined relative to the second quarter of 2026 (246.5 bn INR), which is typical of the seasonal slowdown in the construction season.
Year-on-year growth has remained in double digits for three consecutive quarters, confirming the recovery in demand after a weak third quarter of 2025, when revenue was 196.1 bn INR. The acceleration in the second quarter of 2026 relative to the first sets a positive momentum, but the sustainability of this trend will depend on government infrastructure spending and private construction.
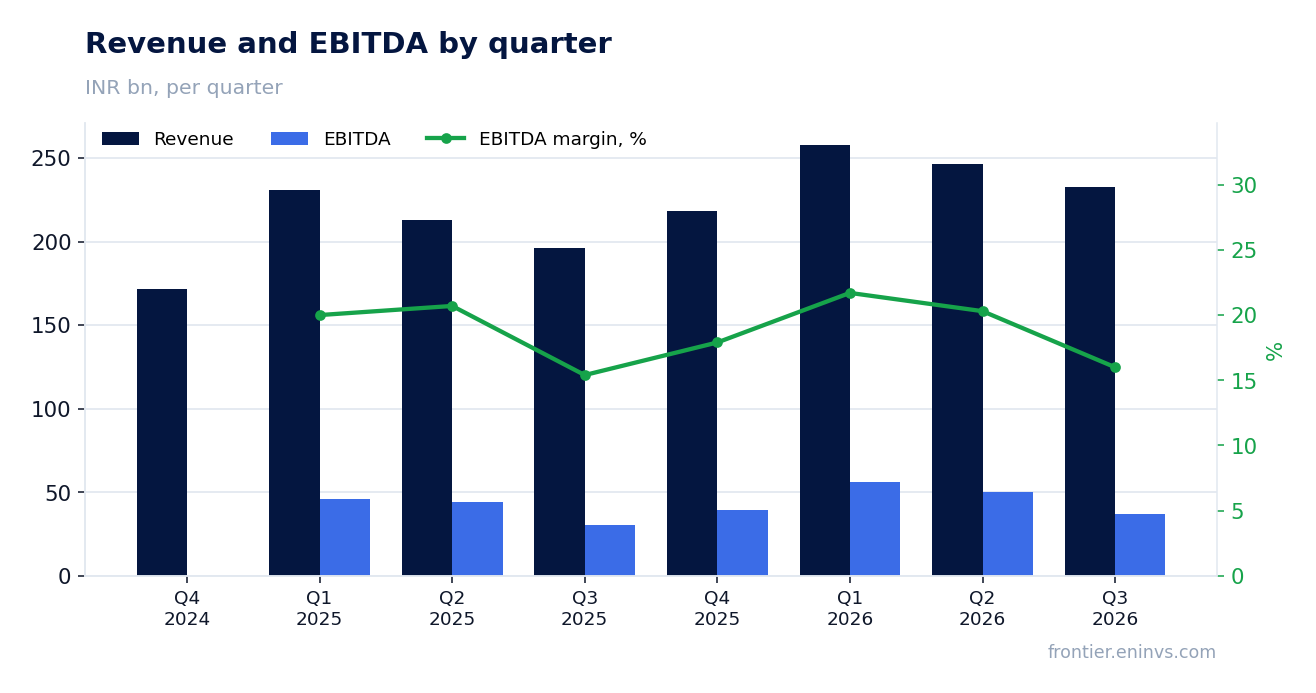
EBITDA margin of 16.4% against minus 0.2% a year earlier – a recovery, but still far from first-half levels
EBITDA for the third quarter of 2026 was 37.2 bn INR, with a margin of 16.4%. A year earlier the margin was negative (-0.2%), reflecting an extremely weak base. The recovery to positive territory is an important signal, but the current level is well below the first quarter of 2026 (21.7%) and the second quarter (20.3%).
The margin compression relative to the first half is driven by rising costs: operating profit was 25.1 bn INR, below the levels of previous quarters. The company does not disclose a cost breakdown, but the dynamics point to pressure on the cost base – likely from higher energy and logistics prices.
For investors the key question is whether the margin can hold above 16%. If it returns to 18–20% next quarter, that would confirm a recovery in operating efficiency. For now the margin remains under pressure, and this is the main risk to profit.
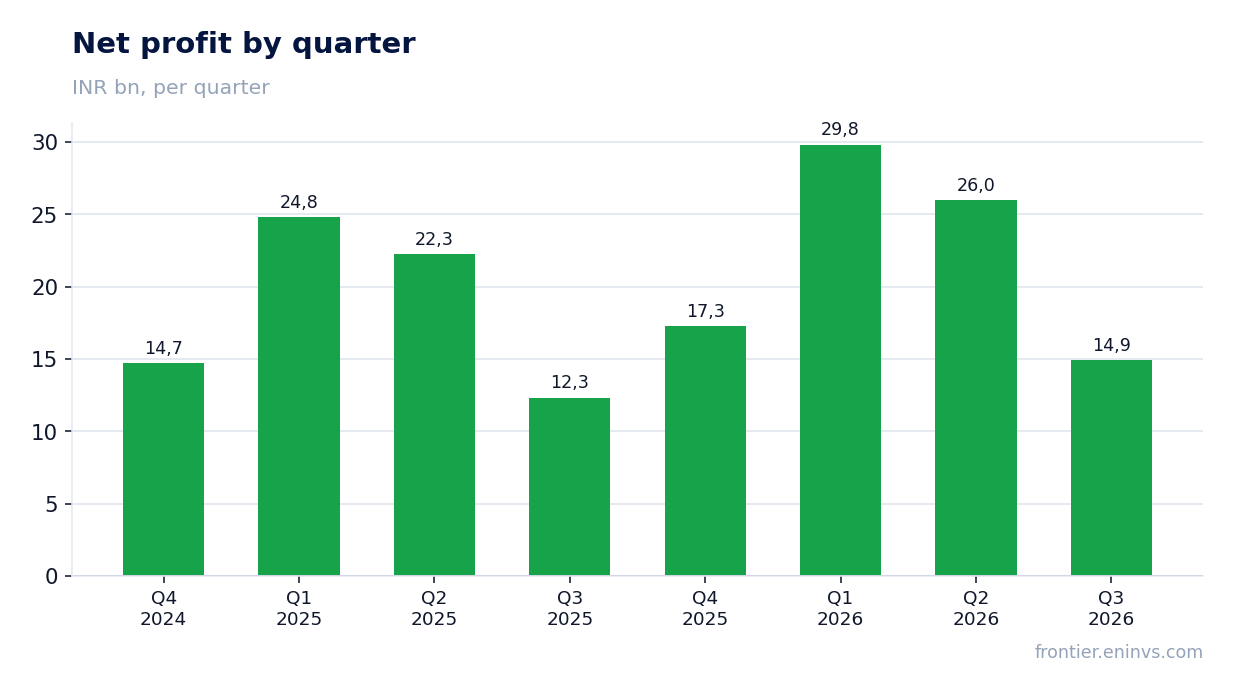
Net profit of 14.9 bn INR added 21.3% year on year, but fell almost by half quarter on quarter
Net profit for the third quarter of 2026 was 14.9 bn INR, 21.3% above the same quarter a year earlier (12.3 bn INR). The profit growth despite margin compression is explained by the low base of the prior year, when the company posted an EBITDA-level loss.
The sequential dynamics are worse, however: net profit was 26.0 bn INR in the second quarter of 2026 and 29.8 bn in the first. The near-halving quarter on quarter reflects both the seasonal slowdown and margin compression. The net margin was 6.4% against 6.3% a year earlier – a slight improvement, but it does not offset the fall in the absolute figure.
Profit over the trailing twelve months (LTM) was 88.0 bn INR. This level matters for the dividend base and multiples, but it should not be mixed with quarterly growth rates.
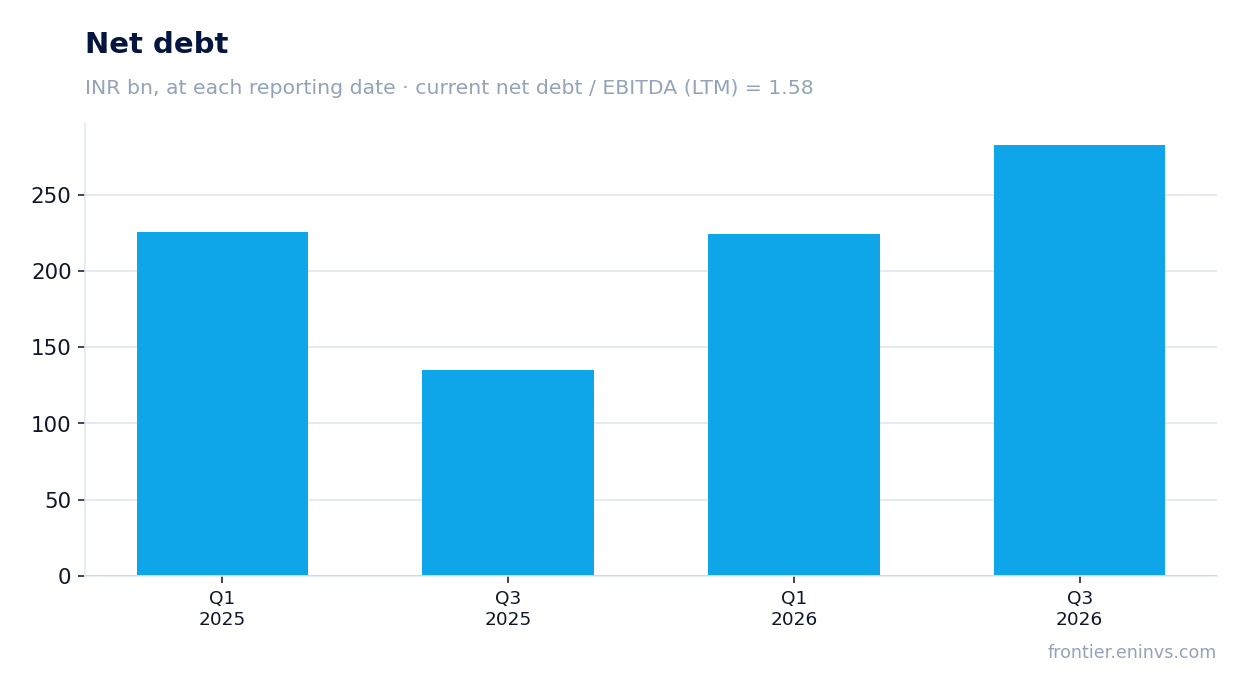
Net debt rose from 135.0 bn INR on 30 September 2025 to 282.7 bn on 30 September 2026 (+147.6 bn)
Net debt as of 30 September 2026 was 282.7 bn INR against 135.0 bn on 30 September 2025 – an increase of 147.6 bn over the year. Relative to 31 March 2026 (224.3 bn), debt rose by 58.4 bn. This is a substantial increase that requires explanation: the company does not disclose the sources, but the rise may be linked to financing capital expenditure.
The net debt to LTM EBITDA ratio is 1.58 – a level that remains moderate for the cement industry but warrants monitoring. Importantly, this is a level, not a direction: we do not have an earlier value for this ratio, so we cannot say whether leverage rose or fell.
Debt servicing is not yet a critical burden: LTM EBITDA of 179.0 bn INR covers interest payments. However, further debt growth without a corresponding rise in EBITDA could pressure the rating and the cost of financing.
Dividend yield of 2.1% with a payout ratio that leaves room for manoeuvre
The dividend yield over the trailing twelve months is 2.1%. The company does not disclose the size of the last dividend paid or the year for which it was paid in the provided facts, so we cannot name a specific amount. However, the yield is lower than one might expect from a company with LTM profit of 88.0 bn INR and a market capitalisation of 3,245.9 bn INR.
Our estimate for the current year's dividend is based on the payout ratio the company has historically maintained. With LTM profit of 88.0 bn INR and a conservative payout ratio of 20–30%, the dividend could be 17.6–26.4 bn INR, which at the current market capitalisation implies a yield of 0.5–0.8%. This is below the current yield of 2.1%, suggesting a possible reduction in payouts if profit does not recover.
A yield of 2.1% is below the key rate, making the stock less attractive to income investors. However, if the company maintains the current payout level, the yield could remain above 2%. The main risk is a decline in profit due to margin compression, which could lead to a dividend cut.
EV/EBITDA of 19.4 is below its own three-year average of 24.8 – the stock is cheaper than its history
The EV/EBITDA LTM multiple is 19.4, 22% below its own three-year average of 24.8. This means the stock trades cheaper than its average over the past three years. The P/E LTM is 36.9 – a high level, reflecting low LTM profit relative to market capitalisation.
The decline in the multiple relative to history may be due to both falling profit and rising debt, which increases EV. The 147.6 bn INR increase in net debt over the year raises EV and hence the multiple, but even so EV/EBITDA is below its historical average.
For investors this creates an opportunity: if EBITDA recovers, the multiple could return to historical levels, providing upside. However, if the margin remains under pressure, the discount to history may persist.
The portal's model implies +12% upside to fair value, but it hinges on EBITDA recovery
According to the portal's model, which values the company through EBITDA growth and a target multiple, the upside to fair value is +12%. This is the portal's own estimate, not a market consensus or a target price. The model assumes EBITDA grows from the current LTM level of 179.0 bn INR while the multiple remains below its historical average.
The +12% upside looks moderate but is sensitive to assumptions about margin recovery. If EBITDA grows 10–15% next year, this could lead to an upward revision of the valuation. If the margin stays at 16.4%, the upside may be smaller.
For investors it is important that the portal's model is not a guarantee of returns but a reference point. It confirms that the stock is not overvalued relative to its historical multiples, but it does not rule out further downside.
Valuation on the latest reported figures
| Metric | Value |
|---|---|
| Market cap | 3 246 bn INR |
| P/E (LTM) | 36.9 |
| EV/EBITDA (LTM) | 19.4 |
| P/B | 4.24 |
| Net debt / EBITDA (LTM) | 1.58 |
| ROE | 7.7% |
| Dividend yield (12m) | 2.1% |
| EV/EBITDA, 3-year average | 24.8 |
Bottom line
Bottom line: UltraTech Cement delivered double-digit revenue growth (+18.8% year on year) and a margin recovery from a negative base, but the margin remains below first-half levels and profit nearly halved quarter on quarter. Net debt rose to 282.7 bn INR, increasing EV and weighing on valuation. The stock trades at EV/EBITDA of 19.4 – below its own three-year average of 24.8 – and the portal's model implies +12% upside. With a dividend yield of 2.1% and moderate leverage of 1.58 EBITDA, the share looks rather attractive, but the fragility of the margin is the main risk that could change the verdict.
Open the company's financial profile ULTRACEMCO →
See also: market overview · valuation map · stock screeners