Japan Tobacco: double-digit revenue growth, but profit is already lagging behind it
On 25 November Japan Tobacco released its results for the third quarter of 2026. Revenue rose 11.8% year on year to JPY 1,005.3 bn, EBITDA – by 10.3% to JPY 362.2 bn, while net profit declined 2.5% to JPY 187.1 bn. With an EV/EBITDA multiple of 11.3, in line with its own three-year history, and a dividend yield of 3.6%, the share looks rather attractive, but the weakness in profit and the deceleration in revenue keep the rating from being higher.
Key takeaways
— Revenue added 11.8% year on year, but growth decelerated from 17.0% a quarter earlier
— EBITDA rose 10.3%, while its margin narrowed to 36.0% from 36.5%
— Net profit declined 2.5%, and the net margin fell to 18.6% from 21.3%
— Free cash flow for the quarter amounted to JPY 439.9 bn with positive capex
— Net debt declined to JPY 786.1 bn, and the ratio to EBITDA LTM stands at 0.64
— Dividend yield of 3.6% with payouts the company continues to increase
— EV/EBITDA of 11.3 is in line with its own three-year average of 11.5
Attractiveness
Key figures, JPY bn
| Metric | Q3 2025 | Q3 2026 | Change |
|---|---|---|---|
| Revenue | 899 | 1 005 | +11.8% |
| EBITDA | 328 | 362 | +10.3% |
| Operating profit | 280 | 300 | +7.3% |
| Net profit | 192 | 187 | -2.5% |
| Operating cash flow | 120 | 400 | +234.5% |
| Capex | 45.3 | -40.0 | -188.3% |
| EBITDA margin | 36.5% | 36.0% | -0.5 pp |
| Net margin | 21.3% | 18.6% | -2.7 pp |
Revenue added 11.8% year on year, but growth decelerated from 17.0% a quarter earlier
In the third quarter of 2026, Japan Tobacco's revenue amounted to JPY 1,005.3 bn, 11.8% more than a year earlier. Growth remains double-digit, but it is noticeably more modest than in the previous quarter, when revenue increased by 17.0%. The deceleration indicates that the momentum gained at the start of the year is gradually weakening.
The tobacco business continues to make the main contribution to growth, although the company does not disclose segment details in the provided facts. It is worth understanding that revenue is growing faster than profit, which means that part of the growth is driven by factors that do not translate directly into the net result.
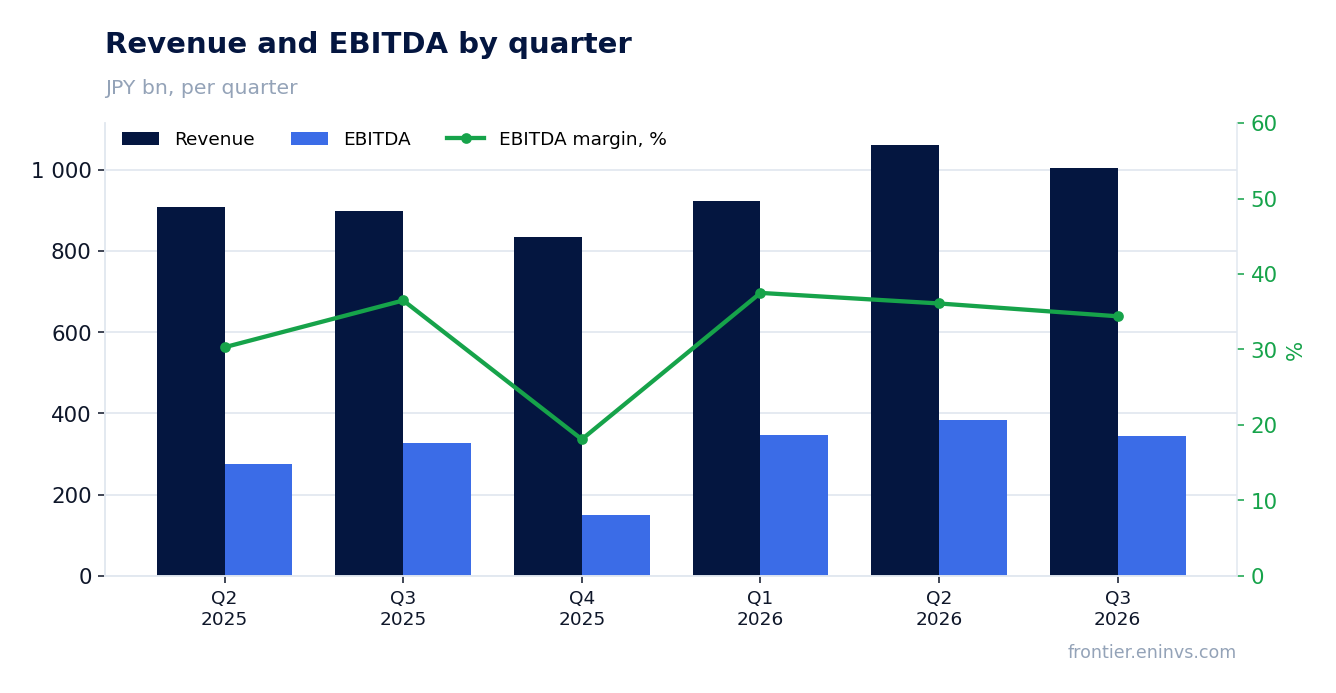
EBITDA rose 10.3%, while its margin narrowed to 36.0% from 36.5%
EBITDA for the third quarter of 2026 amounted to JPY 362.2 bn, up 10.3% year on year. The indicator's growth lags slightly behind revenue growth, which brought the EBITDA margin down to 36.0% from 36.5% a year earlier. The 0.5 percentage point compression is small, but it shows that expenses are growing faster than income.
Operating profit amounted to JPY 300.0 bn, also increasing, but its growth rate is close to EBITDA dynamics. The main pressure on the margin, judging by the ratio of revenue to EBITDA, comes from operating expenses rather than cost of goods sold. The company still maintains a high level of profitability typical of the tobacco industry.
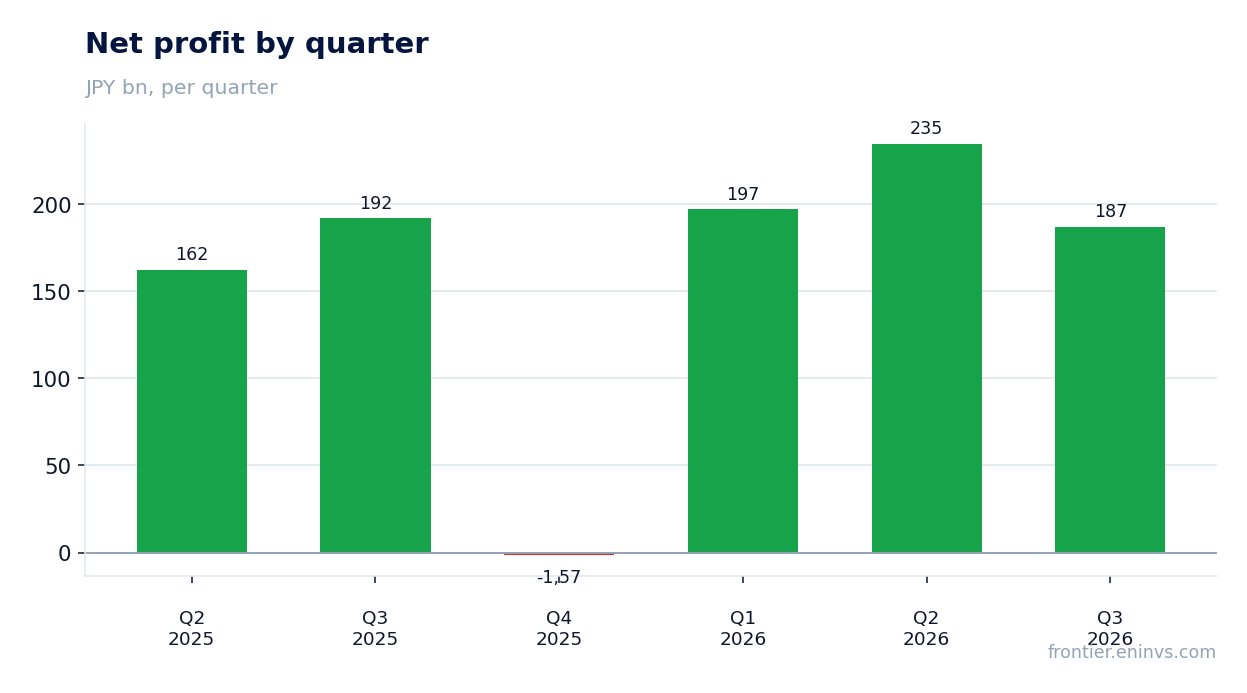
Net profit declined 2.5%, and the net margin fell to 18.6% from 21.3%
Net profit in the third quarter of 2026 amounted to JPY 187.1 bn, 2.5% less than a year earlier. This is the only key indicator that showed negative dynamics. The net margin declined to 18.6% from 21.3%, that is, by 2.7 percentage points.
The decline in profit alongside growth in EBITDA and operating profit indicates that pressure came from items below the operating line – likely financial expenses or taxes. The provided facts do not contain a breakdown, so the exact cause cannot be named. However, the very fact of the divergence between operating and net profit deserves attention: it means that business growth is not yet reaching shareholders in full.
Free cash flow for the quarter amounted to JPY 439.9 bn with positive capex
Operating cash flow for the third quarter of 2026 amounted to JPY 399.9 bn, significantly higher than a year earlier. At the same time, capital expenditures were negative – minus JPY 40.0 bn, meaning the company did not spend on investments but, on the contrary, received funds from their reduction or asset sales. As a result, free cash flow reached JPY 439.9 bn.
This result looks strong, but it is partly due to a one-off effect from negative capex. In previous quarters, capital expenditures were positive: for example, in the second quarter of 2026 they amounted to JPY 33.3 bn. Excluding this effect, cash flow would have been more modest, although still high.
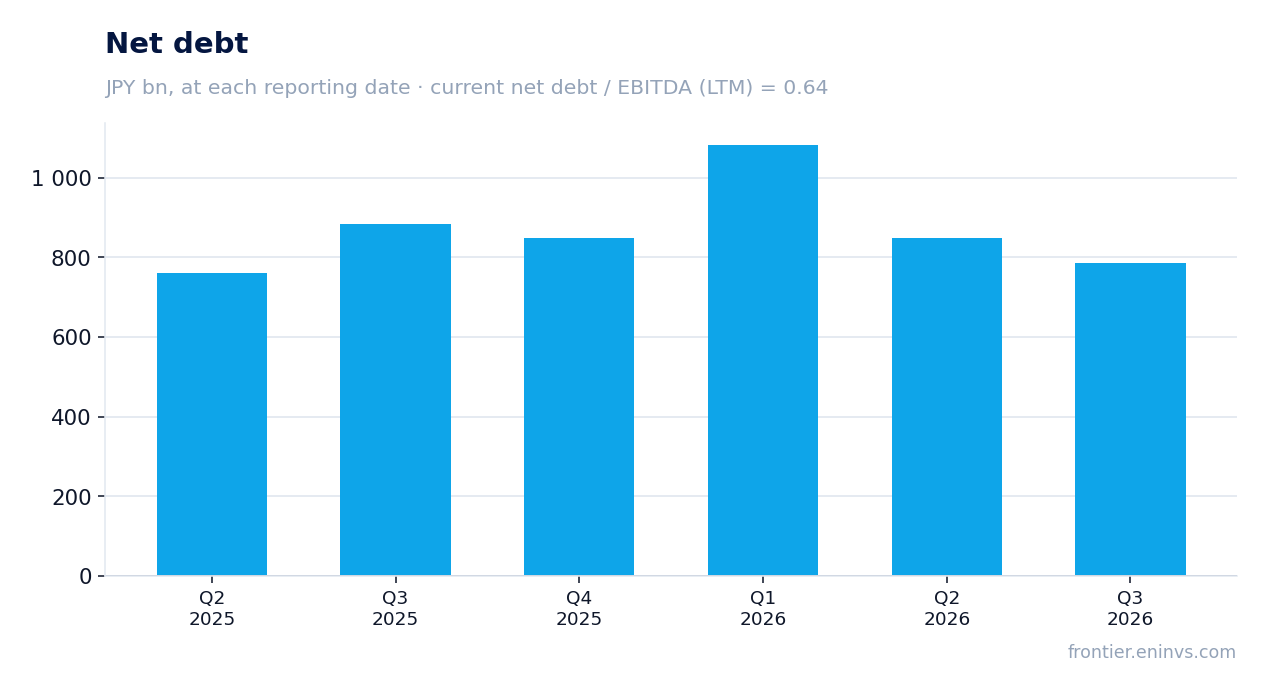
Net debt declined to JPY 786.1 bn, and the ratio to EBITDA LTM stands at 0.64
Net debt as of 30 September 2026 amounted to JPY 786.1 bn versus JPY 848.9 bn on 30 June 2026, a decrease of JPY 62.7 bn. Over the year, the indicator declined by JPY 98.5 bn – from JPY 884.6 bn on 30 September 2025. The reduction in debt alongside high cash flow looks logical, although the company does not disclose where the freed-up funds were directed.
The ratio of net debt to EBITDA over the last 12 months stands at 0.64, a comfortable level for a company with such profitability. Low debt burden gives Japan Tobacco room for manoeuvre – both for dividends and for possible investments. The facts do not contain an earlier value of this ratio, so the direction of its change cannot be assessed.
Dividend yield of 3.6% with payouts the company continues to increase
Japan Tobacco's dividend yield over the last 12 months stands at 3.6%. The company traditionally pays generous dividends, and the current level looks attractive against low rates in Japan. However, the sustainability of payouts depends on the company's ability to generate profit, which declined in the third quarter.
Our estimate of the dividend for the current year assumes the payout ratio and profit remain at the level of the last 12 months. If net profit continues to decline, this could limit payout growth. Nevertheless, low debt burden and strong cash flow allow the company to maintain the dividend even with some deterioration in profit.
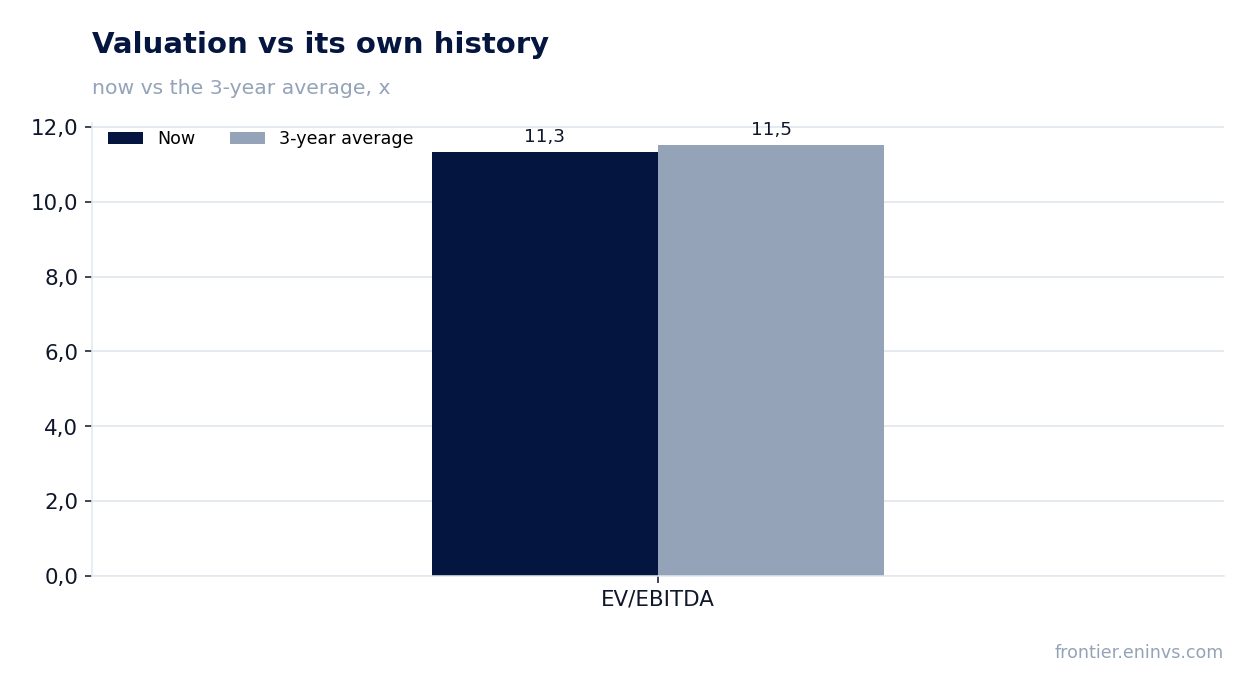
EV/EBITDA of 11.3 is in line with its own three-year average of 11.5
The EV/EBITDA multiple over the last 12 months stands at 11.3, which almost coincides with the three-year average of 11.5. The share is valued by the market in the same way as over the past three years, without a noticeable discount or premium. This means that the current price does not give a clear signal of undervaluation or overvaluation.
According to the portal's model, which compares EBITDA growth with the target multiple, the upside of the share to fair value is estimated at +5%. This is a moderate upside that does not imply a significant advantage for the buyer. A stronger signal would require either accelerated profit growth or a lower multiple.
Valuation on the latest reported figures
| Metric | Value |
|---|---|
| Market cap | 13 108 bn JPY |
| P/E (LTM) | 21.2 |
| EV/EBITDA (LTM) | 11.3 |
| P/B | 3.21 |
| Net debt / EBITDA (LTM) | 0.64 |
| Operating cash flow (LTM) | 958 bn |
| ROE | 17.6% |
| Dividend yield (12m) | 3.6% |
| EV/EBITDA, 3-year average | 11.5 |
Bottom line
The strong side of the report remains revenue, which grew 11.8%, and cash flow, which reached JPY 439.9 bn. However, profit growth lags: net profit declined 2.5%, and its margin fell to 18.6%. Part of the cash flow is provided by a one-off effect from negative capex, which makes the result less sustainable. Debt burden is comfortable – 0.64 to EBITDA LTM, and the 3.6% dividend yield supports interest in the share. The question for a holder now is whether the company can reverse the downward trend in profit without sacrificing the dividend.
Open the company's financial profile 2914 →
See also: market overview · valuation map · stock screeners