United Microelectronics: revenue accelerated to +25.6%, but profit grew only 9.7%
On November 25, United Microelectronics reported results for the third quarter of 2026. Revenue reached TWD 74,239.1 million, up 25.6% year on year, EBITDA was TWD 35,269.3 million (+42.2%), and net profit was TWD 16,433.9 million (+9.7%). Revenue growth accelerated from 17.0% in the second quarter to 25.6% in the third, but the net margin declined from 25.3% to 22.1%. At the current price the share looks neutral: the EV/EBITDA multiple of 10.8x is almost double its own three-year average, limiting upside despite strong operating momentum and a net cash position.
Key takeaways
— Revenue grew 25.6% year on year, and the pace accelerated from 17.0% a quarter earlier
— EBITDA rose 42.2%, and its margin climbed to 49.8% from 44.0% a year earlier
— Net profit grew only 9.7%, and the margin fell to 22.1% from 25.3%
— The company sits on a net cash cushion of TWD 78.4 billion, with negative debt load
— Operating cash flow for the quarter was TWD 30.0 billion, but capital expenditure absorbed TWD 12.0 billion
— The dividend yield of 2.3% is modest, and payouts depend on profit, which is growing slower than revenue
— EV/EBITDA at 10.8x is 87% above its own three-year average of 5.7x
Attractiveness
Key figures, TWD bn
| Metric | Q3 2025 | Q3 2026 | Change |
|---|---|---|---|
| Revenue | 59.1 | 74.2 | +25.6% |
| EBITDA | 26.0 | 37.0 | +42.2% |
| Operating profit | 11.0 | 18.6 | +68.8% |
| Net profit | 15.0 | 16.4 | +9.7% |
| Operating cash flow | 20.9 | 30.0 | +43.4% |
| Capex | 12.2 | -12.0 | -199.0% |
| EBITDA margin | 44.0% | 49.8% | +5.8 pp |
| Net margin | 25.3% | 22.1% | -3.2 pp |
Revenue grew 25.6% year on year, and the pace accelerated from 17.0% a quarter earlier
Revenue for the third quarter of 2026 was TWD 74,239.1 million, up 25.6% year on year. This is an acceleration from 17.0% growth in the second quarter and 5.5% in the first. The company is scaling up consistently: quarterly revenue rose from TWD 61,037.9 million in the first quarter to 68,732.7 million in the second and 74,239.1 million in the third.
The acceleration indicates a recovery in demand for products. However, the facts do not provide a breakdown by segment or business line, so it is impossible to say which segment made the main contribution. One can only state that revenue is growing faster than in previous periods.
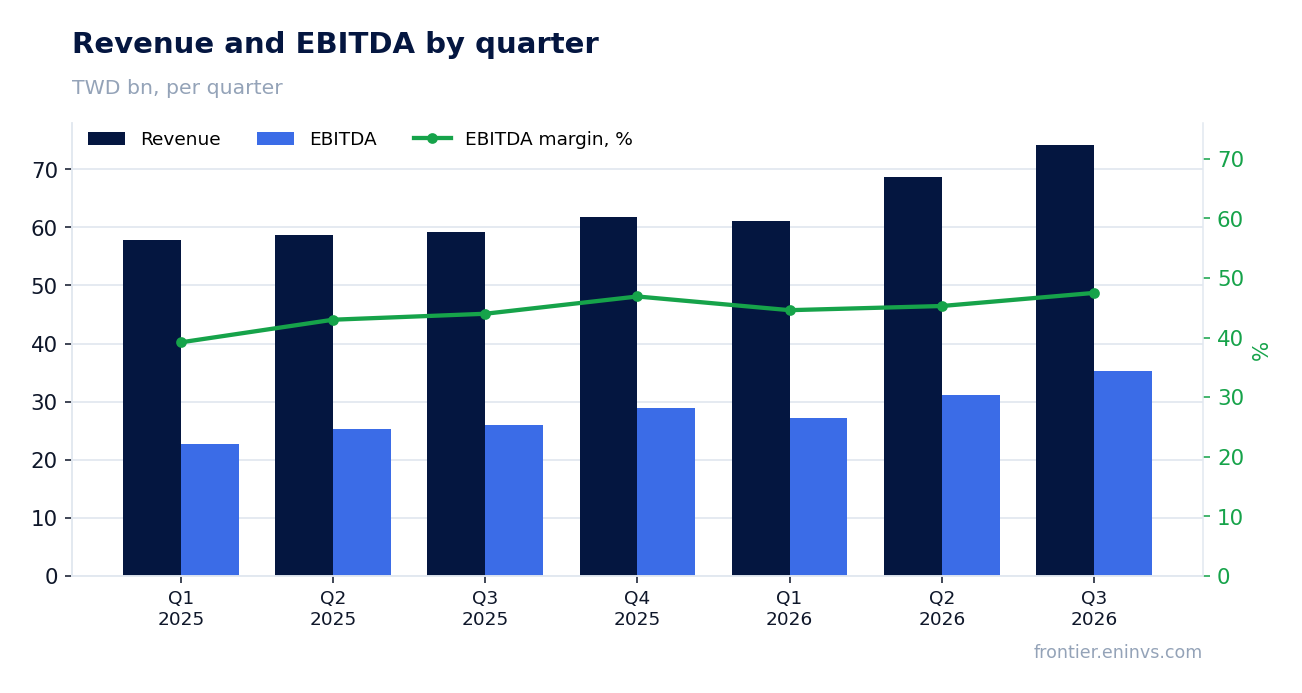
EBITDA rose 42.2%, and its margin climbed to 49.8% from 44.0% a year earlier
EBITDA for the third quarter of 2026 was TWD 35,269.3 million, up 42.2% year on year. EBITDA growth outpaced revenue growth, expanding the margin to 49.8% from 44.0% in the third quarter of 2025. This means the company is not only growing revenue but also improving efficiency.
Operating profit was TWD 18,577.1 million. The gap between EBITDA and operating profit is depreciation, which remains significant. The margin expansion may be due to better capacity utilisation or lower unit costs, but the facts do not provide a breakdown of expense items.
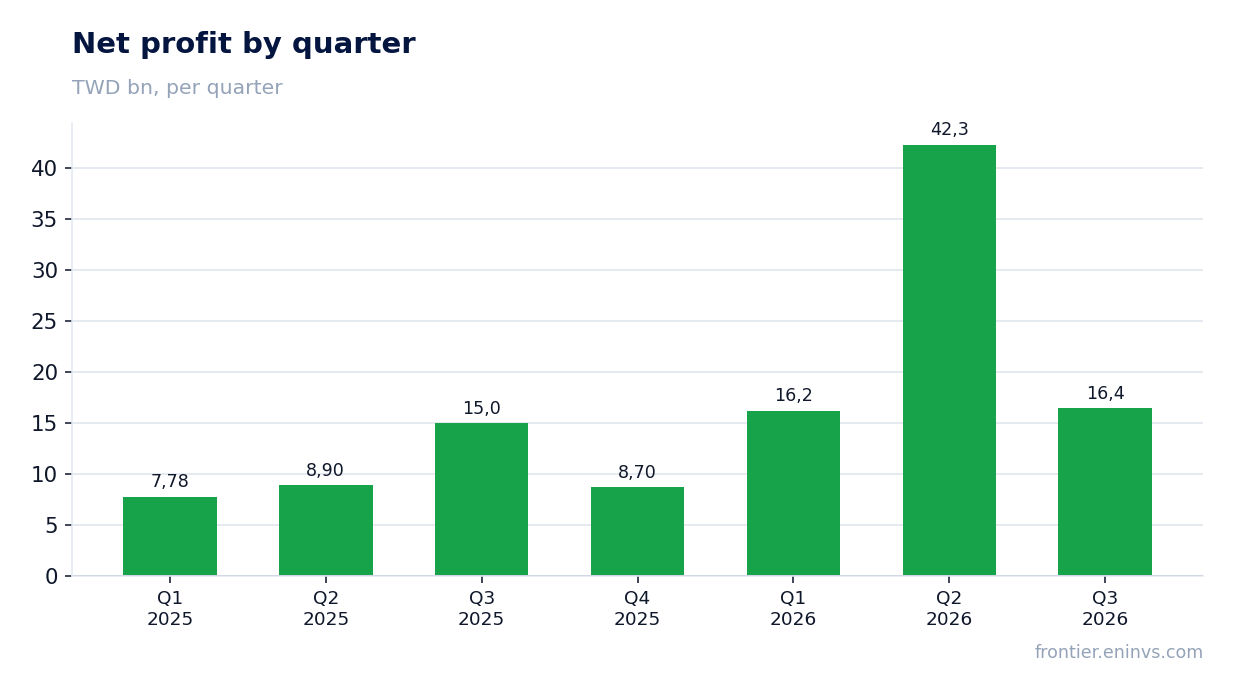
Net profit grew only 9.7%, and the margin fell to 22.1% from 25.3%
Net profit for the third quarter of 2026 was TWD 16,433.9 million, up 9.7% year on year. This is significantly slower than revenue and EBITDA growth. As a result, the net margin declined to 22.1% from 25.3% in the third quarter of 2025.
The gap between EBITDA and net profit growth may be explained by several factors, but the facts do not provide data on interest expenses, taxes, or one-off items. In the second quarter of 2026, net profit was TWD 42,260.0 million, significantly higher than in the third quarter – possibly there was a one-off gain, but there is no confirmation in the facts. The margin decline is the key negative of the report.
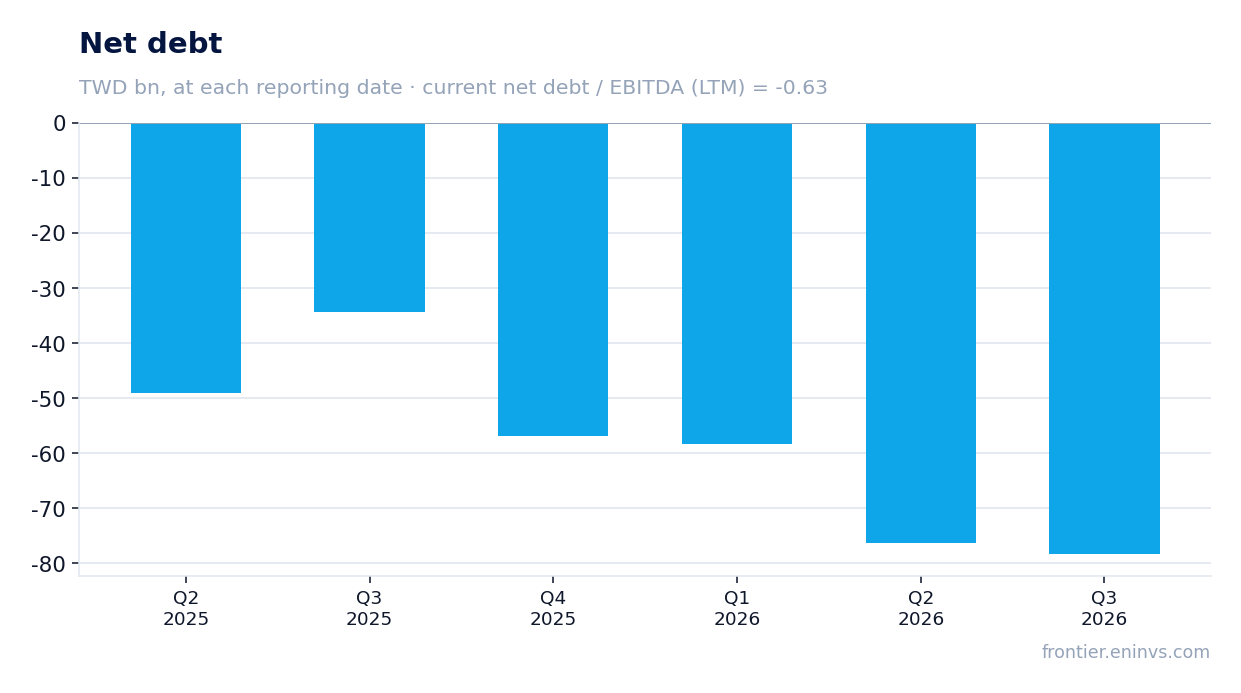
The company sits on a net cash cushion of TWD 78.4 billion, with negative debt load
Net debt as of September 30, 2026, was minus TWD 78,356.4 million, meaning the company has a net cash position. This means cash and equivalents exceed debt obligations. The net debt / EBITDA LTM ratio is minus 0.63, confirming the absence of debt load.
During the quarter, net debt changed from minus TWD 76,333.8 million on June 30, 2026, to minus TWD 78,356.4 million on September 30, 2026, meaning the cash cushion grew by TWD 2.0 billion. Over the year the change is more substantial: from minus TWD 34,399.6 million on September 30, 2025, to minus TWD 78,356.4 million on September 30, 2026, an increase of TWD 44.0 billion. This is a strong side of the balance sheet that gives the company resilience.
Operating cash flow for the quarter was TWD 30.0 billion, but capital expenditure absorbed TWD 12.0 billion
Operating cash flow for the third quarter of 2026 was TWD 30,015.5 million. This is lower than in the second quarter (TWD 33,697.4 million) but higher than in the first (TWD 21,981.3 million). The company generates stable cash flow that covers capital expenditure.
Capital expenditure for the quarter was TWD 12,049.7 million. Free cash flow therefore remains positive at around TWD 18.0 billion. Over the last 12 months, operating cash flow was TWD 118,697.1 million, significantly exceeding capital expenditure. This allows the company to fund dividends and maintain a net cash position.
The dividend yield of 2.3% is modest, and payouts depend on profit, which is growing slower than revenue
The dividend yield over the last 12 months is 2.3%. This is a modest level that does not compensate for the risk of profit decline. Dividend payouts depend on net profit, which grew only 9.7% year on year in the third quarter, while revenue grew 25.6%.
If profit grows slower than revenue due to margin pressure, dividend payouts could be at risk. The facts do not provide data on dividend policy or payout ratio, so it is impossible to assess dividend sustainability. However, the current yield of 2.3% is lower than one might expect from a company with a net cash position and stable cash flow.
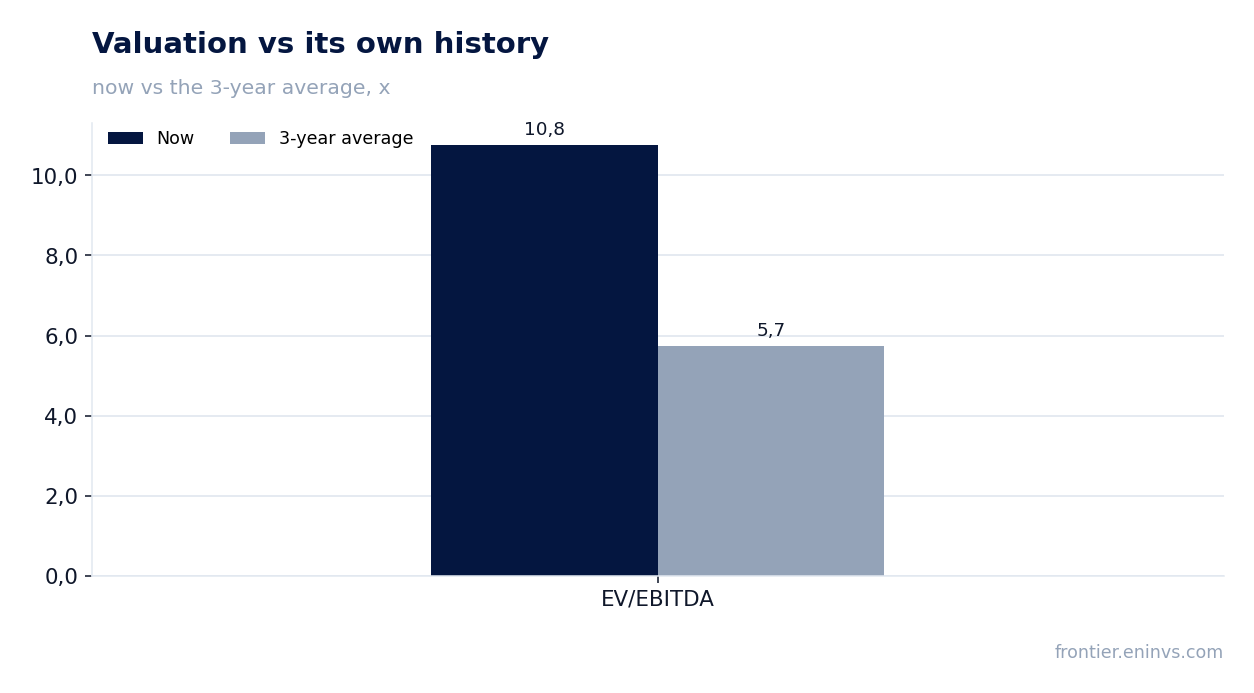
EV/EBITDA at 10.8x is 87% above its own three-year average of 5.7x
The EV/EBITDA LTM multiple is 10.8x. This is 87% above its own three-year average of 5.7x. The share trades significantly more expensive than historically. P/E LTM is 16.7x, also indicating a premium valuation.
Market capitalisation is TWD 1,398,159.7 million. With a net cash position of TWD 78.4 billion, enterprise value (EV) is below market capitalisation. However, even accounting for this, the multiple remains high relative to history. On the portal's model, the fair value of the share implies 22% upside. This is our own model calculation, not a market consensus.
Valuation on the latest reported figures
| Metric | Value |
|---|---|
| Market cap | 1 398 bn TWD |
| P/E (LTM) | 16.7 |
| EV/EBITDA (LTM) | 10.8 |
| P/B | 3.82 |
| Net debt / EBITDA (LTM) | -0.63 |
| Operating cash flow (LTM) | 119 bn |
| ROE | 14.4% |
| Dividend yield (12m) | 2.3% |
| EV/EBITDA, 3-year average | 5.7 |
Bottom line
The strong side of the report is the acceleration of revenue growth to 25.6% and the expansion of EBITDA margin to 49.8%. However, net profit grew only 9.7%, and the margin declined to 22.1%, indicating pressure on profitability. The company has a net cash position of TWD 78.4 billion and stable cash flow, but the dividend yield of 2.3% is modest. The key question for a holder is whether the company can sustain profit growth at the high EV/EBITDA multiple of 10.8x, which is almost double its historical average. The verdict is neutral: operating momentum is strong, but valuation limits upside.
Open the company's financial profile 2303 →
See also: market overview · valuation map · stock screeners