TSMC: revenue accelerated to +50.9%, but EBITDA margin fell from 67.0% to 58.7%
TSMC reported results for the third quarter of 2026. Revenue reached TWD 1,494.2bn, up 50.9% year on year, net profit came to TWD 763.1bn (+68.7%), and EBITDA was TWD 876.4bn (+32.1%). Revenue growth accelerated from +36.0% in the second quarter, but the EBITDA margin fell to 58.7% from 67.0% a year earlier. At an EV/EBITDA of 17.6 against its own three-year average of 14.0 the share is more expensive than its history, so at the current price it is rather attractive than not, but without room for error.
Key takeaways
— Revenue grew 50.9% year on year, and the pace accelerated from 36.0% in the second quarter
— Net profit added 68.7%, outpacing revenue on a margin rise to 51.1%
— EBITDA grew only 32.1% because its margin fell from 67.0% to 58.7%
— Leverage is negative: net debt to LTM EBITDA stands at -0.51
— A dividend yield of 1.0% is modest against ROE of 45.9% and a price above its history
— EV/EBITDA of 17.6 is 26% above its own three-year average of 14.0
— The portal model puts upside to fair value at +17%
Attractiveness
Key figures, TWD bn
| Metric | Q3 2025 | Q3 2026 | Change |
|---|---|---|---|
| Revenue | 990 | 1 494 | +50.9% |
| EBITDA | 663 | 876 | +32.1% |
| Operating profit | 501 | 876 | +75.0% |
| Net profit | 452 | 763 | +68.7% |
| Operating cash flow | 427 | — | — |
| Capex | 288 | — | — |
| EBITDA margin | 67.0% | 58.7% | -8.3 pp |
| Net margin | 45.7% | 51.1% | +5.4 pp |
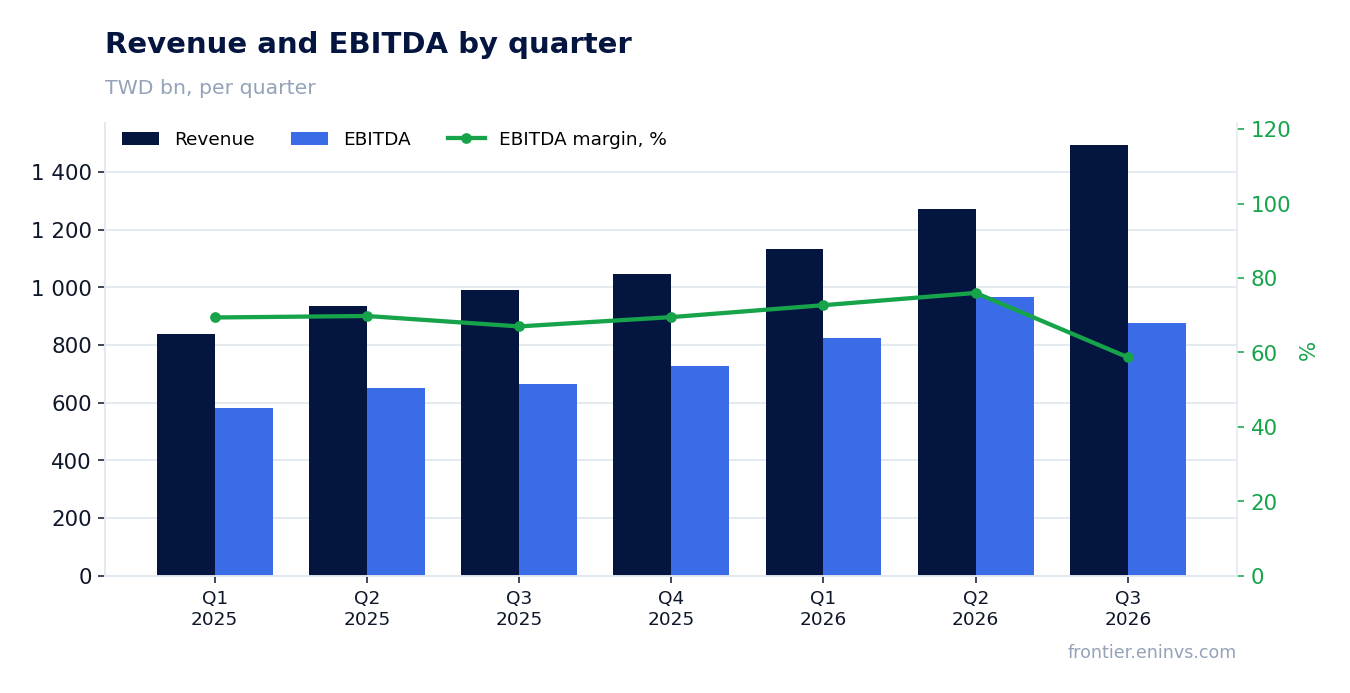
Revenue grew 50.9% year on year, and the pace accelerated from 36.0% in the second quarter
In the third quarter of 2026 TSMC's revenue reached TWD 1,494.2bn, 50.9% more than a year earlier. In the second quarter growth was a more modest 36.0%, in the first 35.1%. The acceleration from the previous quarter is notable: the company added more than 15 percentage points to its pace.
Over the last twelve months revenue came to TWD 4,944.8bn. The quarterly dynamics show demand is not slowing: each successive quarter of 2026 is larger than the previous one, and the third quarter was the strongest of the year.
Accelerating revenue is the main argument for the growth story. It does not automatically mean profit will grow at the same pace: as shown below, costs are rising faster than revenue.
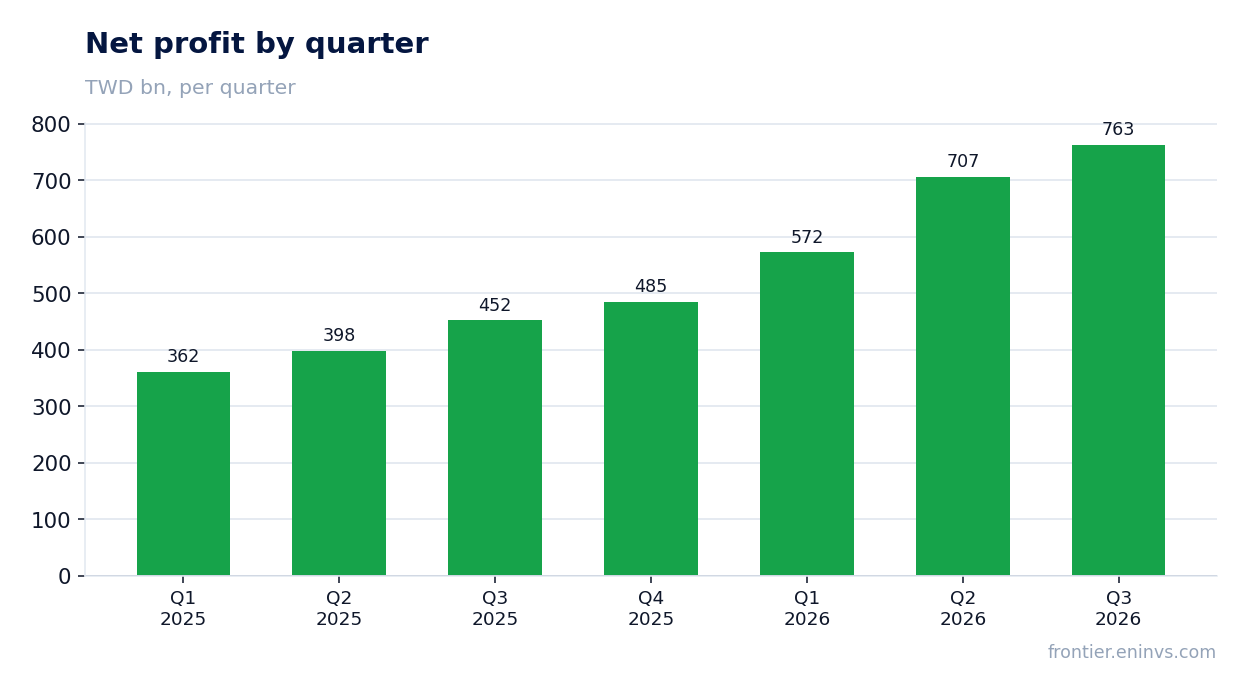
Net profit added 68.7%, outpacing revenue on a margin rise to 51.1%
Net profit in the third quarter of 2026 was TWD 763.1bn, 68.7% more than a year earlier. Profit growth outpaced revenue growth by 17.8 percentage points. The reason is the margin: the net margin rose to 51.1% from 45.7% a year earlier.
Over the last twelve months net profit came to TWD 2,527.6bn. That is a level, not a growth rate: the rate belongs to the reported quarter. Return on equity over the same period was 45.9%, pointing to a high return on capital.
Rising net margin alongside a falling EBITDA margin is a divergence worth keeping in mind. It means something below the operating line improved: either financial income or the tax burden. The facts do not give the cause, so we state it plainly: profit grew faster than revenue, while EBITDA grew slower.
EBITDA grew only 32.1% because its margin fell from 67.0% to 58.7%
EBITDA in the third quarter of 2026 was TWD 876.4bn, up 32.1% year on year. That is markedly slower than revenue (+50.9%). The EBITDA margin fell to 58.7% from 67.0% a year earlier – a drop of 8.3 percentage points.
Operating profit in the reported quarter equals EBITDA at TWD 876.4bn. That means depreciation is not broken out in the operating line, and the entire gap between revenue and operating profit comes from cost of sales and operating expenses. Those are what ate the margin.
Over the last twelve months EBITDA came to TWD 3,413.8bn. Falling margin alongside accelerating revenue is the main warning signal in the report. If costs keep rising faster than revenue, profit will stop outpacing revenue, and the current valuation will become vulnerable.
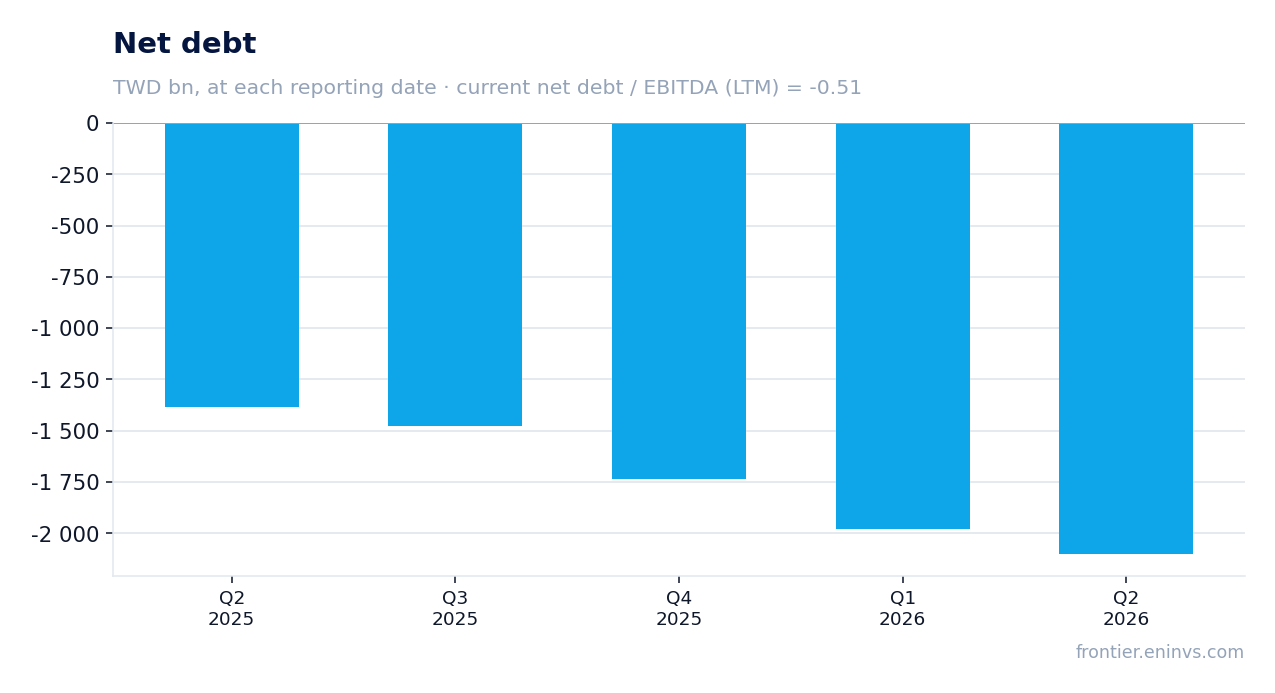
Leverage is negative: net debt to LTM EBITDA stands at -0.51
TSMC's net debt at the latest annual reporting date is negative at TWD -1,734.9bn. That means cash and equivalents exceed debt obligations. The ratio of net debt to EBITDA over the last twelve months is -0.51.
Negative leverage is a strength of the balance sheet. It gives the company freedom in capital spending and dividends and reduces risk if demand slows. We state the ratio as a level, without comparison to the past: no earlier value is in the facts.
Cash flow for the third quarter of 2026 is not disclosed in the facts, so this report does not allow a judgement on how profit converts into cash. In the second quarter of 2026 operating cash flow was TWD 783.4bn against capital expenditure of TWD 508.4bn – the last complete pair in the facts.
A dividend yield of 1.0% is modest against ROE of 45.9% and a price above its history
TSMC's dividend yield over the last twelve months is 1.0%. With a market capitalisation of TWD 61,848.8bn that is a small payout relative to the company's value. For a growth issuer with ROE of 45.9% such a yield is typical: profit is largely reinvested.
Our estimate of the current-year dividend follows from the facts: with LTM net profit of TWD 2,527.6bn and a 1.0% yield, payouts are around 1% of market capitalisation. The exact payout ratio is not disclosed in the facts, so the estimate rests on two things – profit and distribution policy. If profit stays at the LTM level, the dividend is unlikely to grow much faster.
A 1.0% yield is below the key rate, but for a growth stock that is not the main criterion. The dividend here is more a confirmation of cash generation than a source of income. A smaller payout could come from falling profit or rising capital expenditure, which already reached TWD 508.4bn in the second quarter of 2026.
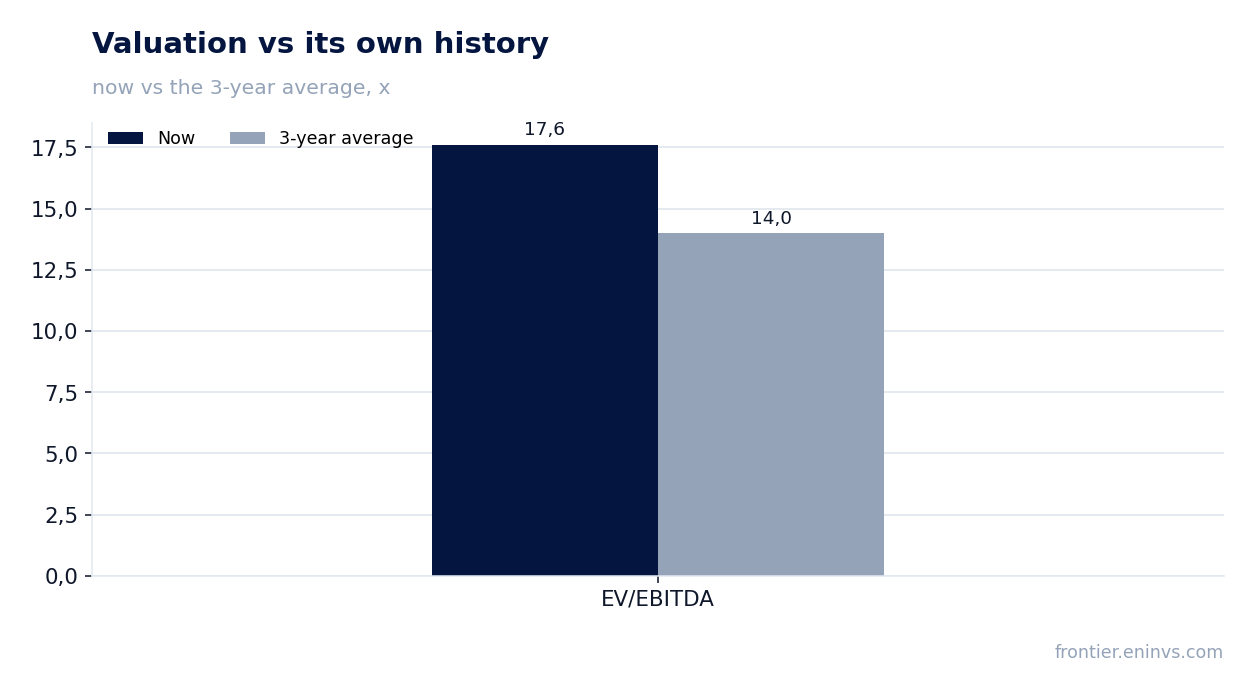
EV/EBITDA of 17.6 is 26% above its own three-year average of 14.0
The EV/EBITDA multiple over the last twelve months is 17.6. Its own three-year average is 14.0. The share trades 26% above its history on this multiple. That is expensive relative to itself, not relative to the sector: no sector comparison is in the facts.
The P/E over the last twelve months is 24.5. With ROE of 45.9% and negative net debt that level does not look like a bubble, but it leaves no room for error either. The market has already priced in continued revenue acceleration.
The portal model puts upside to fair value at +17%. That is our own estimate, not a market consensus. It rests on EBITDA growth and a target multiple. If the EBITDA margin keeps falling, the model will have to be revised down.
The portal model puts upside to fair value at +17%
On the portal model TSMC's fair value is 17% above the current market price. The model links EBITDA growth to a target multiple and compares the result with market capitalisation of TWD 61,848.8bn. This is our internal estimate, not a recommendation or a market forecast.
Upside of +17% is moderate. It does not offset the risk of further EBITDA margin compression. If the margin returns to last year's 67.0%, the upside grows; if the decline continues, it disappears.
For a holder two things matter now: whether the company holds the margin and whether revenue acceleration persists. The first drives profit, the second drives valuation. Both currently favour the share, but the margin of safety is thin.
Valuation on the latest reported figures
| Metric | Value |
|---|---|
| Market cap | 61 849 bn TWD |
| P/E (LTM) | 24.5 |
| EV/EBITDA (LTM) | 17.6 |
| P/B | 11.55 |
| Net debt / EBITDA (LTM) | -0.51 |
| ROE | 45.9% |
| Dividend yield (12m) | 1.0% |
| EV/EBITDA, 3-year average | 14.0 |
Bottom line
The report's strength remains revenue: TWD 1,494.2bn in the third quarter, 50.9% year-on-year growth and acceleration from 36.0% in the second quarter. Net profit added 68.7%, and ROE stands at 45.9%. But the EBITDA margin fell to 58.7% from 67.0%, and that is the main question for a holder: whether the company can contain costs. Valuation is already above its history – EV/EBITDA of 17.6 against an average of 14.0 – and a dividend yield of 1.0% offers no support. At the current price the share is rather attractive, but without room for error.
Open the company's financial profile 2330 →
See also: market overview · valuation map · stock screeners