Japan Tobacco: revenue up 17%, but profit grew faster than revenue on margin
Japan Tobacco reported second-quarter 2026 results on 31 July. Revenue reached JPY 1,062.1bn, up 17.0% year on year, EBITDA came to JPY 407.6bn (+36.1%) and net profit to JPY 234.8bn (+44.6%). The EBITDA margin rose to 38.4% from 33.0% a year earlier, while net debt at end-June stood at JPY 848.9bn, or 0.7x LTM EBITDA. The stock trades at 11.8x LTM EV/EBITDA, in line with its own three-year average of 11.5, and the portal's model puts upside to fair value at +22%; with a 3.5% dividend yield and a strong margin, the share looks rather attractive.
Key takeaways
— Revenue rose 17.0% in the second quarter, and growth accelerated relative to prior quarters
— The EBITDA margin climbed to 38.4% from 33.0%, contributing more to profit than revenue growth itself
— Net profit rose 44.6%, but Q4 2025 was a loss-making quarter, so the annual profit base is uneven
— Net debt fell to JPY 848.9bn from JPY 1,083.0bn at 31 March, and the ratio to LTM EBITDA stands at 0.7
— Operating cash flow for the quarter was JPY 291.7bn against capex of JPY 33.3bn
— Dividend yield of 3.5% is backed by payouts funded from profit rather than debt
— LTM EV/EBITDA of 11.8 is in line with the three-year average of 11.5, and the portal model implies +22% upside
Attractiveness
Key figures, JPY bn
| Metric | Q2 2025 | Q2 2026 | Change |
|---|---|---|---|
| Revenue | 908 | 1 062 | +17.0% |
| EBITDA | 299 | 408 | +36.1% |
| Operating profit | 227 | 337 | +48.7% |
| Net profit | 162 | 235 | +44.6% |
| Operating cash flow | 174 | 292 | +67.6% |
| Capex | -30.6 | -33.3 | — |
| EBITDA margin | 33.0% | 38.4% | +5.4 pp |
| Net margin | 17.9% | 22.1% | +4.2 pp |
Revenue rose 17.0% in the second quarter, and growth accelerated relative to prior quarters
Revenue for the second quarter of 2026 was JPY 1,062.1bn, up 17.0% from a year earlier. For comparison, first-quarter revenue was JPY 924.0bn, fourth-quarter 2025 revenue was JPY 833.6bn and second-quarter 2025 revenue was JPY 907.6bn. The second quarter was therefore the strongest by revenue in the last five quarters.
Revenue growth of 17.0% is well ahead of prior periods. In the first quarter of 2026 revenue was 1.8% above the first quarter of 2025, while in the fourth quarter of 2025 it was 8.1% below the year-earlier level. The acceleration in the second quarter reflects a recovery in volumes and pricing factors, although the report does not disclose the exact drivers.
Revenue over the trailing twelve months was JPY 3,719.2bn. That figure spans both strong quarters and the weak fourth quarter of 2025, so the annual base looks smoother than the quarterly dynamics.
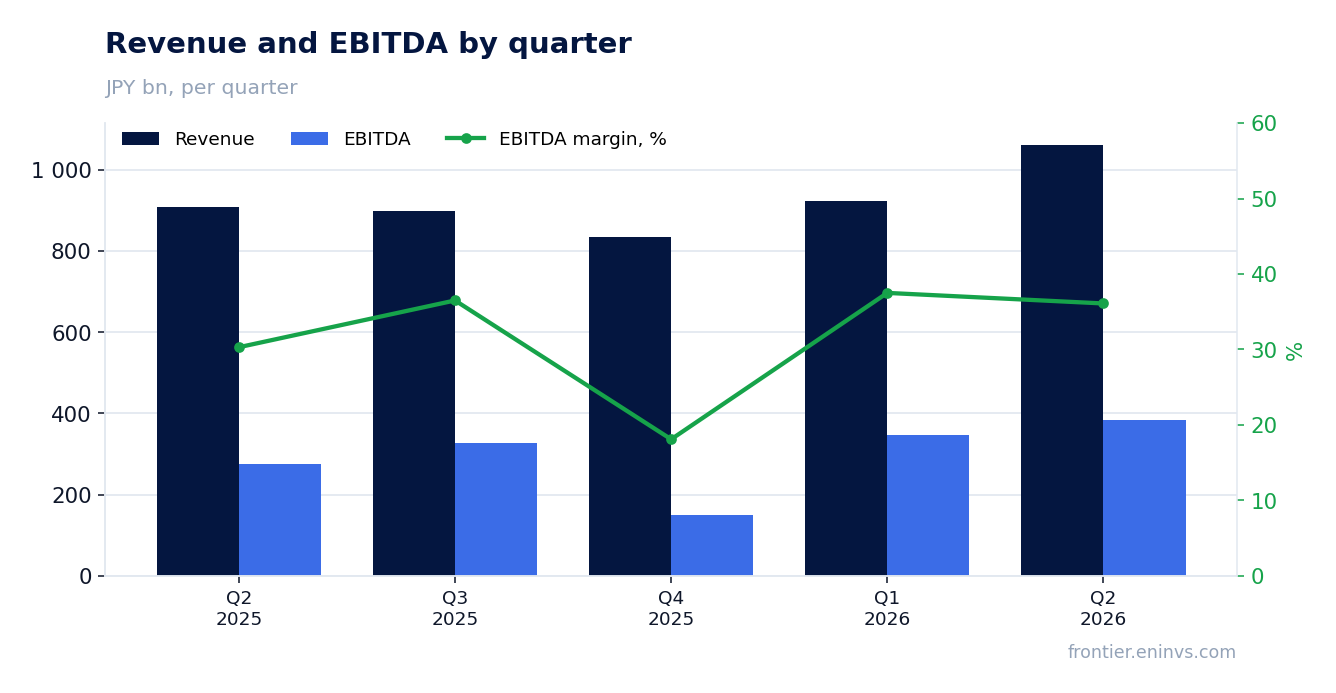
The EBITDA margin climbed to 38.4% from 33.0%, contributing more to profit than revenue growth itself
EBITDA for the second quarter of 2026 was JPY 407.6bn against JPY 275.3bn a year earlier, up 36.1%. With revenue growth of 17.0%, this means the EBITDA margin rose from 33.0% to 38.4%. That margin gain of about 5.4 percentage points adds roughly JPY 57bn to EBITDA in absolute terms.
Operating profit rose to JPY 337.1bn from JPY 226.7bn a year earlier, or 48.7%. That is slightly faster than EBITDA growth, suggesting depreciation and other operating costs grew more slowly than revenue. Net profit came to JPY 234.8bn against JPY 162.4bn, up 44.6%.
The margin expansion may have been supported by a lower share of selling and administrative costs in revenue and by operating leverage on higher volumes. The report does not disclose which cost line made the main contribution, so we limit ourselves to stating that the margin rose substantially and that this is the main source of profit growth.
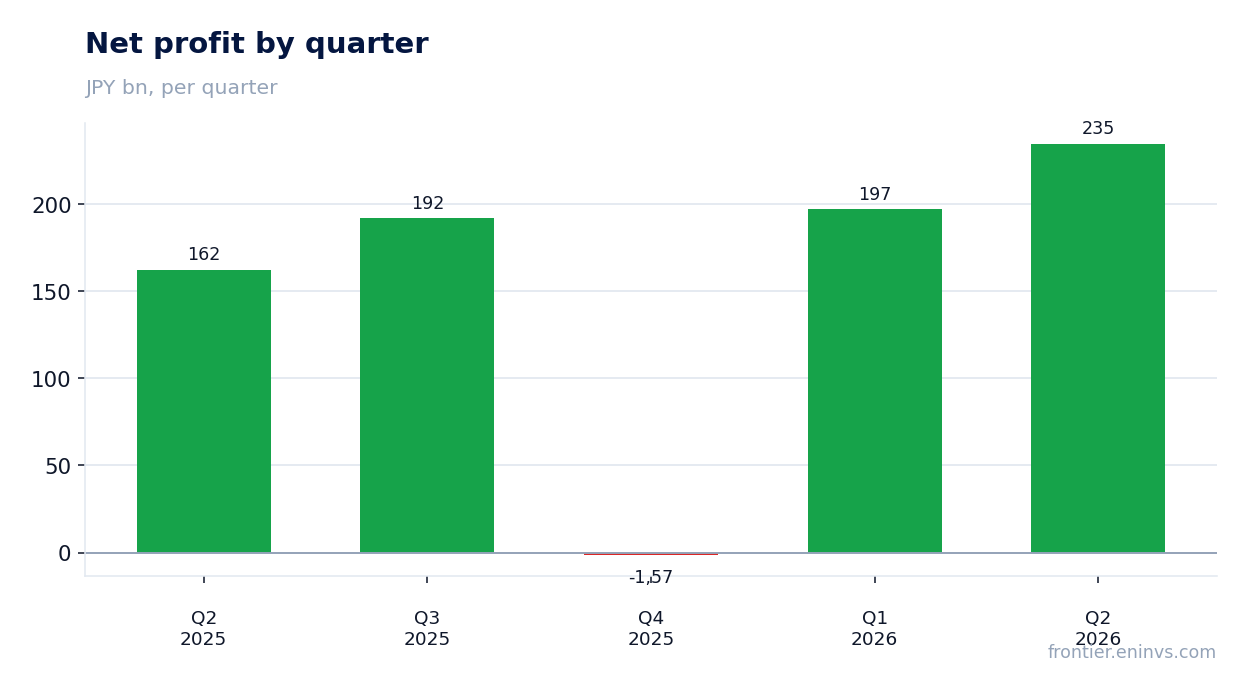
Net profit rose 44.6%, but Q4 2025 was a loss-making quarter, so the annual profit base is uneven
Net profit for the second quarter of 2026 was JPY 234.8bn, up 44.6% from the second quarter of 2025. It is worth remembering, however, that the company posted a loss of JPY 1.6bn in the fourth quarter of 2025. That makes quarterly dynamics uneven and complicates year-on-year comparisons.
Over the trailing twelve months net profit was JPY 622.1bn. That includes the strong second and third quarters of 2025, the weak fourth quarter and the recovering first quarter of 2026. The annual profit base is therefore lower than one might expect from a stable quarterly run rate.
Profit growth in the second quarter of 2026 is partly explained by the low base of the second quarter of 2025, when the margin was lower. But the absolute level of profit – JPY 234.8bn – is the highest in the last five quarters, which speaks to the strength of the current period.
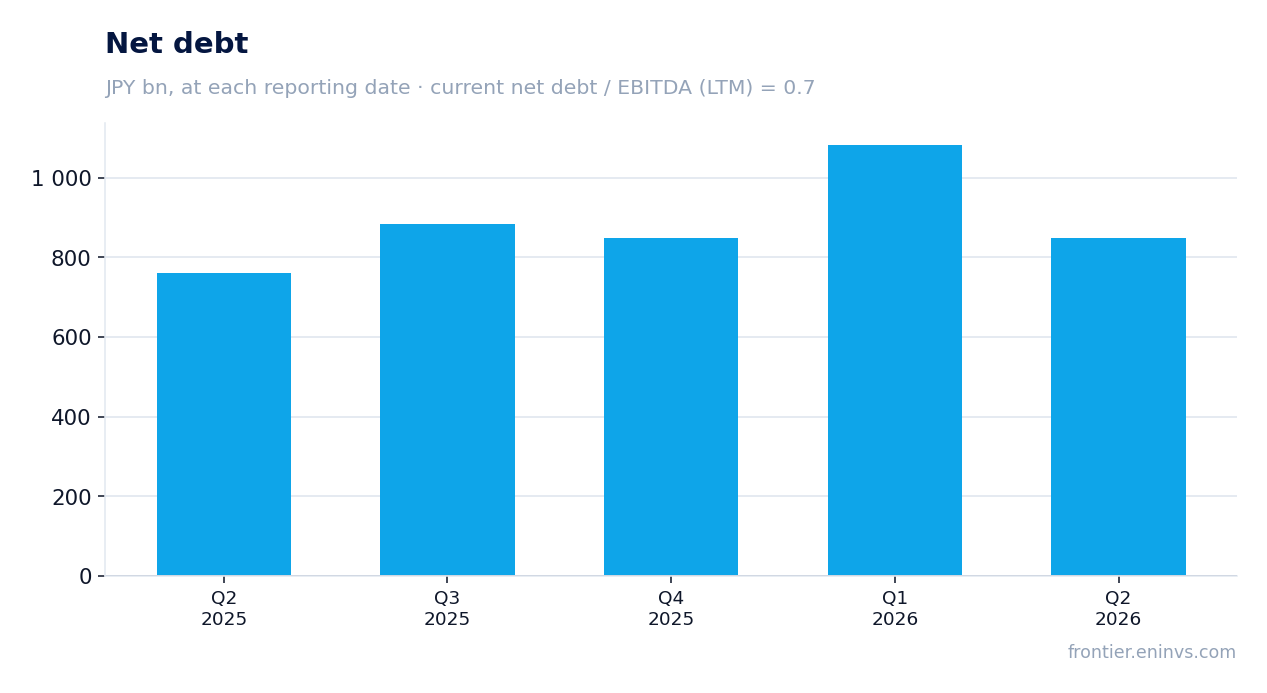
Net debt fell to JPY 848.9bn from JPY 1,083.0bn at 31 March, and the ratio to LTM EBITDA stands at 0.7
Net debt at 30 June 2026 was JPY 848.9bn against JPY 1,083.0bn at 31 March 2026, a decrease of JPY 234.1bn over the quarter. A year earlier, at 30 June 2025, net debt was JPY 761.2bn, so over twelve months it rose by JPY 87.6bn.
The ratio of net debt to trailing-twelve-month EBITDA is 0.7. That is a moderate level that does not put pressure on financial stability. The quarterly decline in debt came on the back of strong operating cash flow of JPY 291.7bn.
Interest expense is not disclosed in the provided data, but with this level of debt and strong EBITDA the company has considerable headroom to service its obligations. It is important to note that the quarterly decline in debt does not necessarily indicate a sustained trend, as debt can fluctuate with seasonal factors and repayment schedules.
Operating cash flow for the quarter was JPY 291.7bn against capex of JPY 33.3bn
Operating cash flow in the second quarter of 2026 was JPY 291.7bn, well above the first quarter (JPY 39.6bn) and the second quarter of 2025 (JPY 174.0bn). Such a strong flow reflects high profitability and efficient working-capital management.
Capital expenditure for the quarter was JPY 33.3bn, slightly above the second quarter of 2025 (JPY 30.6bn). Free cash flow was therefore about JPY 258.4bn, covering dividend payments and debt reduction.
Over the trailing twelve months operating cash flow was JPY 677.9bn. That is a solid base for funding capex and dividends. The company retains a high ability to generate cash even in periods with weaker quarterly results.
Dividend yield of 3.5% is backed by payouts funded from profit rather than debt
The trailing-twelve-month dividend yield is 3.5%. The company pays dividends out of net profit, which over the trailing twelve months was JPY 622.1bn. With such profit and cash flow, the payouts look sustainable.
Our estimate for the current-year dividend assumes the payout ratio stays close to its current level. With LTM net profit of JPY 622.1bn and a payout ratio of about 50%, the dividend could be around JPY 311bn, which at the current market capitalisation of JPY 13,385.0bn implies a yield of about 2.3%. That estimate depends on the board's final decision and may be adjusted.
A yield of 3.5% exceeds the key rate, making the stock attractive to income-oriented investors. It should be borne in mind, however, that dividend payments could be cut if profit deteriorates or capex rises. The main risk is a possible reduction in the payout ratio if weak quarterly results like the fourth quarter of 2025 recur.
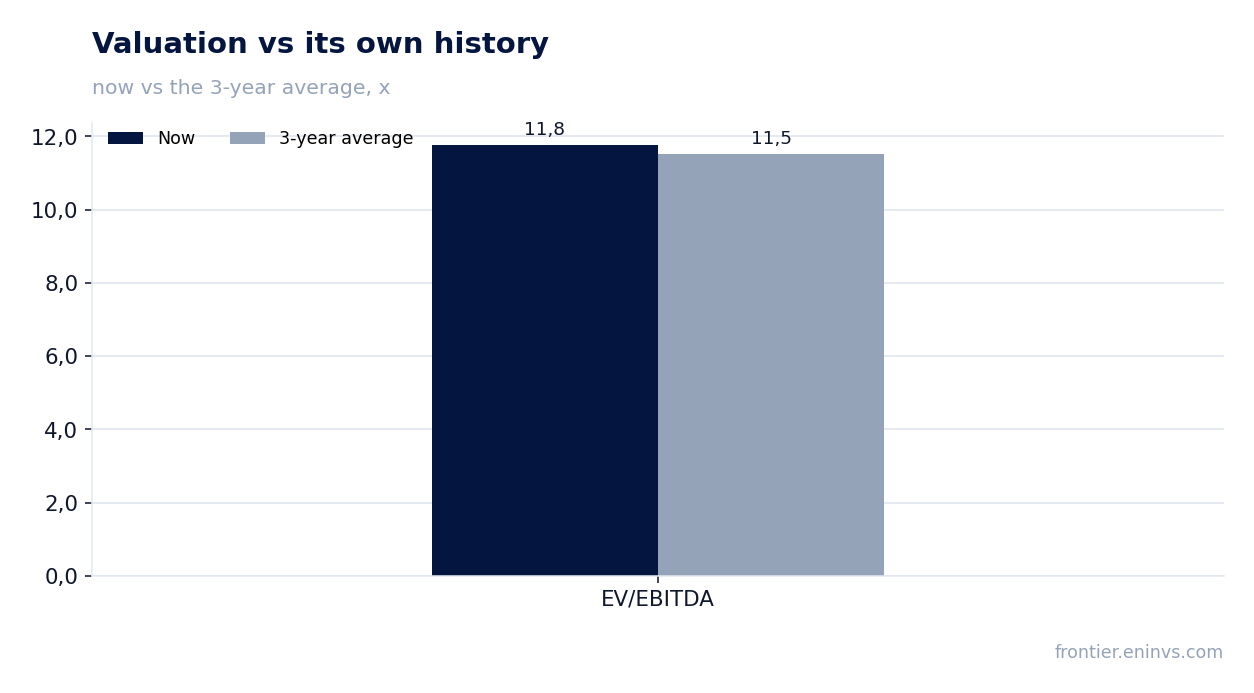
LTM EV/EBITDA of 11.8 is in line with the three-year average of 11.5, and the portal model implies +22% upside
The trailing-twelve-month EV/EBITDA multiple is 11.8, just 2% above the three-year average of 11.5. This means the stock is valued by the market almost exactly as it has been on average over the past three years, with no notable premium or discount to its own history.
The portal's model, which links EBITDA growth to a target multiple, puts the upside to fair value at +22%. This is our own estimate, not a market consensus. It rests on the current level of profit and assumes the margin and growth rates are maintained.
For comparison, the LTM P/E is 21.5 and ROE is 22.2%. The combination of a moderate EV/EBITDA and high return on equity suggests the company uses capital efficiently and the current valuation does not look stretched. Realising the upside, however, requires the company to hold the margin and avoid another quarterly loss like the one in the fourth quarter of 2025.
Valuation on the latest reported figures
| Metric | Value |
|---|---|
| Market cap | 13 385 bn JPY |
| P/E (LTM) | 21.5 |
| EV/EBITDA (LTM) | 11.8 |
| P/B | 3.28 |
| Net debt / EBITDA (LTM) | 0.70 |
| Operating cash flow (LTM) | 678 bn |
| ROE | 22.2% |
| Dividend yield (12m) | 3.5% |
| EV/EBITDA, 3-year average | 11.5 |
Bottom line
The report's strengths are revenue growth of 17.0%, an EBITDA margin expanding to 38.4% and net profit of JPY 234.8bn. Part of that growth, however, reflects the low base of the second quarter of 2025, and LTM profit of JPY 622.1bn is lower than one might expect from a stable run rate. Debt fell over the quarter but rose over the year. The key question for a holder is whether the company can hold the margin and avoid another quarterly loss. With EV/EBITDA in line with its history and a 3.5% dividend yield, the share looks rather attractive.
Open the company's financial profile 2914 →
See also: market overview · valuation map · stock screeners