ASE Technology: revenue accelerated to +44.8%, but record capex consumed free cash flow
In its Q3 2026 report, ASE Technology posted revenue of TWD 244,161 mn, up 44.8% year on year – faster than the 26.7% growth in Q2. EBITDA rose 77.7% to TWD 57,579 mn, net profit jumped 148.4% to TWD 26,996 mn, and the EBITDA margin climbed to 23.6% from 19.2%. Capital expenditures reached TWD 125,852 mn, leaving free cash flow negative; the stock trades at 19.3x EV/EBITDA LTM against its own three-year average of 9.5, so despite strong operating momentum the valuation looks stretched – verdict: neutral.
Key takeaways
— Revenue grew 44.8% year on year – an acceleration from 26.7% in Q2
— The EBITDA margin rose to 23.6% from 19.2%, driving EBITDA growth of 77.7%
— Net profit jumped 148.4% to TWD 26,996 mn, but part of the effect is a low prior-year base
— Capital expenditures of TWD 125,852 mn left free cash flow negative
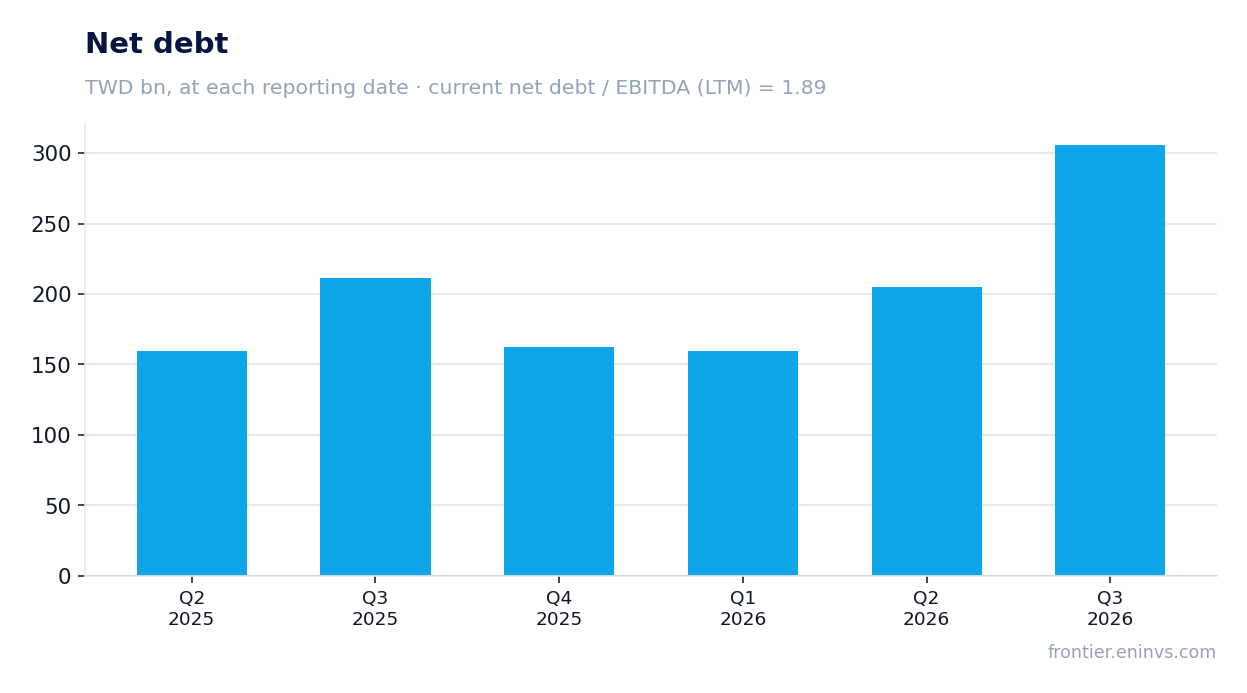
— Net debt rose to TWD 306.0 bn, with net debt/EBITDA LTM at 1.89
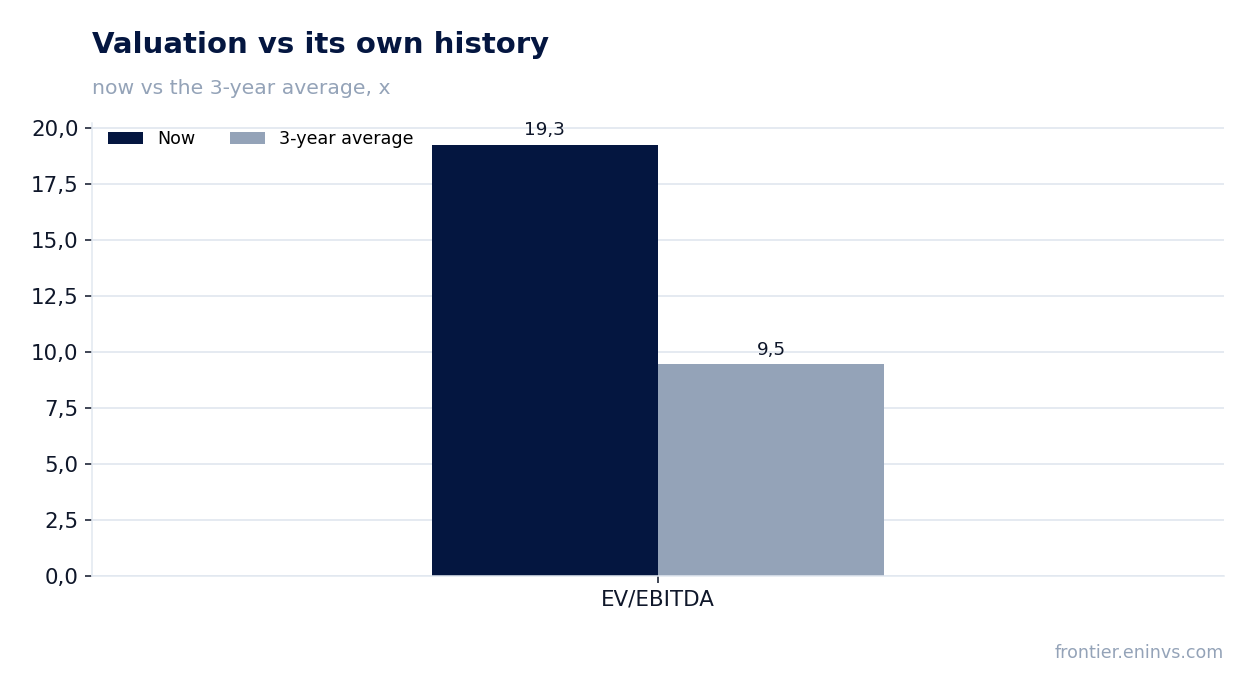
— The stock trades at 19.3x EV/EBITDA LTM against its own three-year average of 9.5 – twice its history
— A dividend yield of 0.99% does not offset the stretched valuation
Attractiveness
Key figures, TWD bn
| Metric | Q3 2025 | Q3 2026 | Change |
|---|---|---|---|
| Revenue | 169 | 244 | +44.8% |
| EBITDA | 32.4 | 57.6 | +77.7% |
| Operating profit | 13.2 | 33.1 | +151.1% |
| Net profit | 10.9 | 27.0 | +148.4% |
| Operating cash flow | 14.6 | 50.5 | +245.0% |
| Capex | 44.9 | -126 | -380.2% |
| EBITDA margin | 19.2% | 23.6% | +4.4 pp |
| Net margin | 6.4% | 11.1% | +4.7 pp |
Revenue grew 44.8% year on year – an acceleration from 26.7% in Q2
In Q3 2026, ASE Technology's revenue reached TWD 244,161 mn, up 44.8% year on year. Growth was 26.7% in Q2 and 17.2% in Q1, so the pace accelerated for three consecutive quarters. This acceleration pushed quarterly revenue well above the levels of the first half.
The acceleration coincided with rising capacity utilisation: the company is the largest contract semiconductor manufacturer, and demand for chip packaging and testing for computing and connectivity remains strong. In numbers, Q3 revenue exceeded Q2's TWD 191,064 mn by TWD 53,097 mn – nearly a quarter. This operating leverage on rising utilisation explains why profit is growing faster than revenue.
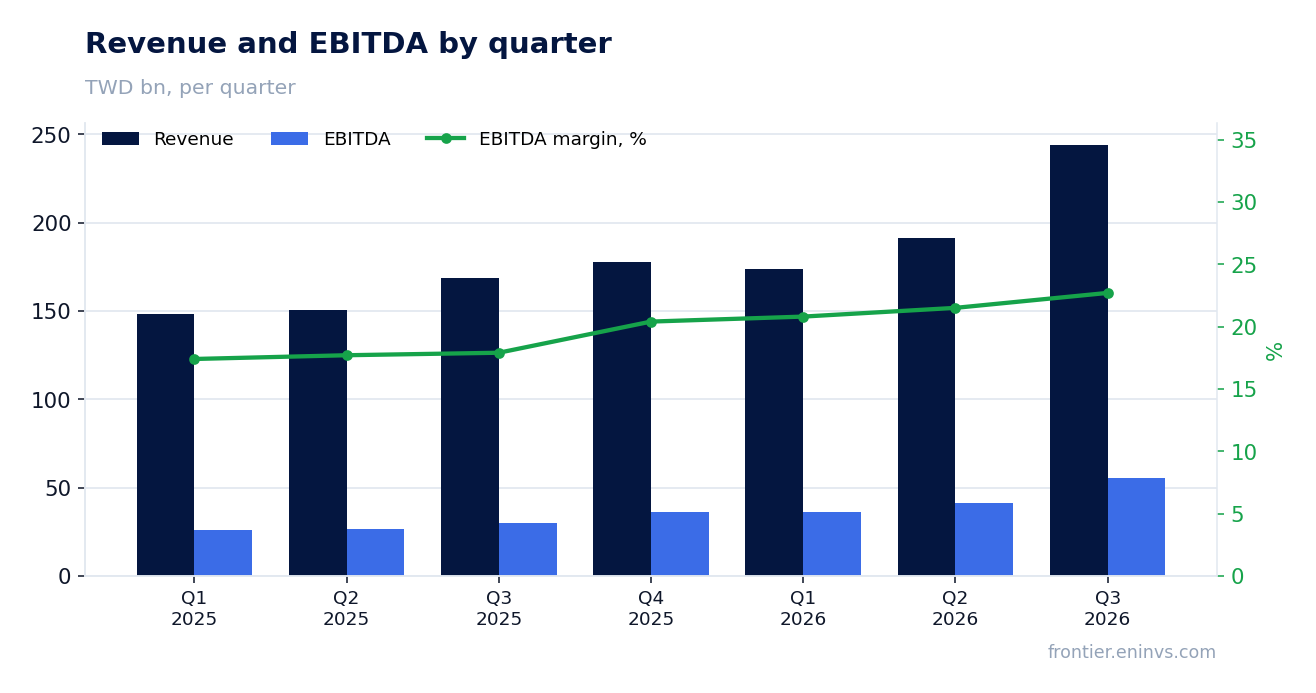
The EBITDA margin rose to 23.6% from 19.2%, driving EBITDA growth of 77.7%
Q3 2026 EBITDA reached TWD 57,579 mn, up 77.7% year on year. The EBITDA margin rose to 23.6% from 19.2% – an increase of 4.4 percentage points. Operating profit grew to TWD 33,142 mn, and its share of revenue rose more sharply than EBITDA's, suggesting the bulk of the gain came from operations rather than one-off items.
Margin expansion alongside accelerating revenue means fixed costs are spread over a larger volume. The company did not disclose a line-by-line cost breakdown in the facts, so it is not possible to say which cost line drove the effect. But the combination of 44.8% revenue growth and 77.7% EBITDA growth shows that each additional unit of revenue brings disproportionately more profit.
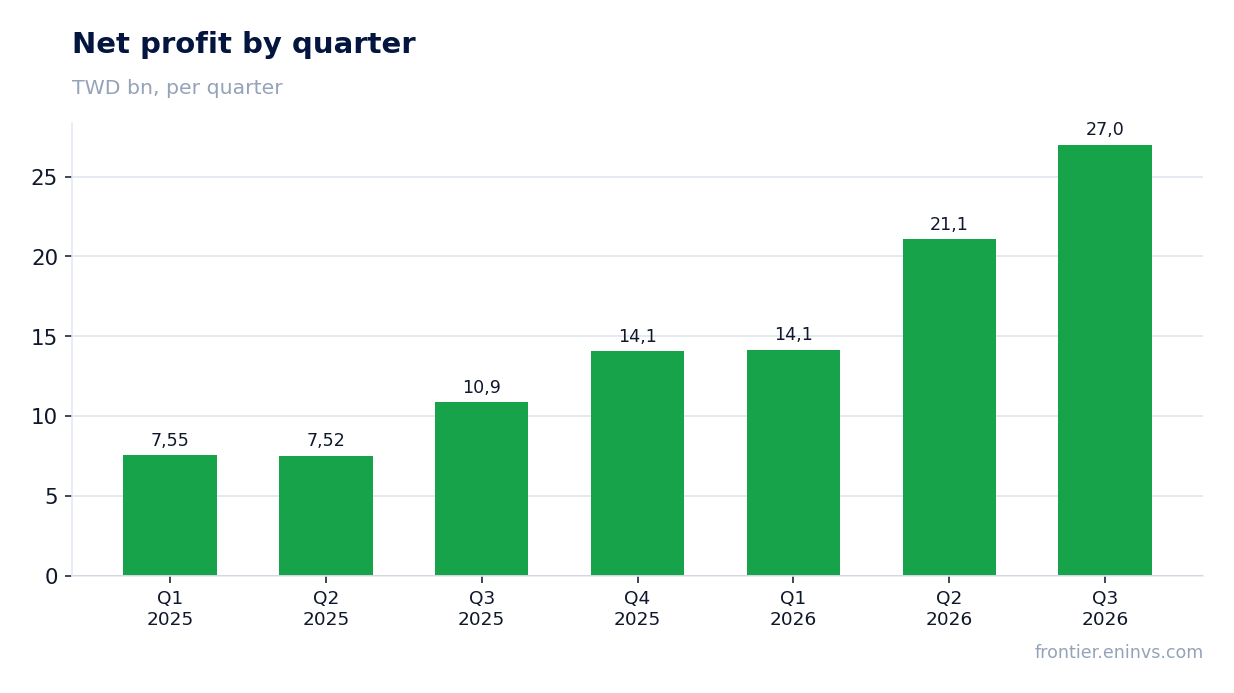
Net profit jumped 148.4% to TWD 26,996 mn, but part of the effect is a low prior-year base
Q3 2026 net profit reached TWD 26,996 mn versus TWD 10,870 mn a year earlier – growth of 148.4%. The net margin rose to 11.1% from 6.4%. This jump is explained not only by higher operating profit but also by a low base: in Q3 2025 the net margin was half as high.
The gap between EBITDA growth (77.7%) and net profit growth (148.4%) indicates that improvements also occurred below the operating line – likely through lower finance costs or operating leverage. However, the company did not disclose details in the facts, so the exact cause cannot be named. What matters is that profit has been growing faster than revenue for several quarters: TWD 21,068 mn in Q2 2026 and TWD 14,148 mn in Q1 2026.
Capital expenditures of TWD 125,852 mn left free cash flow negative
Q3 2026 operating cash flow was TWD 50,462 mn, but capital expenditures reached TWD 125,852 mn. As a result, free cash flow was negative – approximately minus TWD 75,390 mn. This is a sharp contrast with previous quarters: capex was TWD 79,849 mn in Q2 2026 and TWD 46,359 mn in Q1 2026.
This level of investment indicates the company is actively expanding capacity to meet rising demand. However, so far this growth is funded by debt and operating cash flow rather than internal funds. For the shareholder this means dividend potential is limited, and free cash flow will return to positive territory only after the investment phase is completed.
Net debt rose to TWD 306.0 bn, with net debt/EBITDA LTM at 1.89
Net debt at 30 September 2026 was TWD 306.0 bn versus TWD 205.1 bn at 30 June 2026 – an increase of TWD 100.8 bn over the quarter. Over the year, from 30 September 2025, net debt rose by TWD 94.4 bn. This increase is primarily explained by record capital expenditures that are not covered by operating cash flow.
The ratio of net debt to trailing twelve-month EBITDA is 1.89. This is a moderate level that remains comfortable for a company with growing EBITDA. However, it is important that debt is growing faster than EBITDA: if the investment phase drags on, leverage could increase. The company did not disclose the dynamics of this ratio in the facts, so only the current level can be discussed.
The stock trades at 19.3x EV/EBITDA LTM against its own three-year average of 9.5 – twice its history
On EV/EBITDA LTM the stock trades at 19.3x, more than double its own three-year average of 9.5x. This means the market has already priced in significant profit growth. P/E LTM is 38.7, which also looks high for a company with a cyclical profile.
On the portal's model, which compares EBITDA growth with a target multiple, the upside to fair value is estimated at +30%. However, this estimate is based on our own assumptions and is not a market consensus. If EBITDA growth slows or capital expenditures remain high, the multiple could compress towards historical levels, putting pressure on the price.
A dividend yield of 0.99% does not offset the stretched valuation
The trailing twelve-month dividend yield is 0.99%. This is a low level that does not compensate for the risk associated with the high valuation. For comparison, the yield is lower than that of many fixed-income instruments and does not provide a meaningful cushion for the investor.
The company did not disclose the size of the last dividend paid or the payout ratio in the facts, so it is not possible to assess how the yield will change in the future. However, given negative free cash flow and high capital expenditures, the likelihood of a significant dividend increase in the coming quarters is low. The dividend story is not an argument for buying the stock at current levels.
Valuation on the latest reported figures
| Metric | Value |
|---|---|
| Market cap | 2 949 bn TWD |
| P/E (LTM) | 38.7 |
| EV/EBITDA (LTM) | 19.3 |
| P/B | 8.62 |
| Net debt / EBITDA (LTM) | 1.89 |
| Operating cash flow (LTM) | 205 bn |
| ROE | 26.6% |
| Dividend yield (12m) | 1.0% |
| EV/EBITDA, 3-year average | 9.5 |
Bottom line
The strong side of the report is revenue accelerating to 44.8% and the EBITDA margin rising to 23.6%, which drove a near-doubling of net profit. However, this growth is accompanied by record capital expenditures that pushed free cash flow negative and raised net debt to TWD 306.0 bn. The EV/EBITDA LTM multiple of 19.3x versus a three-year average of 9.5 already prices in a significant portion of future growth. A dividend yield of 0.99% offers no support. Verdict: neutral – operating momentum is impressive, but the current price leaves little margin of safety.
Open the company's financial profile 3711 →
See also: market overview · valuation map · stock screeners