Mitsubishi UFJ Financial Group: Q2 profit up 48.2%, but net interest income barely moves
On August 25, Mitsubishi UFJ Financial Group released its results for the second quarter of 2026. Net profit for the reported period came in at JPY 809,427 million, up 48.2% year on year. Net interest income in Q2 reached JPY 2,067,065 million, but its growth from Q1 2026 was only 1.0%. Meanwhile, trailing twelve-month profit stands at JPY 2,690,588 million, and return on equity is 14.4%. In our view, the stock looks attractive: profit is growing faster than net interest income, while the dividend yield of 2.76% and the portal model's 8% upside to fair value support the case.
Key takeaways
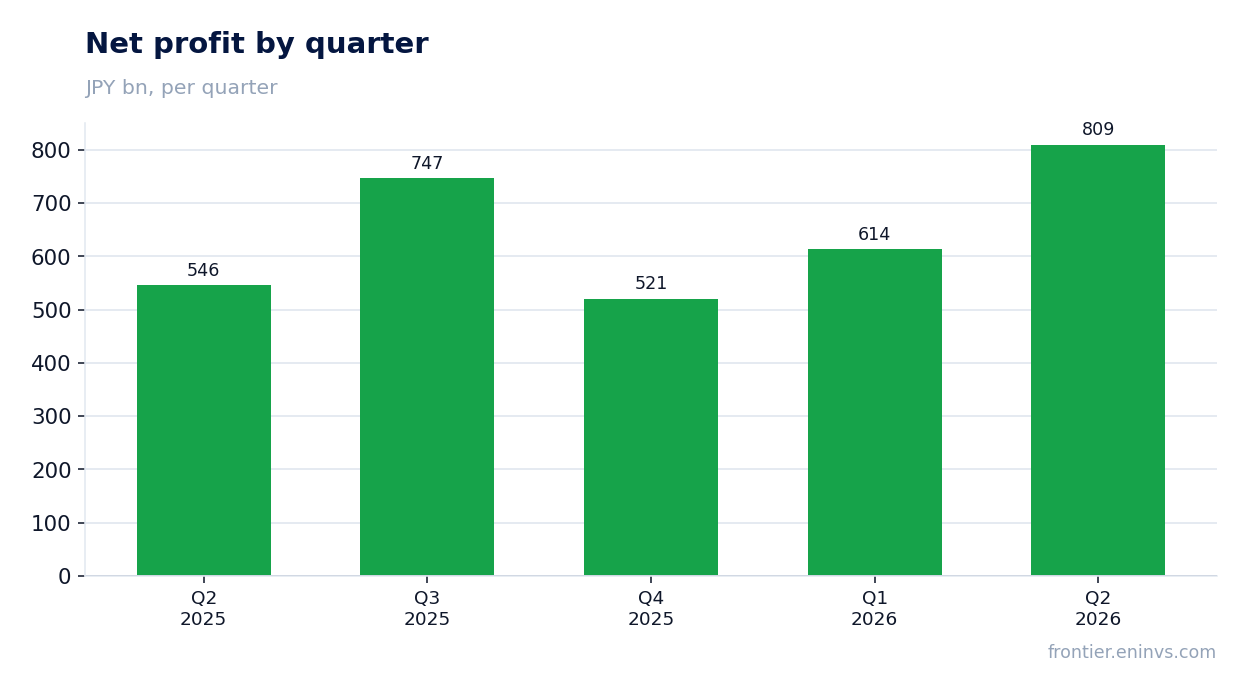
— Q2 net profit rose 48.2% year on year to JPY 809,427 million, but net interest income added only 1.0% from Q1
— Net interest income in Q2 was JPY 2,067,065 million – just 1.0% above Q1 2026
— Return on equity of 14.4% and trailing twelve-month profit of JPY 2,690,588 million underpin a dividend yield of 2.76%
— The trailing P/E of 15.0 is above the historical average, but the portal model sees 8% upside to fair value
— A dividend yield of 2.76% with a payout ratio near 40% looks sustainable, but growth is capped by slowing net interest income
Attractiveness
Key figures, JPY bn
| Metric | Q2 2025 | Q2 2026 | Change |
|---|---|---|---|
| Net profit | 546 | 809 | +48.2% |
Q2 net profit rose 48.2% year on year to JPY 809,427 million, but net interest income added only 1.0% from Q1
Net profit for the second quarter of 2026 came in at JPY 809,427 million, up 48.2% from the same period a year earlier. This is well above the first-quarter 2026 figure of JPY 613,721 million. Such profit growth with only a modest increase in net interest income suggests that the main contribution came from other lines – likely fee income or one-off items that the company does not break out in the provided data.
Net interest income in Q2 reached JPY 2,067,065 million, up just 1.0% from Q1 2026. Year on year, net interest income growth was 27.5% in Q1 2026, but the pace slowed in Q2. This indicates that the interest margin is no longer the main driver of profit.
Trailing twelve-month profit was JPY 2,690,588 million, while net interest income for the same period was JPY 7,966,900 million. The ratio of profit to net interest income over the last twelve months is about 34%, confirming the dependence of profit on non-operating items.
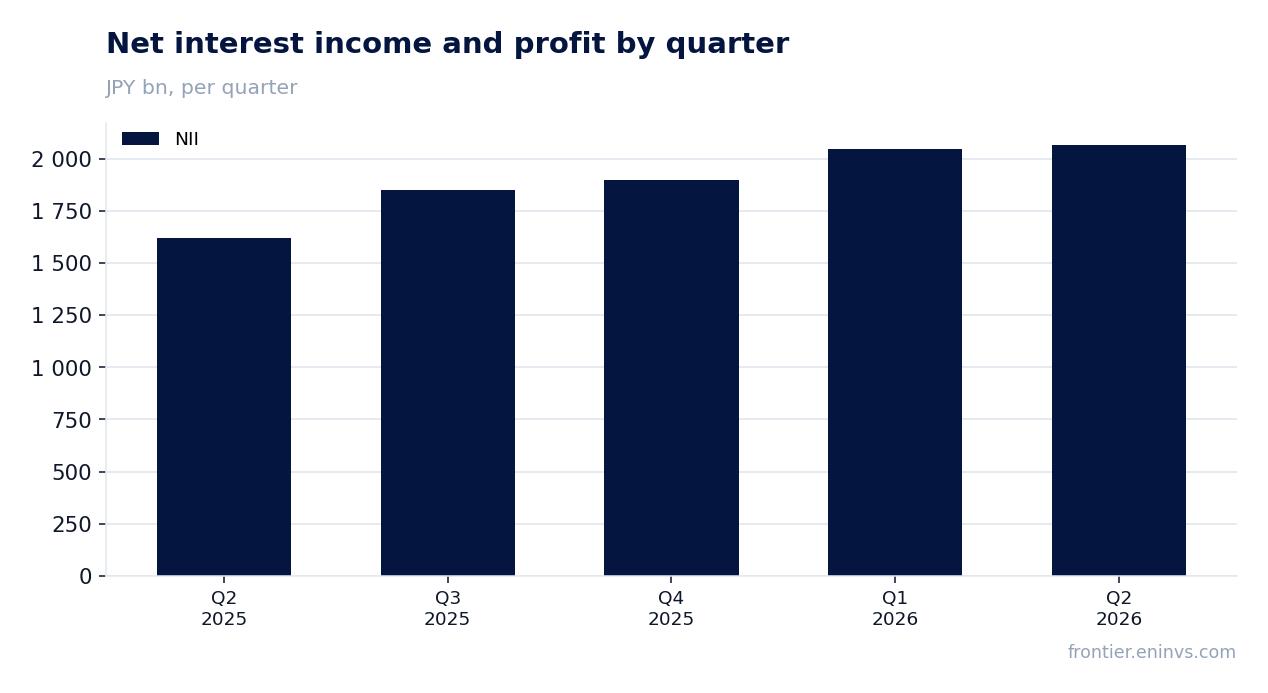
Net interest income in Q2 was JPY 2,067,065 million – just 1.0% above Q1 2026
Net interest income in Q2 2026 was JPY 2,067,065 million, just 1.0% above the Q1 2026 level of JPY 2,047,250 million. This is a sharp slowdown from the 27.5% year-on-year growth in Q1. Such dynamics suggest that the interest margin has stopped expanding, and further profit growth will depend on other revenue sources.
Over the last twelve months, net interest income totalled JPY 7,966,900 million. If quarterly growth remains at 1.0%, the annual figure may increase only marginally. This poses a risk to profit if fee and other income do not continue to grow.
Return on equity of 14.4% and trailing twelve-month profit of JPY 2,690,588 million underpin a dividend yield of 2.76%
Return on equity (ROE) over the last twelve months was 14.4%. This is a high level for the banking sector, supporting stable dividend payments. Trailing twelve-month profit of JPY 2,690,588 million provides dividend coverage.
The trailing twelve-month dividend yield is 2.76%. At the current share price and earnings per share, the payout ratio is estimated at around 40% of profit. This is a moderate level that leaves room for dividend growth if profit continues to rise.
However, dividend growth may slow if net interest income stops growing. In that case, maintaining the yield would require either a higher payout ratio or profit growth from other lines.
The trailing P/E of 15.0 is above the historical average, but the portal model sees 8% upside to fair value
The trailing price-to-earnings (P/E) ratio is 15.0. This is above the company's historical average, which may indicate limited upside. However, the portal model, based on return on equity and price-to-book, estimates 8% upside to fair value.
The company's market capitalisation is JPY 40,363,133 million. With trailing twelve-month profit of JPY 2,690,588 million and ROE of 14.4%, the stock trades at a premium to historical levels, but the portal model sees room for appreciation.
A dividend yield of 2.76% with a payout ratio near 40% looks sustainable, but growth is capped by slowing net interest income
The trailing twelve-month dividend yield is 2.76%. With a payout ratio of around 40% of profit, the company maintains a balance between shareholder payouts and reinvestment. This is a moderate yield that may be attractive against low rates, but it is not exceptionally high.
The main risk to dividends is the slowdown in net interest income growth. If it remains at JPY 2,067,065 million per quarter, the annual figure may not show significant growth, limiting profit and dividend increases. At the same time, a high ROE of 14.4% provides a cushion.
Valuation on the latest reported figures
| Metric | Value |
|---|---|
| Market cap | 40 363 bn JPY |
| P/E (LTM) | 15.0 |
| P/B | 1.81 |
| ROE | 14.4% |
| Dividend yield (12m) | 2.8% |
Bottom line
The strong points of the report were a 48.2% year-on-year rise in net profit to JPY 809,427 million and a high ROE of 14.4%. However, this growth was achieved with almost flat net interest income, raising questions about its sustainability. A dividend yield of 2.76% and the portal model's 8% upside support the stock's appeal, but slowing net interest income is a key risk. Verdict: the stock looks attractive for income-oriented investors, but requires monitoring of the interest margin trend.
Open the company's financial profile 8306 →
See also: market overview · valuation map · stock screeners