КазМунайГаз: прибыль выросла на 90%, но операционный поток почти обнулился
29 мая 2026 года КазМунайГаз раскрыл результаты за первый квартал 2026 года: выручка выросла на 10,7% до 2 481 млрд тенге, чистая прибыль – на 89,8% до 373 млрд тенге. Однако операционный денежный поток составил всего 283 млн тенге против 427 млрд годом ранее, а свободный денежный поток ушёл в минус на 78 млрд тенге. При текущей цене акция выглядит скорее привлекательно: мультипликаторы ниже исторических, а модель портала даёт потенциал +61%.
Главные тезисы
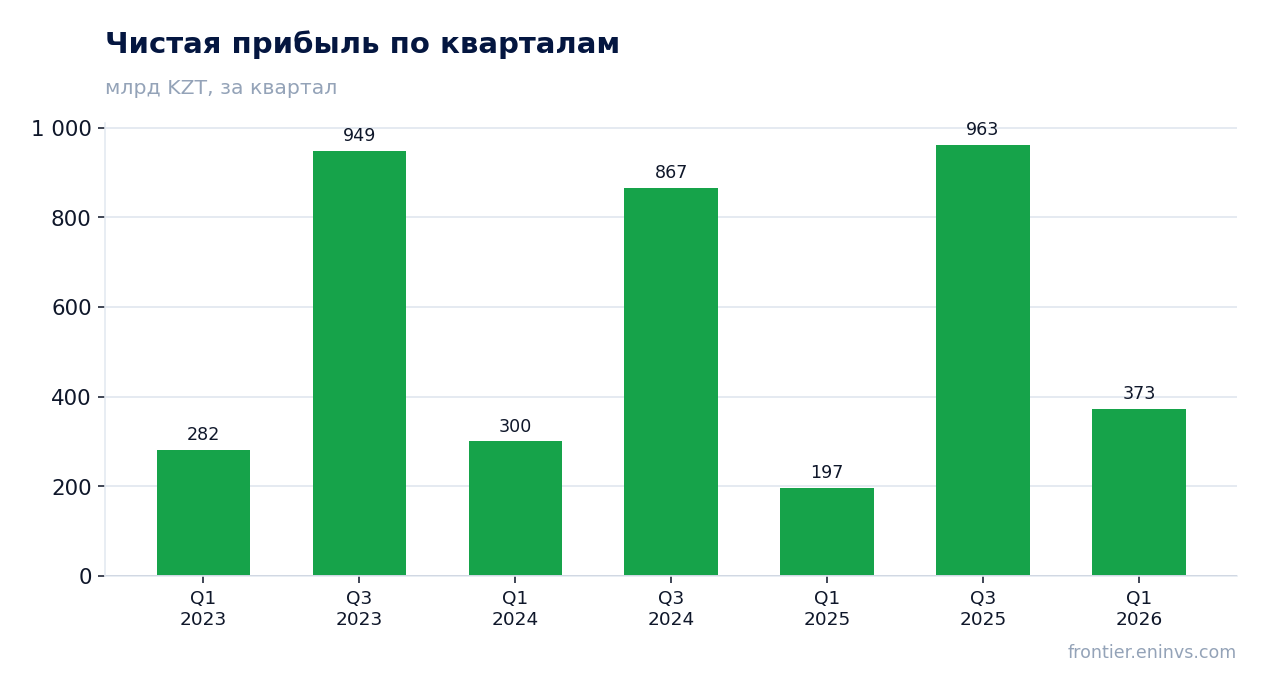
— Чистая прибыль выросла на 89,8% до 373 млрд тенге, но почти половина – 196 млрд – это доля в прибыли совместных предприятий, а не денежный результат
— Операционный денежный поток рухнул до 283 млн тенге из-за роста дебиторки и сдвига дивидендов от ТШО на апрель
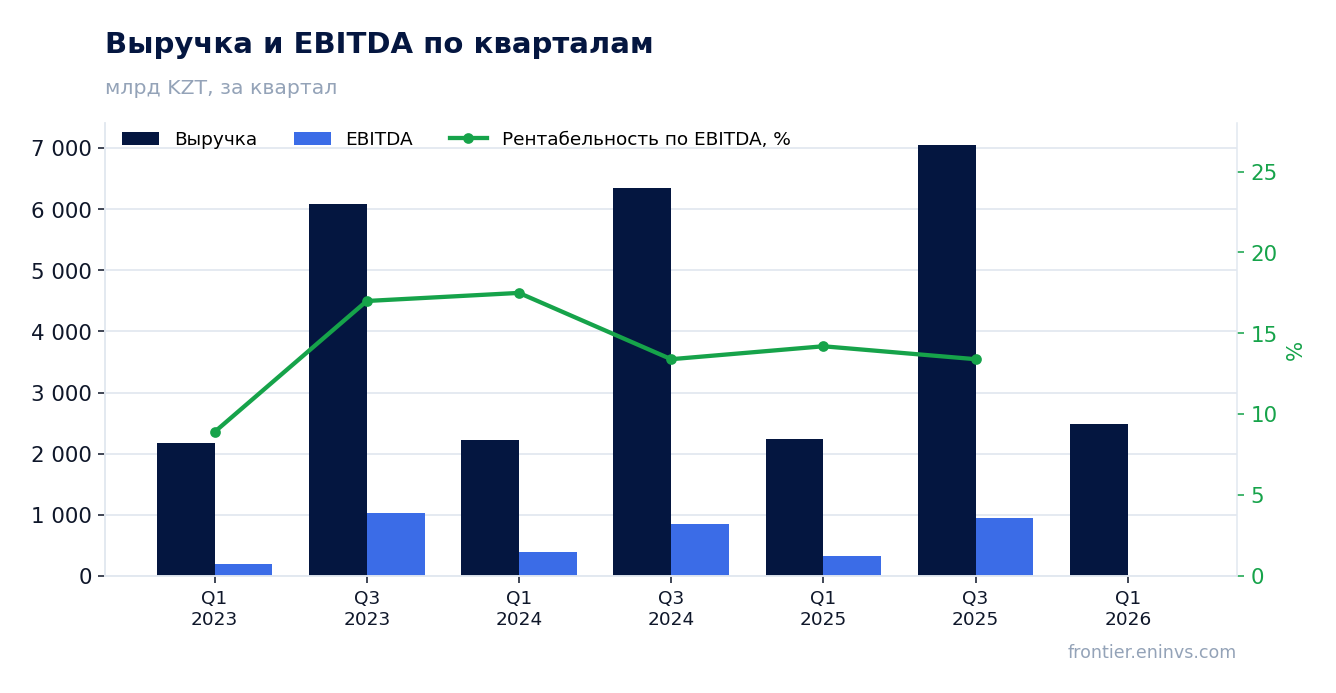
— EBITDA выросла на 33% до 775 млрд тенге, но скорректированная EBITDA – лишь на 6,8% до 591 млрд тенге
— Свободный денежный поток стал отрицательным: минус 78 млрд тенге против плюс 283 млрд годом ранее
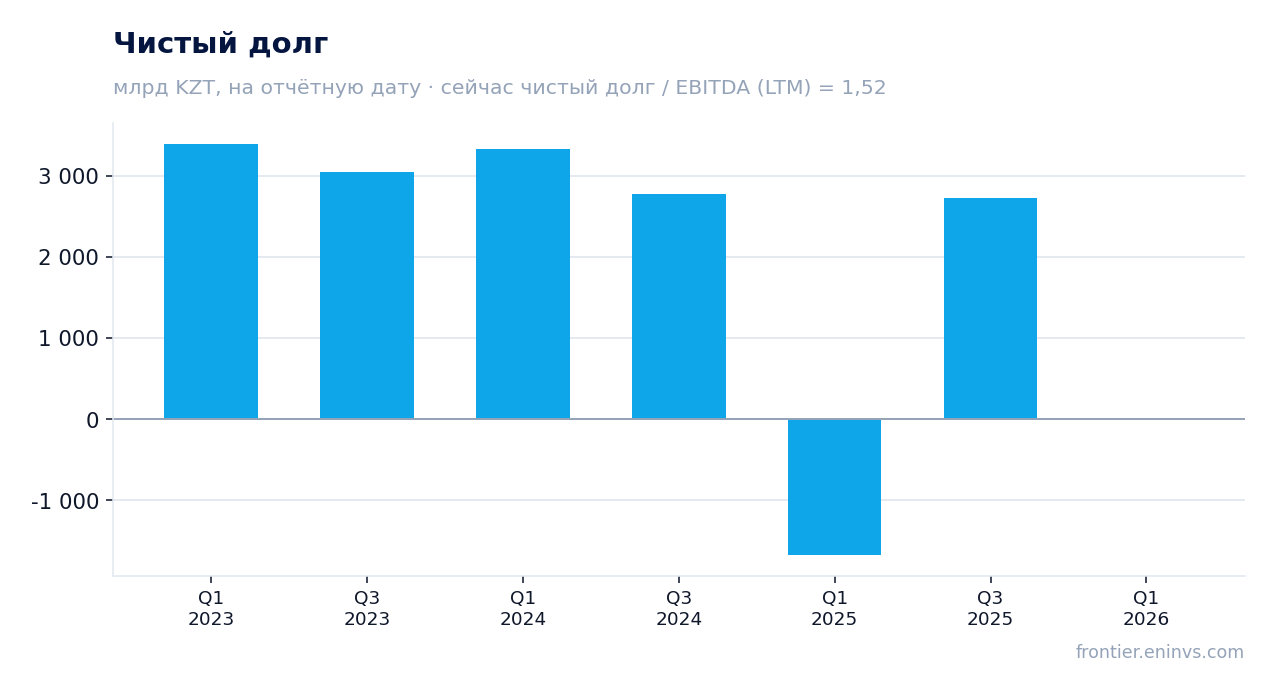
— Чистый долг вырос на 52,7% за квартал до 573 млрд тенге, но отношение к EBITDA – 1,52 – остаётся умеренным
— Дивидендная доходность за 12 месяцев – 1,63%, что ниже ключевой ставки, и выплаты зависят от денежных потоков СП
— По модели портала акция имеет потенциал +61% к справедливой стоимости
Оценка привлекательности
Ключевые показатели, млрд KZT
| Показатель | Q1 2025 | Q1 2026 | Изм. |
|---|---|---|---|
| Выручка | 2 241 | 2 481 | +10,7% |
| EBITDA | 318 | — | — |
| Операционная прибыль | 137 | — | — |
| Чистая прибыль | 197 | 373 | +89,8% |
| Операционный денежный поток | 427 | 0,28 | -99,9% |
| Рентабельность по EBITDA | 14,2% | — | — |
| Чистая маржа | 8,8% | 15,0% | +6,2 п.п. |
Чистая прибыль выросла на 89,8% до 373 млрд тенге, но почти половина – 196 млрд – это доля в прибыли совместных предприятий, а не денежный результат
В первом квартале 2026 года чистая прибыль КазМунайГаза составила 373 млрд тенге против 193 млрд годом ранее. Рост на 89,8% обеспечен более высокой выручкой, ростом доли в прибыли СП и ассоциированных компаний, снижением расходов на обесценение и финансовых затрат.
Однако из этой суммы 196 млрд тенге – доля в прибыли совместных предприятий, прежде всего ТШО и Мангистаумунайгаза. Это не денежный поток, а бухгалтерская доля. Без неё чистая прибыль составила бы 190 млрд тенге, что лишь на 15,9% выше прошлогоднего уровня.
Операционный денежный поток рухнул до 283 млн тенге из-за роста дебиторки и сдвига дивидендов от ТШО на апрель
Операционный денежный поток за первый квартал 2026 года составил всего 283 млн тенге против 427,5 млрд годом ранее. Компания объясняет это изменением оборотного капитала, включая рост дебиторской задолженности, и сдвигом сроков получения дивидендов от ТШО.
Дивиденды от ТШО в размере 140 млрд тенге поступили уже после отчётной даты – 29 апреля 2026 года. В прошлом году в первом квартале КМГ получил от СП 156 млрд тенге. Это разовое смещение, но оно сильно искажает квартальный денежный поток.
EBITDA выросла на 33% до 775 млрд тенге, но скорректированная EBITDA – лишь на 6,8% до 591 млрд тенге
EBITDA за первый квартал 2026 года составила 775 млрд тенге, что на 33% выше прошлогоднего уровня. Рост обеспечен увеличением выручки во всех сегментах и ростом доли в прибыли СП.
Однако скорректированная EBITDA, которая учитывает дивиденды от СП вместо доли в их прибыли, выросла лишь на 6,8% до 591 млрд тенге. Разница показывает, насколько результат зависит от бухгалтерской доли в СП, а не от реально полученных денег.
Свободный денежный поток стал отрицательным: минус 78 млрд тенге против плюс 283 млрд годом ранее
Свободный денежный поток в первом квартале 2026 года составил минус 78 млрд тенге против плюс 283 млрд годом ранее. Причина – резкое падение операционного потока и рост капитальных затрат на cash-основе до 237 млрд тенге (+64,3%).
Капзатраты на accrual-основе, напротив, снизились на 10% до 116 млрд тенге. Расхождение связано с закупками оборудования для дочерних проектов, в том числе для KMG PetroChem и Казахского газоперерабатывающего завода.
Чистый долг вырос на 52,7% за квартал до 573 млрд тенге, но отношение к EBITDA – 1,52 – остаётся умеренным
На конец марта 2026 года чистый долг КМГ составил 573 млрд тенге против 375 млрд на конец 2025 года. Рост на 52,7% объясняется снижением денежных средств и депозитов, которые ушли на финансирование инвестпроектов дочерних компаний, а также валютной переоценкой.
Отношение чистого долга к EBITDA за последние 12 месяцев – 1,52. Это умеренный уровень, хотя направление изменения неизвестно – ранее значение не приводилось. Валовый долг практически не изменился: 3 504 млрд тенге против 3 522 млрд.
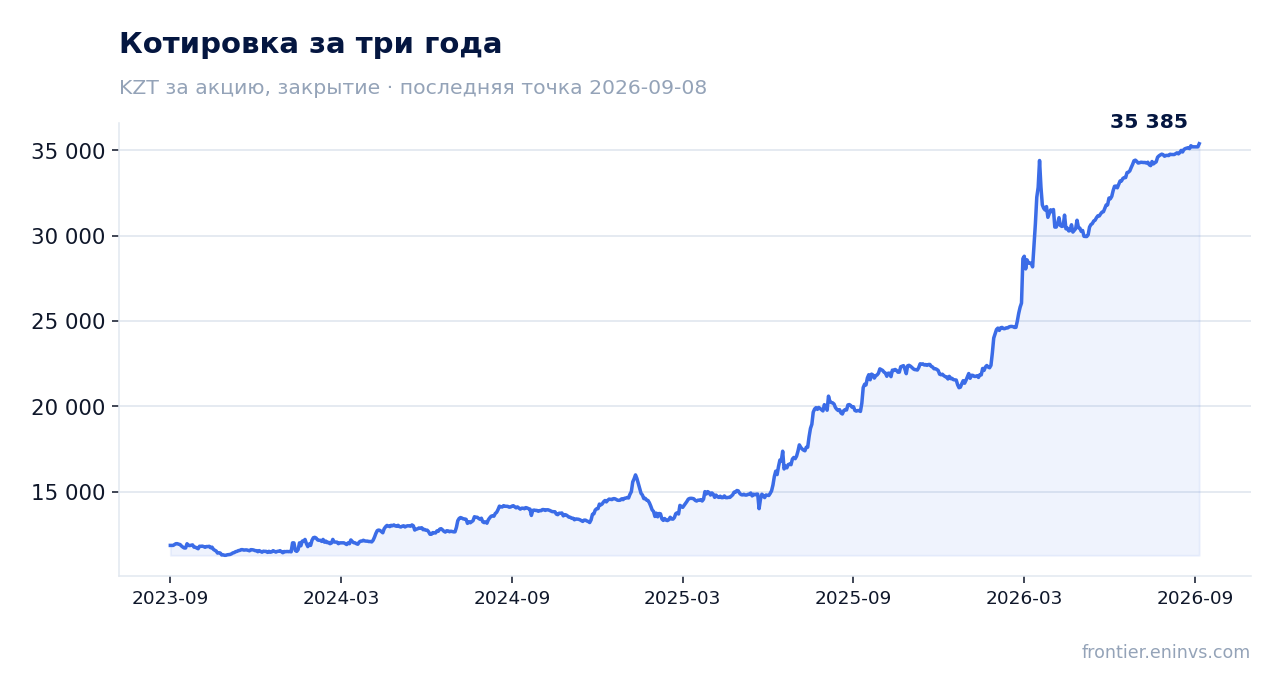
Дивидендная доходность за 12 месяцев – 1,63%, что ниже ключевой ставки, и выплаты зависят от денежных потоков СП
За последние 12 месяцев дивидендная доходность КМГ составила 1,63% – заметно ниже ключевой ставки. Это типично для компаний с контролем государства, но ограничивает привлекательность бумаги для инвесторов, ориентированных на доход.
Выплаты зависят от денежных потоков, в том числе от дивидендов СП. В первом квартале 2026 года КМГ получил от СП лишь 12 млрд тенге против 156 млрд годом ранее – основной платёж ТШО пришёл уже в апреле. Если подобные сдвиги повторятся, свободный денежный поток будет волатильным, что создаёт риск для дивидендов.
По модели портала акция имеет потенциал +61% к справедливой стоимости
Наша модель пересчитывает EBITDA по текущим ценам на нефть и сравнивает с целевым мультипликатором EV/EBITDA. По модели портала, потенциал роста акции к справедливой стоимости составляет +61%.
Текущие мультипликаторы: P/E за последние 12 месяцев – 18,7, EV/EBITDA – 15,5. Это умеренные значения для нефтяной компании с госучастием, особенно с учётом того, что цена Brent в первом квартале 2026 года была в среднем 81,1 доллара за баррель.
Оценка по последним отчётным данным
| Метрика | Значение |
|---|---|
| Капитализация | 23 312 млрд KZT |
| P/E (LTM) | 18,7 |
| EV/EBITDA (LTM) | 15,5 |
| P/B | 1,87 |
| Чистый долг / EBITDA | 1,52 |
| Операционный денежный поток (LTM) | 1 900 млрд |
| ROE | 8,5% |
| Дивидендная доходность (12 мес) | 1,6% |
Итог
Квартал силён по бухгалтерским показателям: выручка и чистая прибыль выросли двузначными темпами, EBITDA – на треть. Но операционный денежный поток почти обнулился, свободный поток ушёл в минус, а рост прибыли наполовину обеспечен долей в СП, которая не приносит денег в этом квартале. Долговая нагрузка умеренная, дивидендная доходность низкая. Главный вопрос для держателя – когда денежные потоки от СП начнут приходить равномерно и не придётся ли финансировать инвестпрограмму за счёт долга. При текущей цене и потенциале +61% по модели портала акция выглядит скорее привлекательно.
Перейти к финансовой карточке компании KMGZ →
Смотрите также: обзор рынка · карта оценки рынков · скринеры акций