KazTransOil: H1 profit up 36%, but the real question is whether cash will cover dividends after capex
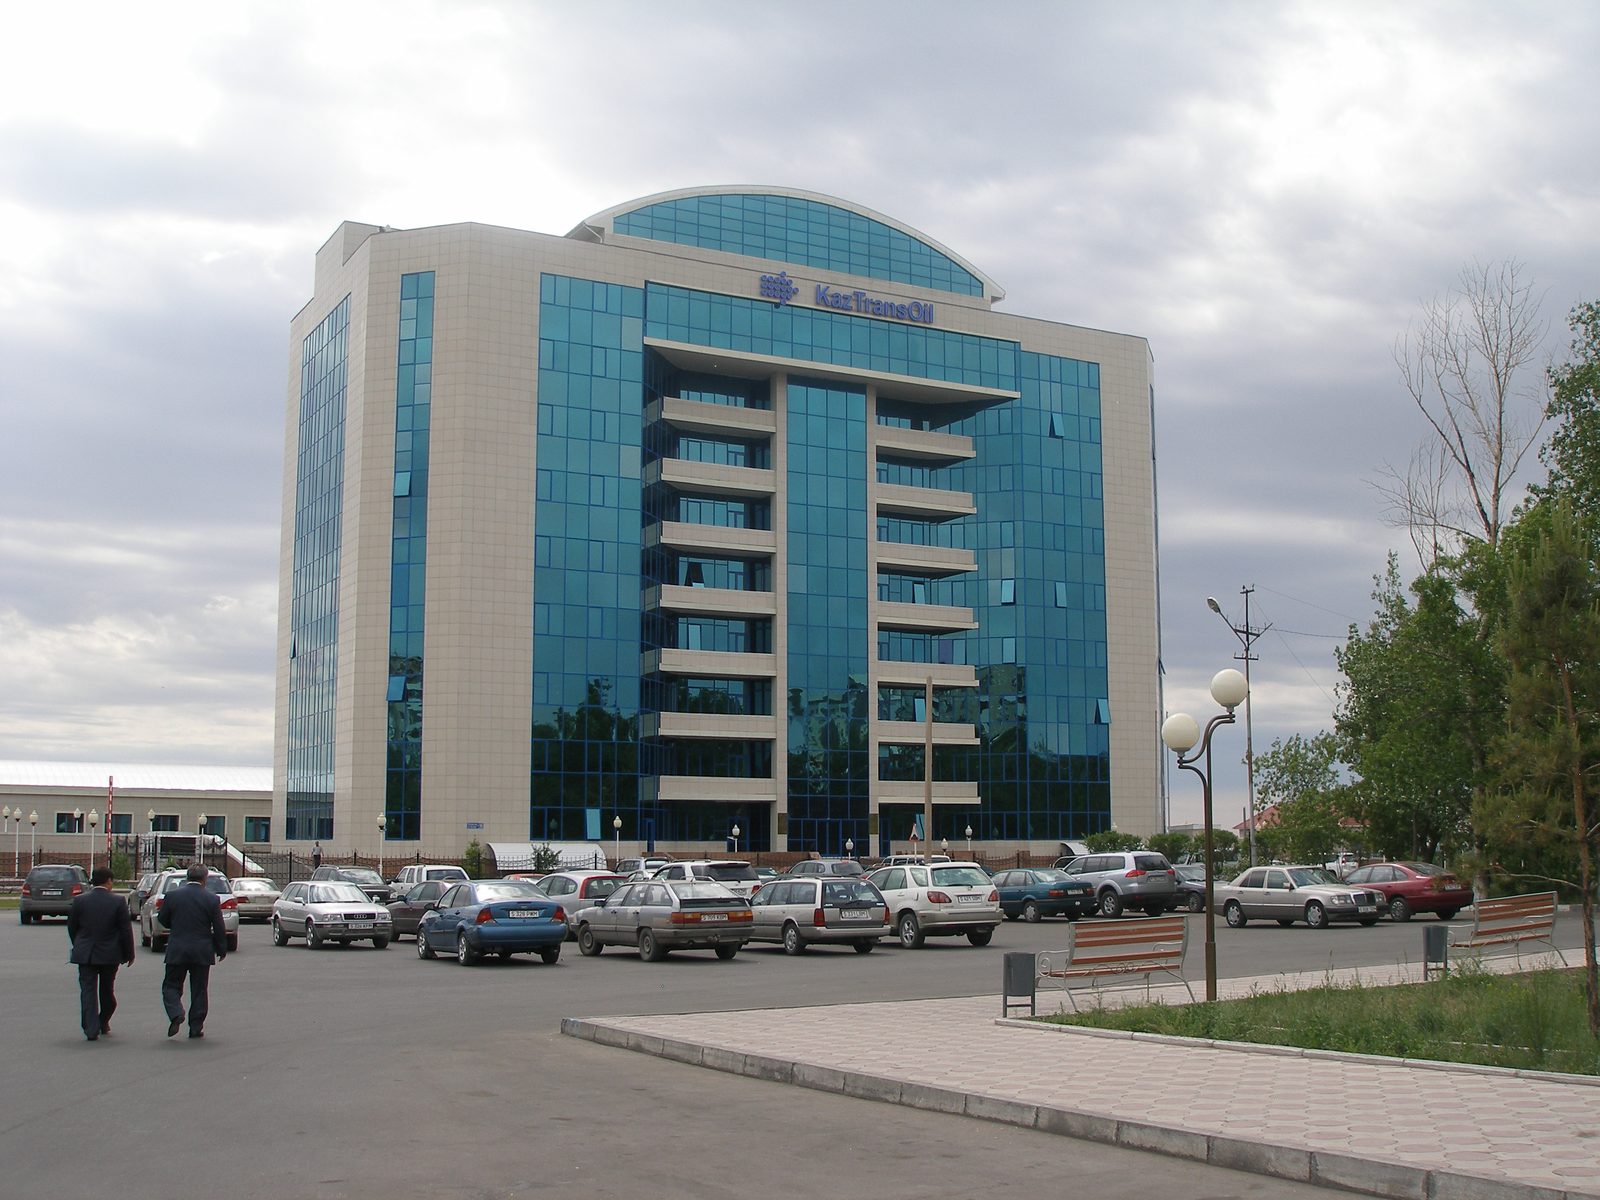
On August 28, KazTransOil reported H1 2026 results. Revenue rose 10.3% to KZT 374.2bn, EBITDA grew 15.7%, and net profit jumped 36.3% to KZT 61.0bn. At the current price, the share looks rather attractive: multiples are low, dividend yield is around 10%, but free cash flow after capex remains under pressure.
Key takeaways
— H1 revenue grew 10.3% on higher tariffs and volumes
— EBITDA margin widened to 34.4% from 32.8% a year earlier
— H1 net profit rose 36.3%, helped by one-off gains from bond modification
— Leverage remains low: net debt is negative, net debt/EBITDA at -0.1
— Capex for H1 was KZT 16.9bn, but free cash flow is still positive
— Dividend for 2025 was KZT 118 per share, yield around 10%
— The stock trades at P/E of 8.9 and EV/EBITDA of 4.0 — below its own history
Attractiveness
Key figures, KZT bn
| Metric | H1 2025 | H1 2026 | Change |
|---|---|---|---|
| Revenue | 163 | 180 | +10.3% |
| EBITDA | 53.4 | 61.8 | +15.7% |
| Operating profit | 21.0 | 22.4 | +6.7% |
| Net profit | 21.6 | 29.4 | +36.3% |
| Operating cash flow | 41.0 | 62.2 | +51.5% |
| Capex | 26.2 | — | — |
| EBITDA margin | 32.8% | 34.4% | +1.6 pp |
| Net margin | 13.2% | 16.3% | +3.1 pp |
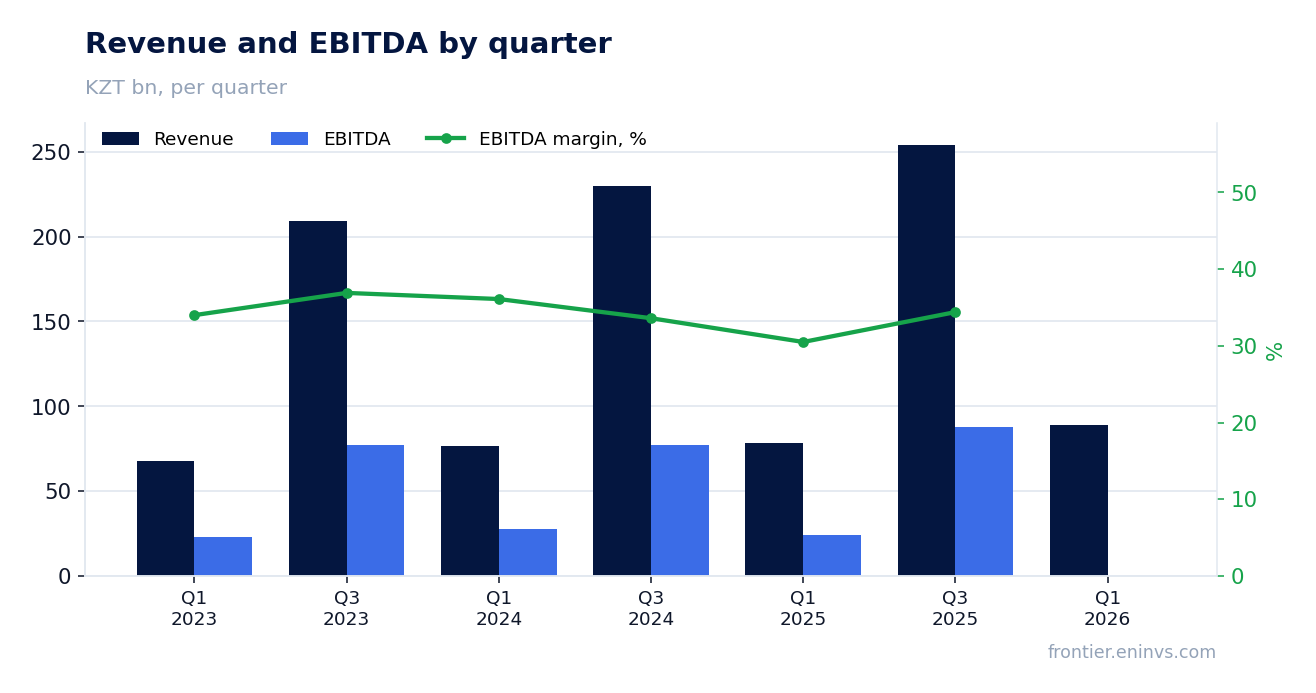
H1 revenue grew 10.3% on higher tariffs and volumes
For H1 2026, KazTransOil's revenue reached KZT 374.2bn, up 10.3% from the same period a year earlier. Growth was driven by both higher tariffs and increased transportation volumes. In particular, from January 1, 2026, the export tariff rose to KZT 4,963.25 per tonne per 1,000 km, and from June 1, 2026, to KZT 12,500 per tonne per 1,000 km.
Quarterly dynamics are also positive: in Q2 2026, revenue grew 14.1% YoY, accelerating from Q1's +1.9%. This suggests that tariff hikes and volume growth continue to support the top line.
EBITDA margin widened to 34.4% from 32.8% a year earlier
EBITDA for H1 2026 grew 15.7% YoY, and the EBITDA margin widened to 34.4% from 32.8% a year earlier. The margin expansion stems from revenue growing faster than operating costs, typical for a regulated monopolist when tariffs rise.
In Q2 2026, EBITDA, based on our calculations from quarterly data, was about KZT 43.6bn, up 10.5% YoY. This confirms the sustainability of operational efficiency.
H1 net profit rose 36.3%, helped by one-off gains from bond modification
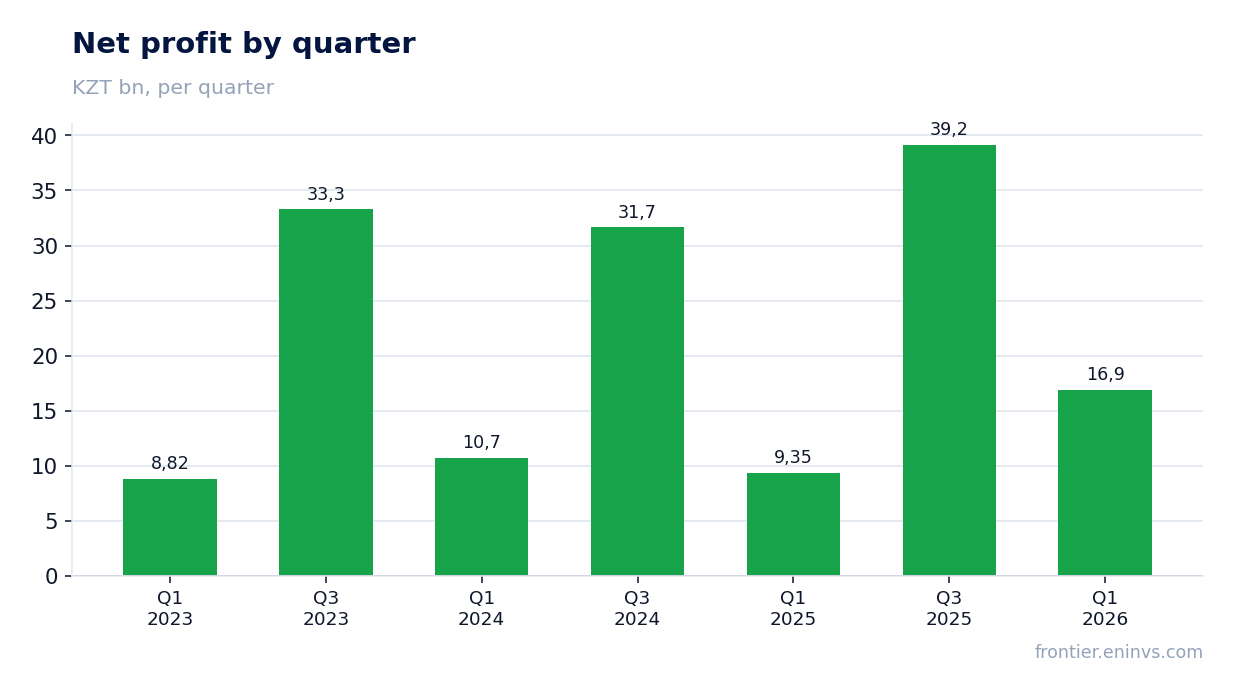
Net profit for H1 2026 reached KZT 61.0bn, up 36.3% YoY. Profit growth significantly outpaced EBITDA growth, explained by a one-off gain of KZT 3.9bn recognized in Q1 from the modification of Main Waterline bonds — deferring principal repayments to 2032–2033.
Excluding this one-off, net profit would have grown by about 28%, still a strong result. In Q2 2026, net profit was KZT 16.9bn, up 14.1% YoY, without significant one-offs.
Leverage remains low: net debt is negative, net debt/EBITDA at -0.1
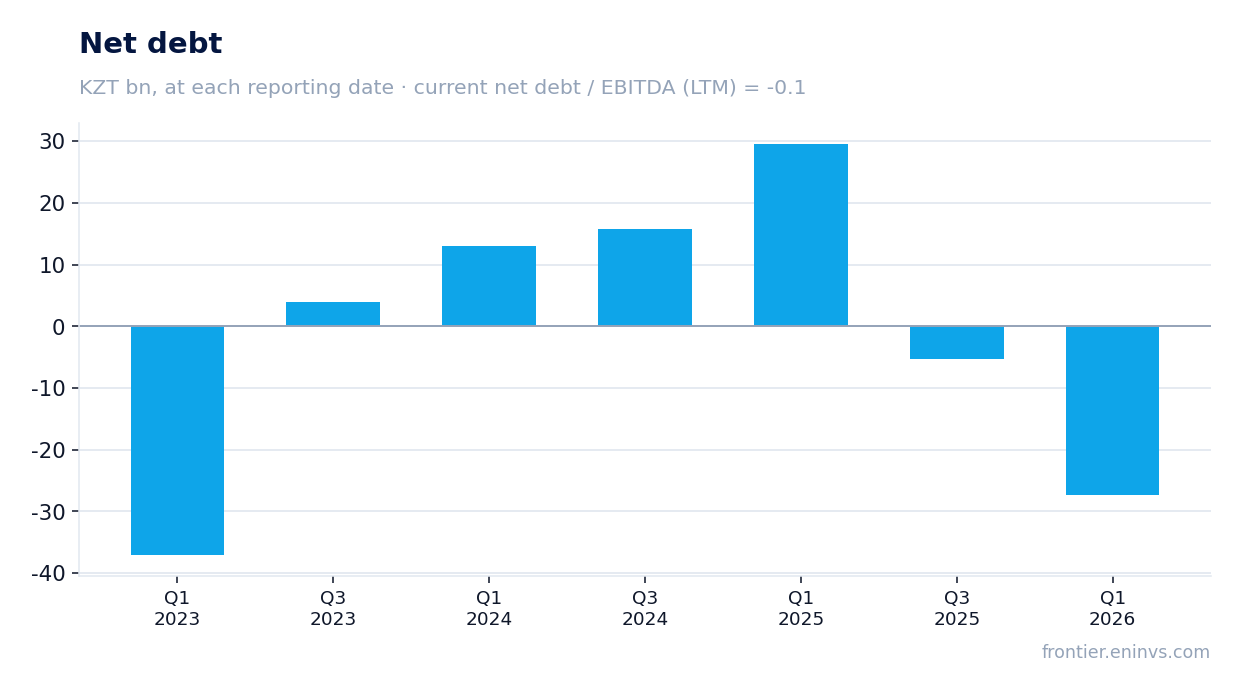
As of end-June 2026, KazTransOil's net debt is negative at minus KZT 12.1bn, meaning cash exceeds debt. Net debt to EBITDA for the last twelve months is minus 0.1 — the company has virtually no net debt.
Over the last 12 months, net debt decreased by KZT 35.8bn, reflecting strong operating cash flow and moderate capex. The company continues to generate excess liquidity despite its investment program.
Capex for H1 was KZT 16.9bn, but free cash flow is still positive
Operating cash flow for the last twelve months was KZT 109.8bn, and capex for H1 2026 was KZT 16.9bn. Even with seasonality, when major repairs occur in H2, free cash flow remains positive.
For H1 2026, operating cash flow was KZT 31.6bn, more than covering capex. This is important for assessing the company's ability to pay dividends.
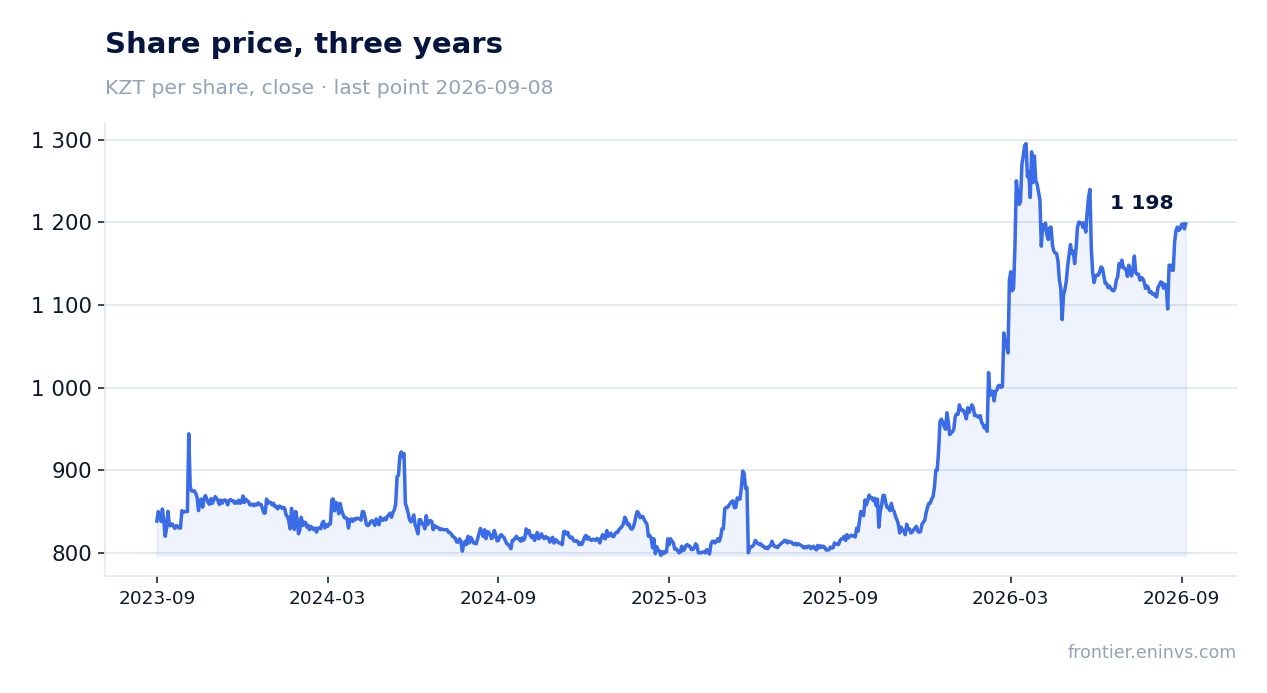
Dividend for 2025 was KZT 118 per share, yield around 10%
For 2025, KazTransOil paid dividends of KZT 118 per share, corresponding to a dividend yield of about 9.8% at the current price. This is above the average yield of recent years and comparable to the key rate.
Our estimated dividend for 2026, based on current profit and payout policy, is about KZT 120–130 per share, implying a yield of about 10–11%. However, the payment will depend on maintaining profitability and capex in H2.
A risk to the dividend is a potential increase in the investment program or tariff cuts, but current indicators point to sufficient cash flow.
The stock trades at P/E of 8.9 and EV/EBITDA of 4.0 — below its own history
At the current market cap of KZT 473.6bn, the stock trades at a trailing P/E of 8.9 and EV/EBITDA of 4.0. These multiples are in the lower part of the company's three-year historical range, indicating undervaluation relative to its own history.
Low leverage and stable cash flow make the valuation even more attractive. Even without dividends, the upside potential is significant if the company maintains its current momentum.
Valuation on the latest reported figures
| Metric | Value |
|---|---|
| Market cap | 474 bn KZT |
| P/E (LTM) | 8.9 |
| EV/EBITDA (LTM) | 4.0 |
| P/B | 0.41 |
| Net debt / EBITDA (LTM) | -0.10 |
| Operating cash flow (LTM) | 110 bn |
| ROE | 4.4% |
| Dividend yield (12m) | 9.8% |
Bottom line
KazTransOil reported stronger-than-expected H1: revenue and EBITDA are growing at double-digit rates, margins are expanding, and net profit received an additional boost from one-off income. Leverage is minimal, and a dividend yield of around 10% makes the stock attractive for income-oriented investors. However, part of the profit is driven by one-offs, and capex may increase in H2. At the current valuation (P/E 8.9, EV/EBITDA 4.0), the stock trades below its own history, leaving upside potential. Verdict: rather attractive.
Open the company's financial profile KZTO →
See also: market overview · valuation map · stock screeners