MX_AC: revenue accelerated to +5.9%, but profit lagged on higher costs

On 30 October MX_AC released its results for the third quarter of 2026. Revenue reached 66,613.0 million MXN, up 5.9% year on year after +0.1% in the prior quarter, operating profit came in at 10,851.0 million MXN, and net profit was 5,054.3 million MXN, down 4.8% from a year earlier. The acceleration in revenue is the main positive of the report, but the decline in profit and the drop in net margin to 7.6% from 8.4% show that growth is costing the company more. With EV/EBITDA at 7.7 versus its own three-year average of 7.3 and the portal model implying -4% upside, the share looks neutral.
Key takeaways
— Revenue accelerated to +5.9% year on year from +0.1% in the prior quarter, but profit did not follow
— Net profit fell 4.8% while revenue rose 5.9%, and the net margin dropped to 7.6% from 8.4%
— Operating cash flow of 11,315.0 million MXN comfortably covered capital expenditure of 2,840.9 million MXN
— Net debt fell to 10,015.0 million MXN from 34,856.2 million MXN at the end of June
— Leverage at 0.19x LTM EBITDA remains low and poses no risk to the dividend
— A dividend yield of 4.4% on trailing twelve-month payments looks moderate
— EV/EBITDA at 7.7 is in line with its own three-year average of 7.3, and the portal model implies -4%
Attractiveness
Key figures, MXN bn
| Metric | Q3 2025 | Q3 2026 | Change |
|---|---|---|---|
| Revenue | 62.9 | 66.6 | +5.9% |
| EBITDA | 12.8 | — | — |
| Operating profit | 10.3 | 10.9 | +5.1% |
| Net profit | 5.31 | 5.05 | -4.8% |
| Operating cash flow | 11.8 | 11.3 | -4.1% |
| Capex | 3.63 | -2.84 | -178.3% |
| EBITDA margin | 20.4% | — | — |
| Net margin | 8.4% | 7.6% | -0.8 pp |
Revenue accelerated to +5.9% year on year from +0.1% in the prior quarter, but profit did not follow
In the third quarter of 2026, MX_AC's revenue reached 66,613.0 million MXN, up 5.9% from a year earlier. This marks a clear acceleration from the second quarter, when growth was just +0.1%. The company managed to reverse the sluggish trend of the early year, and the quarterly figure was the highest in the last four quarters.
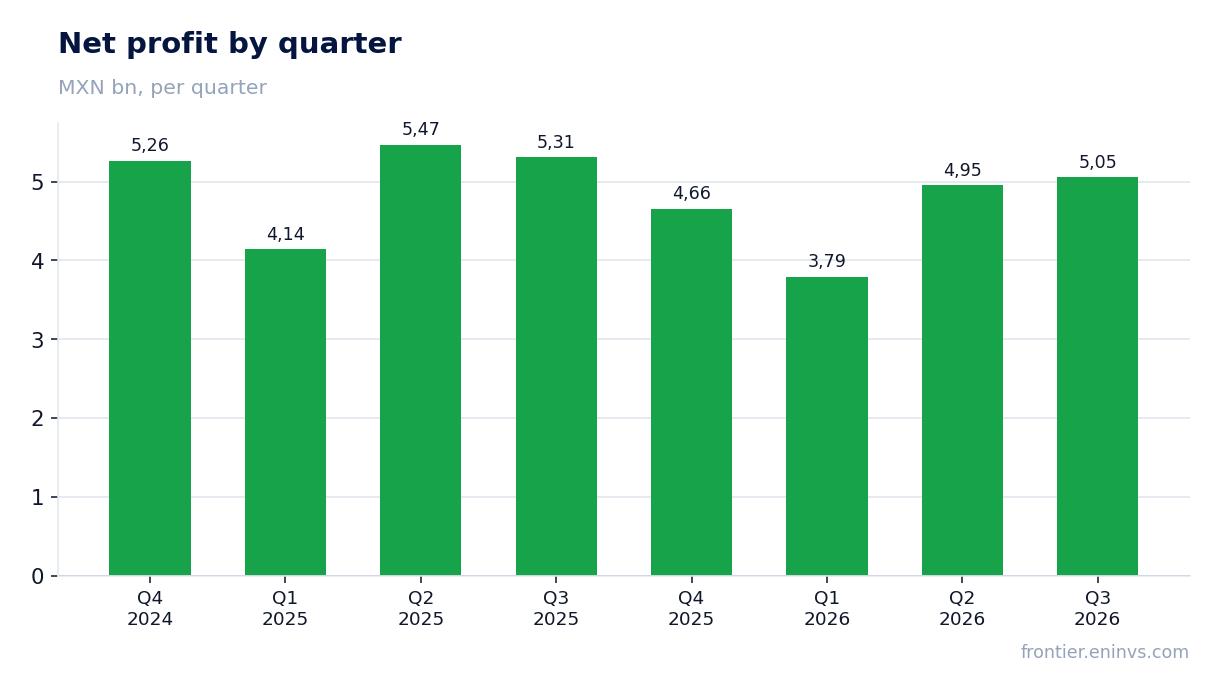
However, the revenue acceleration did not translate into profit. Net profit for the reported quarter was 5,054.3 million MXN, down 4.8% year on year. The net margin fell to 7.6% from 8.4% a year earlier. This means that revenue growth was accompanied by faster growth in costs, which ate into the benefits of scale.
Operating profit, meanwhile, rose to 10,851.0 million MXN from 10,323.8 million MXN a year earlier, or 5.1%. Thus, the pressure on net profit came not from operations but from below the operating line – likely from financial expenses or taxation. Without detailed breakdown in the facts, the exact cause cannot be identified, but the divergence between operating and net profit dynamics is evident.
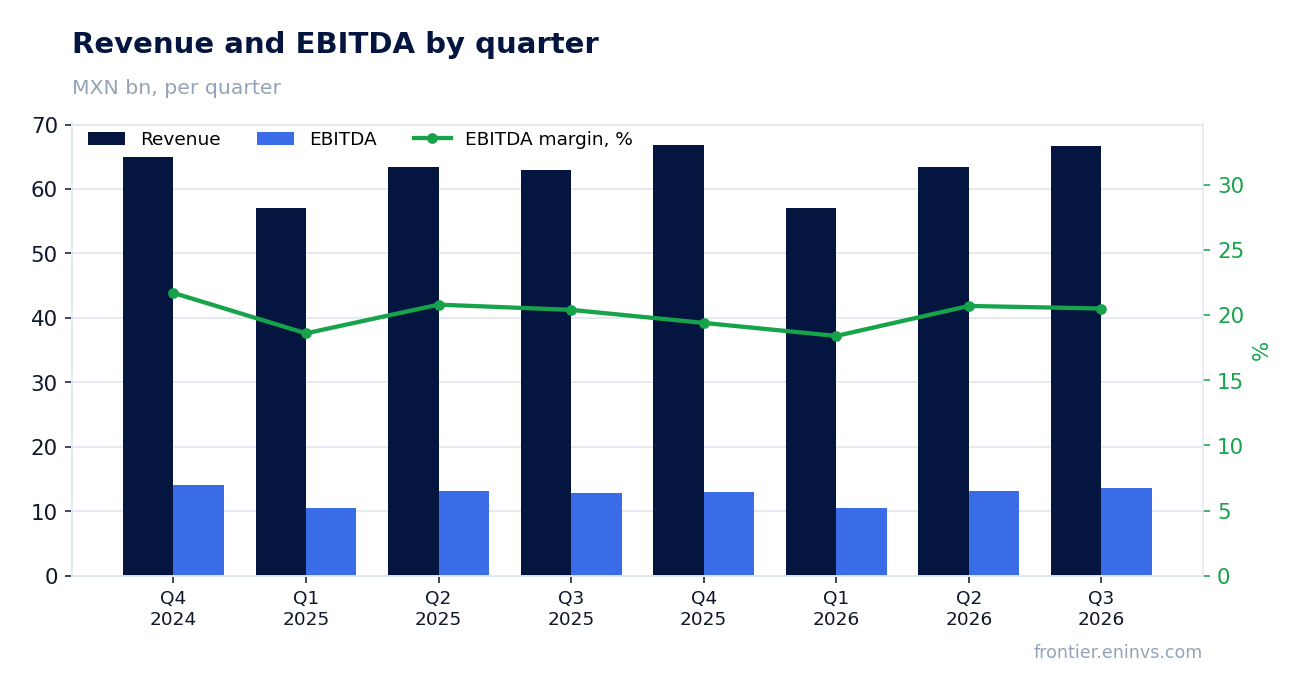
Net profit fell 4.8% while revenue rose 5.9%, and the net margin dropped to 7.6% from 8.4%
The 4.8% decline in net profit alongside 5.9% revenue growth indicates that the company faced rising costs or other expenses not directly tied to revenue. The net margin of 7.6% is noticeably below the 8.4% of a year earlier. This gap could be due to higher financial expenses, increased tax burden, or one-off factors not disclosed in the provided data.
Operating profit rose 5.1%, almost in line with revenue, suggesting stable operating efficiency. The main pressure on net profit thus forms below the operating line. This is an important signal: if the pressure comes from interest expenses, the reduction in debt could ease it in the future. If the cause is taxes or one-off write-offs, the effect may be temporary.
For the investor, the key question is whether the profit decline is one-off or persistent. There is not yet enough data for a definitive conclusion, but the combination of accelerating revenue and falling profit warrants attention to the details of the next report, where the cost structure may be revealed.
Operating cash flow of 11,315.0 million MXN comfortably covered capital expenditure of 2,840.9 million MXN
In the third quarter of 2026, operating cash flow was 11,315.0 million MXN, significantly exceeding capital expenditure of 2,840.9 million MXN. Free cash flow thus remains solidly positive, giving the company the ability to fund dividends and reduce debt without raising new capital.
Capital expenditure in the reported quarter was relatively low – about 4.3% of revenue. This may indicate that the company is not undertaking major investment projects at the moment, or has completed a previous investment cycle. For shareholders, this is a positive signal, as released funds can be directed toward payouts.
It is worth noting that operating cash flow exceeds net profit by more than twofold, which may be explained by depreciation and other non-cash items. This is normal for a capital-intensive business, but requires monitoring to ensure that profit growth is not achieved through increased debt or asset sales.
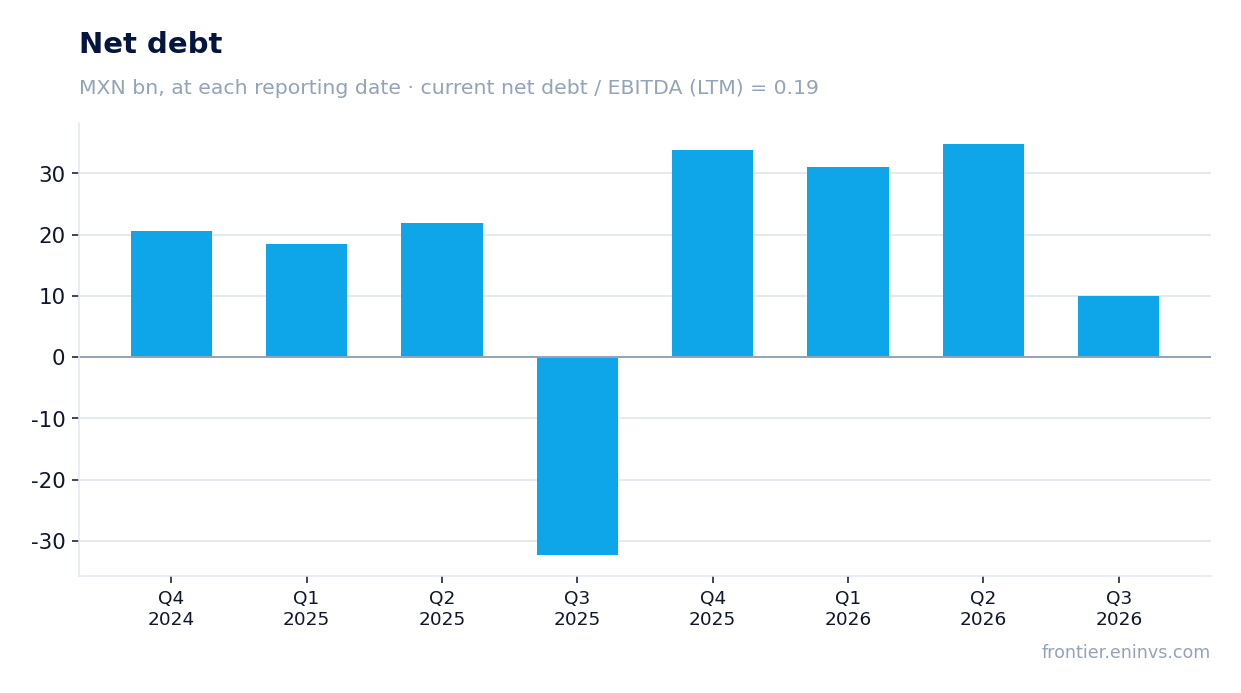
Net debt fell to 10,015.0 million MXN from 34,856.2 million MXN at the end of June
At the end of the third quarter of 2026, MX_AC's net debt stood at 10,015.0 million MXN, down 24,841.2 million MXN from 34,856.2 million MXN on 30 June 2026. This significant reduction could have been achieved through strong operating cash flow as well as possible debt repayment or changes in the balance sheet structure.
Compared with 30 September 2025, when net debt was negative at -32,348.4 million MXN, the current level of 10,015.0 million MXN represents an increase of 42,363.4 million MXN over the year. This is an important shift: the company moved from a net cash position to net debt, which may reflect both investment activity and changes in dividend policy.
Nevertheless, the net debt / LTM EBITDA ratio is only 0.19, indicating low leverage. Such a level does not pose significant risks to financial stability and leaves room for further shareholder payouts or investments.
Leverage at 0.19x LTM EBITDA remains low and poses no risk to the dividend
The net debt / LTM EBITDA ratio at the end of the third quarter of 2026 is 0.19. This is a very low level, indicating that the company could repay all its net debt in less than a quarter of annual EBITDA. For comparison, many capital-intensive companies consider a level of 1.5–2.0 comfortable, so MX_AC has a significant margin of safety.
Low leverage is important in the context of dividend payments. With LTM EBITDA of 53,403.9 million MXN and net debt of 10,015.0 million MXN, the company can afford to maintain or increase dividends even with a temporary decline in profit. Interest expenses are likely small, which also supports net profit.
However, it is worth remembering that a year ago the company had negative net debt, i.e., a net cash position. The current debt level, though low, means the balance sheet has become less conservative. If the company continues to increase debt to finance investments or payouts, this could gradually increase leverage, but for now it is far from alarming levels.
A dividend yield of 4.4% on trailing twelve-month payments looks moderate
MX_AC's dividend yield over the last 12 months is 4.4%. This is a moderate level that may appeal to income-oriented investors, but it does not stand out against current rates. The company has paid dividends over the last 12 months, confirming its commitment to returning capital to shareholders.
Our estimate for the current year's dividend assumes the payout ratio and profit remain at the levels of the last 12 months. However, the 4.8% decline in net profit in the third quarter may limit payout growth. If pressure on profit persists, the dividend may stay flat or grow only marginally.
The 4.4% yield looks sustainable thanks to low leverage and strong cash flow. The main risk to the dividend would be a significant drop in profit or a rise in capital expenditure, but free cash flow currently covers payments with a margin.
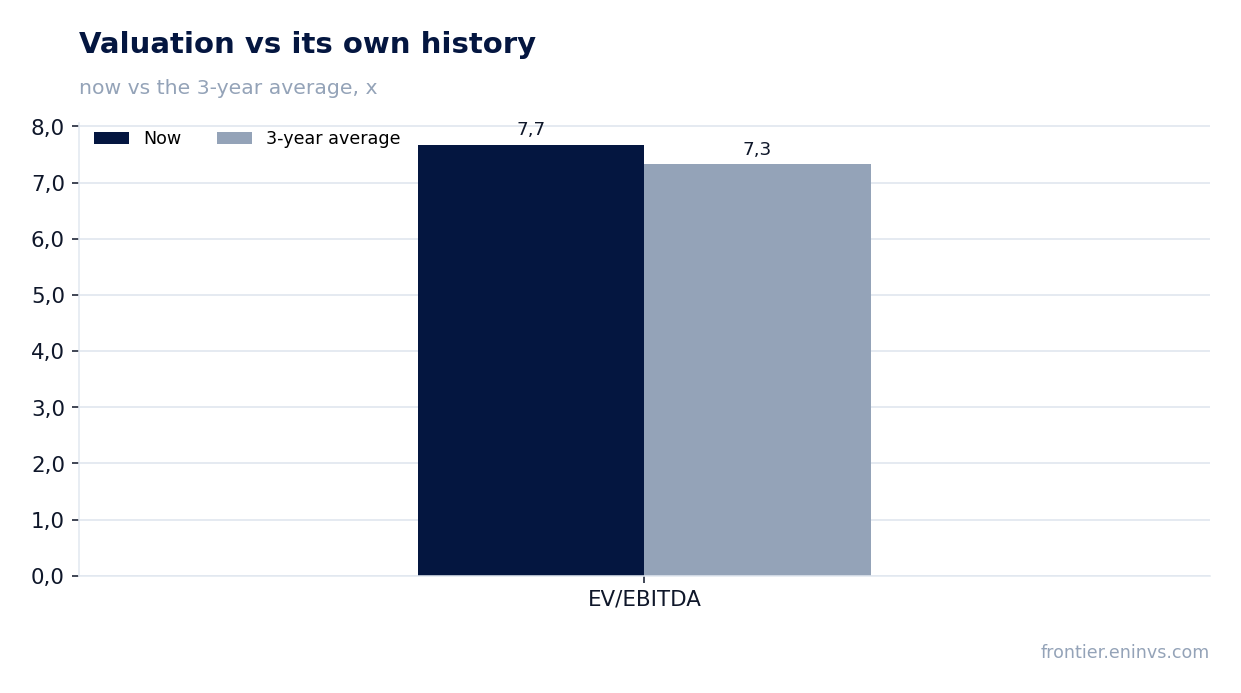
EV/EBITDA at 7.7 is in line with its own three-year average of 7.3, and the portal model implies -4%
The LTM EV/EBITDA multiple for MX_AC is 7.7, which is virtually in line with its own three-year average of 7.3. The difference is within 5%, so the stock is valued by the market similarly to its average over the past three years. This means the current valuation gives no clear signal of undervaluation or overvaluation.
Our fundamental model, based on EBITDA growth and a target multiple, implies a -4% upside to fair value. This is a moderately negative signal, indicating that the current price is somewhat above what the model justifies. However, the deviation is small and could be offset by the dividend yield.
For comparison, the LTM P/E is 20.4, which looks fairly high given a 7.6% net margin and revenue growth of about 6%. Investors are paying generously for earnings, which could only be justified by an acceleration in profit growth in the future. For now, profit dynamics do not support such a valuation.
Valuation on the latest reported figures
| Metric | Value |
|---|---|
| Market cap | 376 bn MXN |
| P/E (LTM) | 20.4 |
| EV/EBITDA (LTM) | 7.7 |
| P/B | 2.30 |
| Net debt / EBITDA (LTM) | 0.19 |
| Operating cash flow (LTM) | 37.6 bn |
| ROE | 13.5% |
| Dividend yield (12m) | 4.4% |
| EV/EBITDA, 3-year average | 7.3 |
Bottom line
The main achievement of the quarter is the acceleration in revenue to +5.9% year on year after near-zero growth in the prior quarter. However, profit did not follow revenue: net profit fell 4.8% and the margin dropped to 7.6%. Cash flow remains strong and leverage is low, supporting the dividend. The valuation is in line with its own history, and the portal model implies -4%, so the share looks neutral. A move to a more positive verdict would require either sustained profit growth or a more attractive price.
Open the company's financial profile AC →
See also: market overview · valuation map · stock screeners