Grupo Bimbo: net profit up 21.6% while EBITDA margin contracts 2.1 pp

On 29 April Grupo Bimbo reported third-quarter 2026 results. Revenue came in at MXN 106,060.6 mn, down 1.0% year on year, EBITDA at MXN 16,835.4 mn (–12.7%) and net profit at MXN 4,108.5 mn (+21.6%). The EBITDA margin contracted to 15.9% from 18.0%, while the net margin rose to 3.9% from 3.2%. At an EV/EBITDA of 6.1 versus its own three-year average of 6.6 the stock trades below its history, but the operating margin compression and a –15% upside on the portal's model keep it from being attractive – the verdict is neutral.
Key takeaways
— Revenue fell 1.0% year on year, but the pace of decline eased from 2.2% a quarter earlier
— EBITDA dropped 12.7% and the margin contracted 2.1 pp to 15.9%
— Net profit rose 21.6% even as operating profit fell to MXN 11,247.2 mn
— Leverage at 2.09x EBITDA LTM – a level, with no direction implied
— Free cash flow supported by operating cash flow of MXN 15,299.3 mn
— Dividend yield of 1.74% with payouts covered by LTM profit
— EV/EBITDA of 6.1 is below its own three-year average of 6.6, but the portal model shows –15%
Attractiveness
Key figures, MXN bn
| Metric | Q3 2025 | Q3 2026 | Change |
|---|---|---|---|
| Revenue | 107 | 106 | -1.0% |
| EBITDA | 19.3 | 16.8 | -12.7% |
| Operating profit | 11.0 | 11.2 | +2.5% |
| Net profit | 3.38 | 4.11 | +21.6% |
| Operating cash flow | 13.3 | 15.3 | +15.0% |
| EBITDA margin | 18.0% | 15.9% | -2.1 pp |
| Net margin | 3.2% | 3.9% | +0.7 pp |
Revenue fell 1.0% year on year, but the pace of decline eased from 2.2% a quarter earlier
In the third quarter of 2026 revenue came in at MXN 106,060.6 mn, 1.0% below the same quarter a year earlier. The decline has now run for three consecutive quarters, but its pace is steadily easing: down 3.3% in the first quarter, 2.2% in the second and 1.0% now.
The dynamics are improving but remain negative. The company did not disclose a regional breakdown in the third-quarter release, so the source of the improvement – whether a recovery in North American volumes or a pricing component – cannot be identified from the available materials.
The next quarter matters for judging the trend: if the pace of decline keeps shrinking, revenue could turn positive. For now the top line remains under pressure, which limits operating leverage.
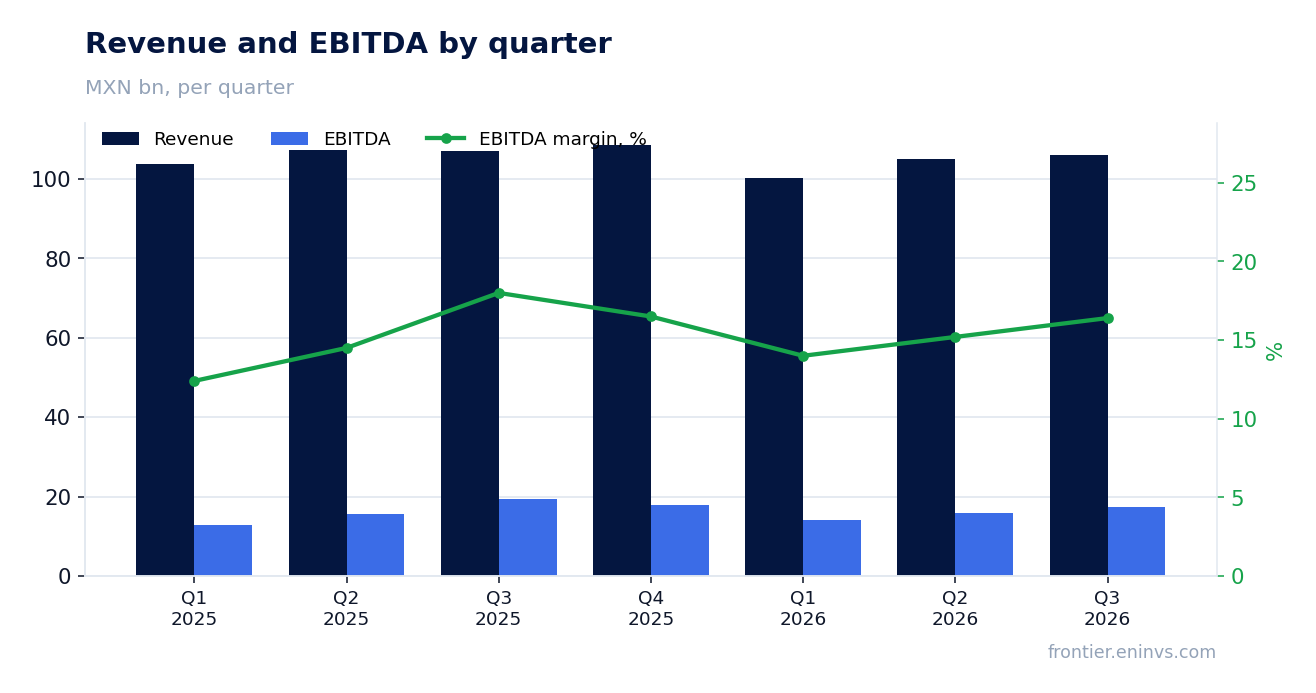
EBITDA dropped 12.7% and the margin contracted 2.1 pp to 15.9%
Third-quarter 2026 EBITDA came in at MXN 16,835.4 mn, down 12.7% year on year. The EBITDA margin contracted to 15.9% from 18.0% a year earlier – a fall of 2.1 percentage points.
Margin compression on an almost flat top line means costs grew faster than revenue. The third-quarter release does not break out expense lines, so the specific source of pressure – raw materials, labour or one-off items – is not disclosed.
Operating profit fell to MXN 11,247.2 mn from MXN 10,969.7 mn a year earlier, a decline of 2.5%. The gap between the EBITDA fall and the operating-profit move points to higher depreciation, typical of recent acquisitions and capital expansion.
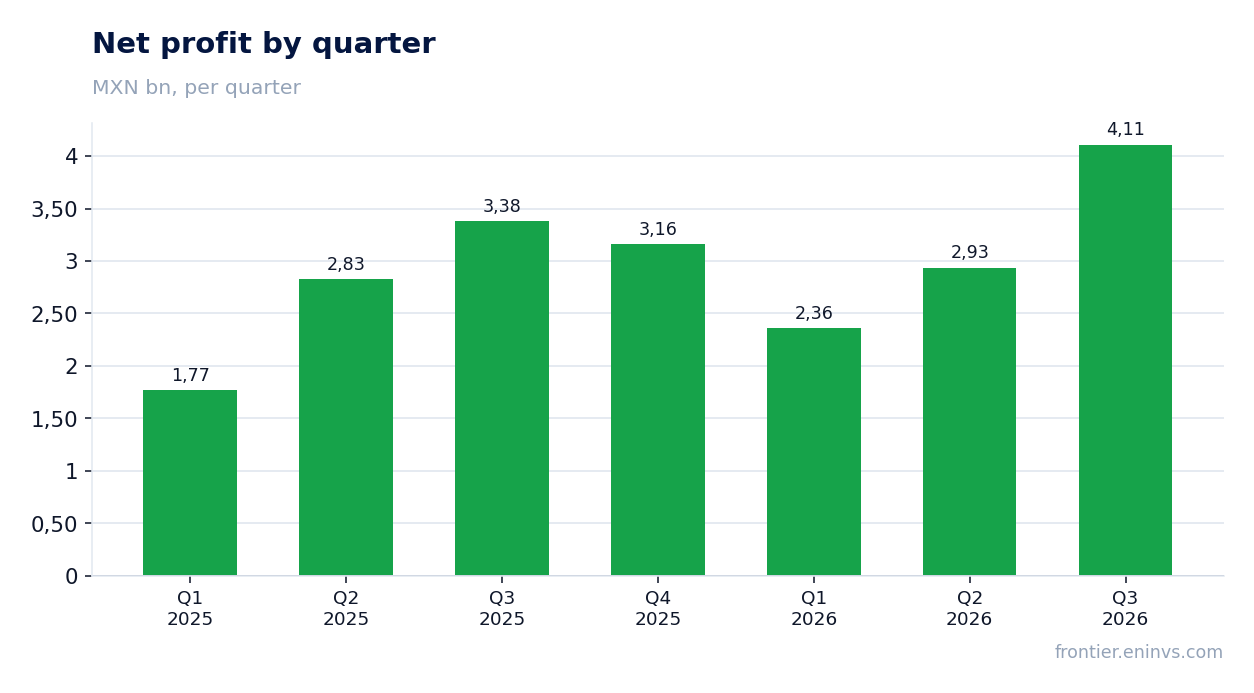
Net profit rose 21.6% even as operating profit fell to MXN 11,247.2 mn
Third-quarter 2026 net profit came in at MXN 4,108.5 mn, 21.6% above the same quarter a year earlier. The net margin rose to 3.9% from 3.2%.
Profit growth alongside a fall in operating profit to MXN 11,247.2 mn means the result was supported by items below the operating line – lower financing costs, the tax base or one-off factors. The third-quarter release does not disclose these details.
The gap between operating and net profit dynamics is the key question of earnings quality. If profit grew on one-off items, the durability of that growth is limited.
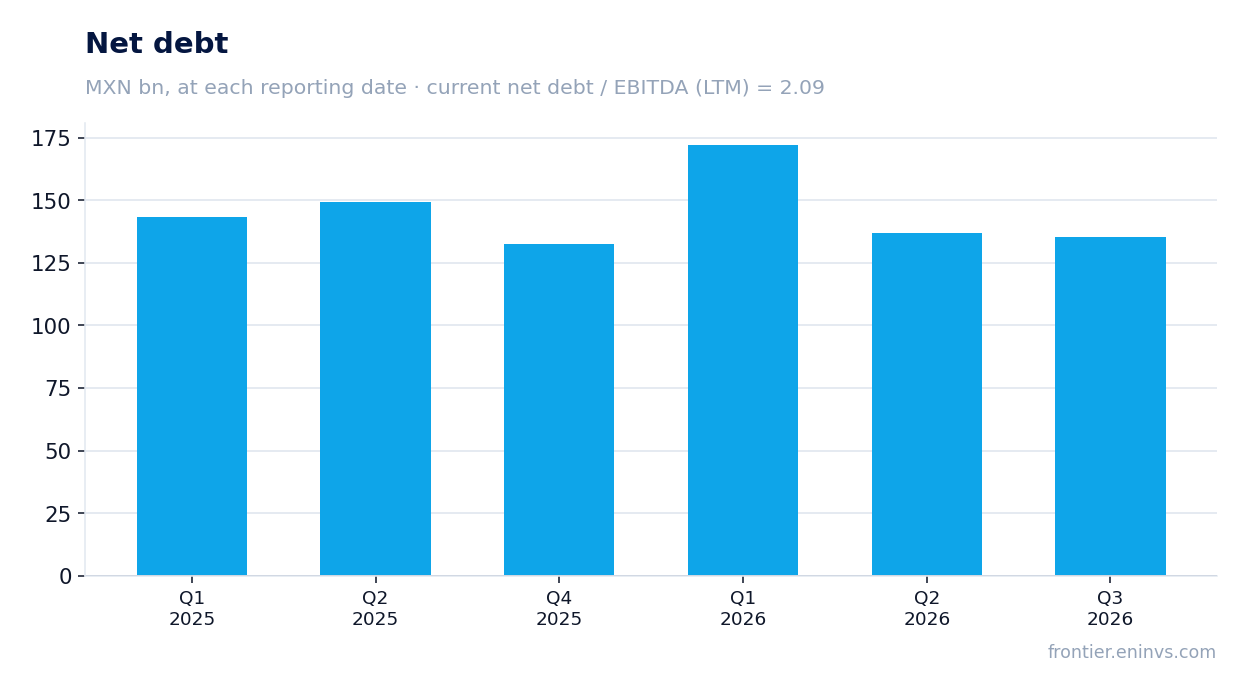
Leverage at 2.09x EBITDA LTM – a level, with no direction implied
Net debt at 30 September 2026 stood at MXN 135,342.9 mn, equal to 2.09x EBITDA over the trailing twelve months. This is a level of leverage, not an assessment of its direction: a comparable figure a year earlier is not in the facts.
Over the quarter net debt fell from MXN 137.1 bn at 30 June 2026 to MXN 135.3 bn at 30 September – a decline of MXN 1.8 bn. Over twelve months, from MXN 149.4 bn at 30 June 2025, the decline was MXN 14.1 bn.
LTM EBITDA of MXN 64,903.8 mn covers the debt, while the average cost of debt and the maturity profile are not disclosed in the third-quarter release. A level of 2.09x looks moderate for an issuer with this EBITDA base.
Free cash flow supported by operating cash flow of MXN 15,299.3 mn
Third-quarter 2026 operating cash flow came in at MXN 15,299.3 mn versus MXN 13,298.6 mn a year earlier – growth of 15.1%. This is a strong point of the report: cash generation is rising even as revenue falls.
Capital expenditure for the third quarter is not disclosed, so free cash flow in the strict sense cannot be calculated. In the second quarter of 2026 capex was MXN 4,154.2 mn, in the first MXN 2,743.2 mn.
Operating cash flow rising while EBITDA falls implies an improvement in working capital or lower cash taxes. The durability of that effect will determine whether the company can sustain cash generation while margin pressure persists.
Dividend yield of 1.74% with payouts covered by LTM profit
The trailing twelve-month dividend yield is 1.74%. With LTM net profit of MXN 12,563.3 mn and a market capitalisation of MXN 266,506.7 mn, payouts are covered by profit with a margin.
Our estimate for the current-year dividend assumes the payout ratio stays at a level covered by LTM profit. The key risk is one-off items in profit: if the 21.6% rise in third-quarter net profit stems from non-operating factors, the payout base could prove lower.
A yield of 1.74% is modest in absolute terms and provides little support to the share price. For an issuer with this level of debt and capital spending, the dividend is more a supplement to the growth story than the main argument.
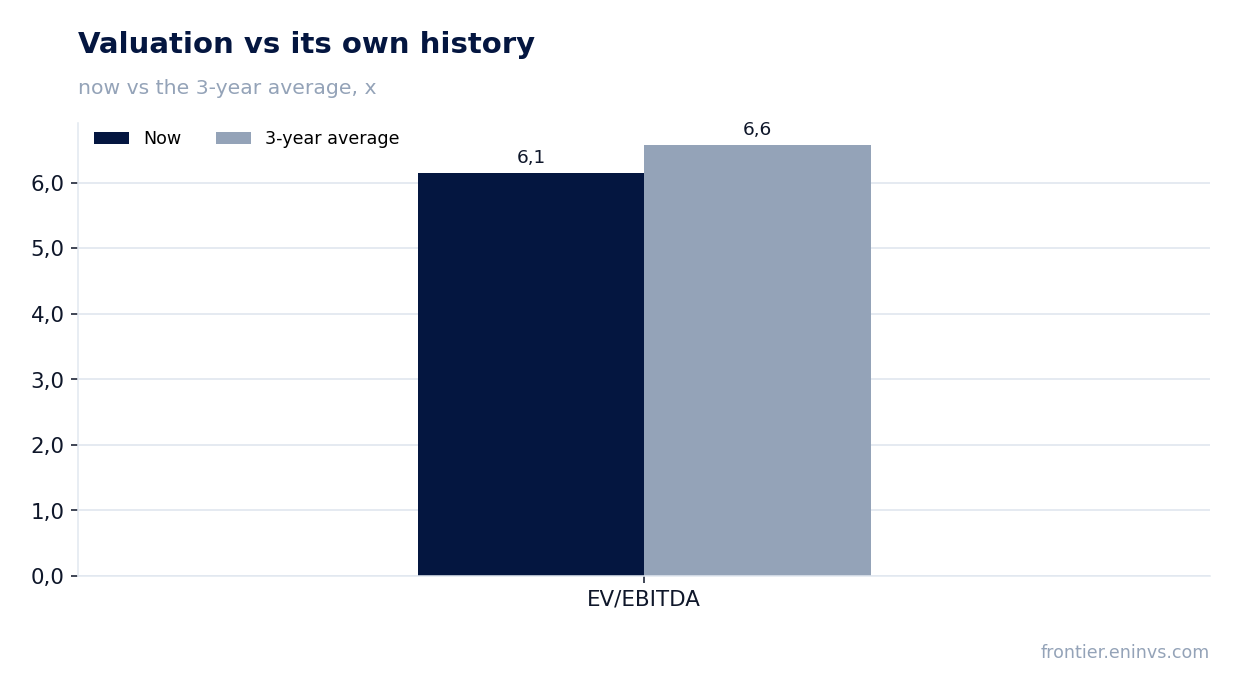
EV/EBITDA of 6.1 is below its own three-year average of 6.6, but the portal model shows –15%
The LTM EV/EBITDA multiple is 6.1 against its own three-year average of 6.6 – the stock trades 7% below its history on this multiple. The LTM P/E is 21.2, reflecting the low net margin.
On the portal's model the fair value implies –15% to the current price. The model is built on EBITDA growth and a target multiple, and with the EBITDA margin compressing its result comes in below the market.
The gap between a cheap multiple and a negative model upside is explained by earnings dynamics: the market is already pricing in weakness in the operating margin. A re-rating needs a reversal in the EBITDA trend, not further multiple compression.
Valuation on the latest reported figures
| Metric | Value |
|---|---|
| Market cap | 267 bn MXN |
| P/E (LTM) | 21.2 |
| EV/EBITDA (LTM) | 6.1 |
| P/B | 2.23 |
| Net debt / EBITDA (LTM) | 2.09 |
| Operating cash flow (LTM) | 53.8 bn |
| ROE | 13.8% |
| Dividend yield (12m) | 1.7% |
| EV/EBITDA, 3-year average | 6.6 |
Bottom line
The report's strengths are 21.6% net profit growth, a 15.1% rise in operating cash flow and a MXN 14.1 bn reduction in net debt over twelve months. The weakness is the EBITDA margin contracting to 15.9% and EBITDA falling 12.7%, which outweighs the improvement in cash generation. At an EV/EBITDA of 6.1 versus a three-year average of 6.6 the stock is cheaper than its history, but the portal model shows –15% and a 1.74% dividend yield provides no support. The verdict is neutral: the case for a cheap valuation and the case against a weakening operating margin cancel each other out.
Open the company's financial profile BIMBO →
See also: market overview · valuation map · stock screeners