Carso: revenue accelerated to +4.6%, but profit rests on a low year-ago base

Carso reported third-quarter 2026 results: revenue of 47.6 bn MXN (+4.6% YoY), EBITDA of 6.5 bn MXN (+32.7%) and net profit of 2.6 bn MXN (+293.2%). The profit jump is almost entirely explained by a weak year-ago base, when third-quarter 2025 net profit was only 0.7 bn MXN and the EBITDA margin was 12.7% versus 16.1% now. At an EV/EBITDA of 19.6 against its own three-year average of 12.4 the share looks expensive, so the verdict is neutral.
Key takeaways
— Revenue accelerated to +4.6% YoY from +3.9% a quarter earlier, but remains within 47–48 bn MXN
— EBITDA rose 32.7% mainly on a low year-ago base rather than on new scale
— Net profit nearly quadrupled, but its absolute level – 2.6 bn MXN – is modest for a company with 47.6 bn in revenue
— Operating cash flow was negative in the third quarter – minus 3.5 bn MXN – with capex of 2.7 bn
— Net debt rose to 21.8 bn MXN from 16.9 bn at end-June, but fell from 34.6 bn over twelve months
— EV/EBITDA of 19.6 is 58% above its own three-year average of 12.4 – the share is more expensive than its history
— A dividend yield of 0.92% does not offset the rich valuation and weak cash flow
Attractiveness
Key figures, MXN bn
| Metric | Q3 2025 | Q3 2026 | Change |
|---|---|---|---|
| Revenue | 45.5 | 47.6 | +4.6% |
| EBITDA | 5.79 | 7.69 | +32.7% |
| Operating profit | 3.20 | 4.84 | +51.3% |
| Net profit | 0.65 | 2.56 | +293.2% |
| Operating cash flow | 20.4 | -3.49 | -117.1% |
| Capex | — | -2.68 | — |
| EBITDA margin | 12.7% | 16.1% | +3.4 pp |
| Net margin | 1.4% | 5.4% | +4.0 pp |
Revenue accelerated to +4.6% YoY from +3.9% a quarter earlier, but remains within 47–48 bn MXN
In the third quarter of 2026 revenue was 47.6 bn MXN, up 4.6% year on year. That is an acceleration from the second quarter, when growth was 3.9%. Still, the absolute level remains within the narrow 47–48 bn MXN range the company has shown for several quarters.
For comparison, fourth-quarter 2025 revenue was 54.9 bn MXN and first-quarter 2026 revenue was 44.1 bn. The current 47.6 bn sits in the middle of that corridor. The acceleration is a positive signal, but it has not yet lifted the company to a new scale.
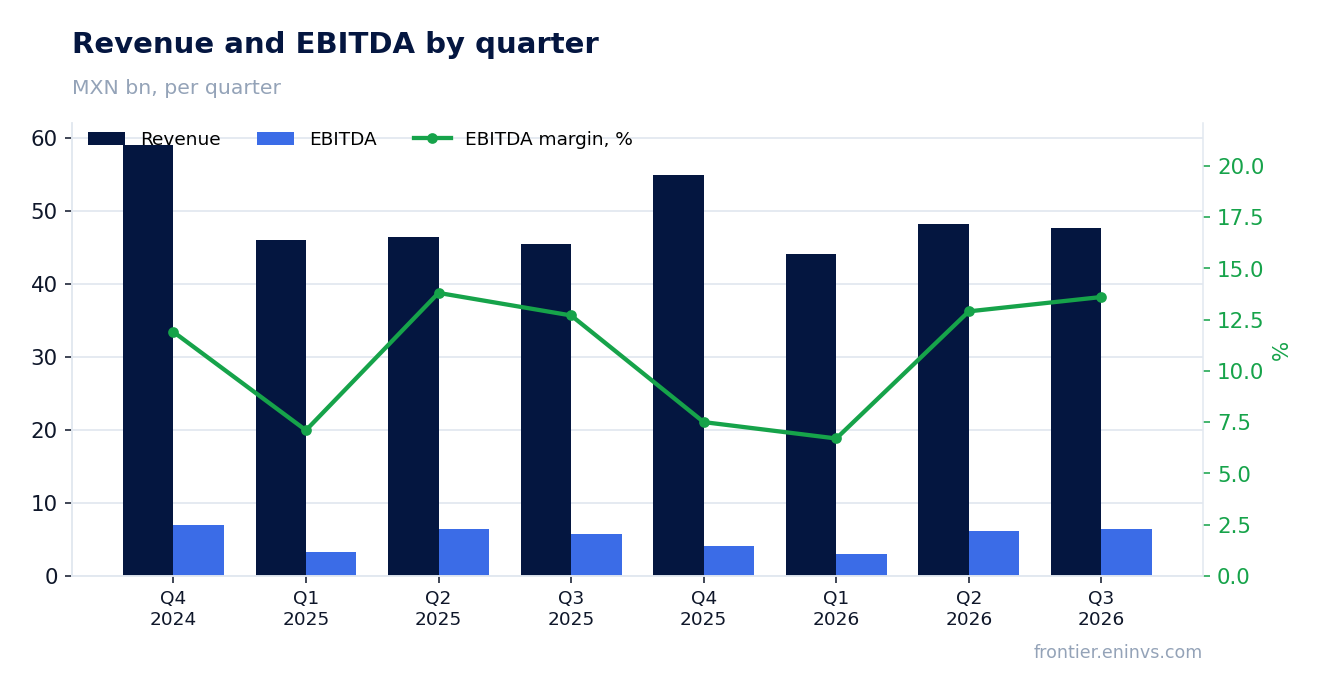
EBITDA rose 32.7% mainly on a low year-ago base rather than on new scale
Third-quarter 2026 EBITDA was 6.5 bn MXN, up 32.7% year on year. A year ago, however, EBITDA was only 5.8 bn MXN on revenue of 45.5 bn, a margin of 12.7%. The margin has now risen to 16.1%, and that is the main source of the EBITDA increase.
A 3.4 percentage-point margin gain on broadly flat revenue means the company controlled costs better. But the durability of that improvement is not yet confirmed: first-quarter 2026 EBITDA was only 3.0 bn MXN and second-quarter was 6.2 bn. Quarterly volatility is high, and it is too early to call a new profitability level.
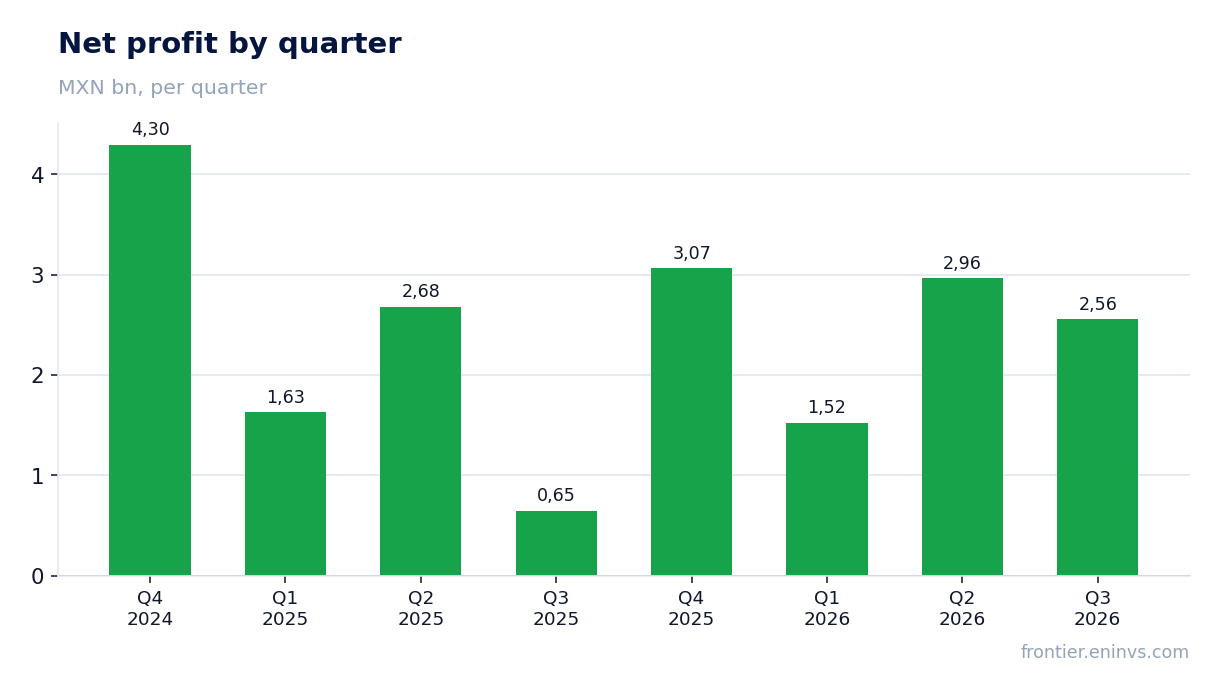
Net profit nearly quadrupled, but its absolute level – 2.6 bn MXN – is modest for a company with 47.6 bn in revenue
Third-quarter 2026 net profit was 2.6 bn MXN versus 0.7 bn a year earlier, up 293.2%. The jump reflects a low base: in third-quarter 2025 the net margin was only 1.4%, now it is 5.4%. At the same time, absolute profit of 2.6 bn MXN on revenue of 47.6 bn leaves a net margin of 5.4%, which is modest for a company of this scale.
Profit rose by 1.9 bn MXN while EBITDA rose by 1.6 bn, meaning part of the increase came from below the operating line. The facts do not break out items below EBITDA, so the source of the extra profit remains unexplained. For an investor this means the sustainability of 2.6 bn MXN per quarter is not yet proven.
Operating cash flow was negative in the third quarter – minus 3.5 bn MXN – with capex of 2.7 bn
Third-quarter 2026 operating cash flow was negative – minus 3.5 bn MXN. That is a sharp contrast with third-quarter 2025, when the flow was positive at 20.4 bn MXN. Capital expenditure was 2.7 bn MXN, meaning the company spent more on investment than it generated from operations.
A negative flow in the reported quarter alongside a positive trailing-twelve-month flow of 25.1 bn MXN points to strong quarterly working-capital volatility. Over the first nine months of 2026 the flow was close to zero: minus 0.4 bn in the first quarter, plus 3.9 bn in the second and minus 3.5 bn in the third. That pattern makes it hard to rely on the quarterly flow when judging the company's ability to fund capex and dividends.
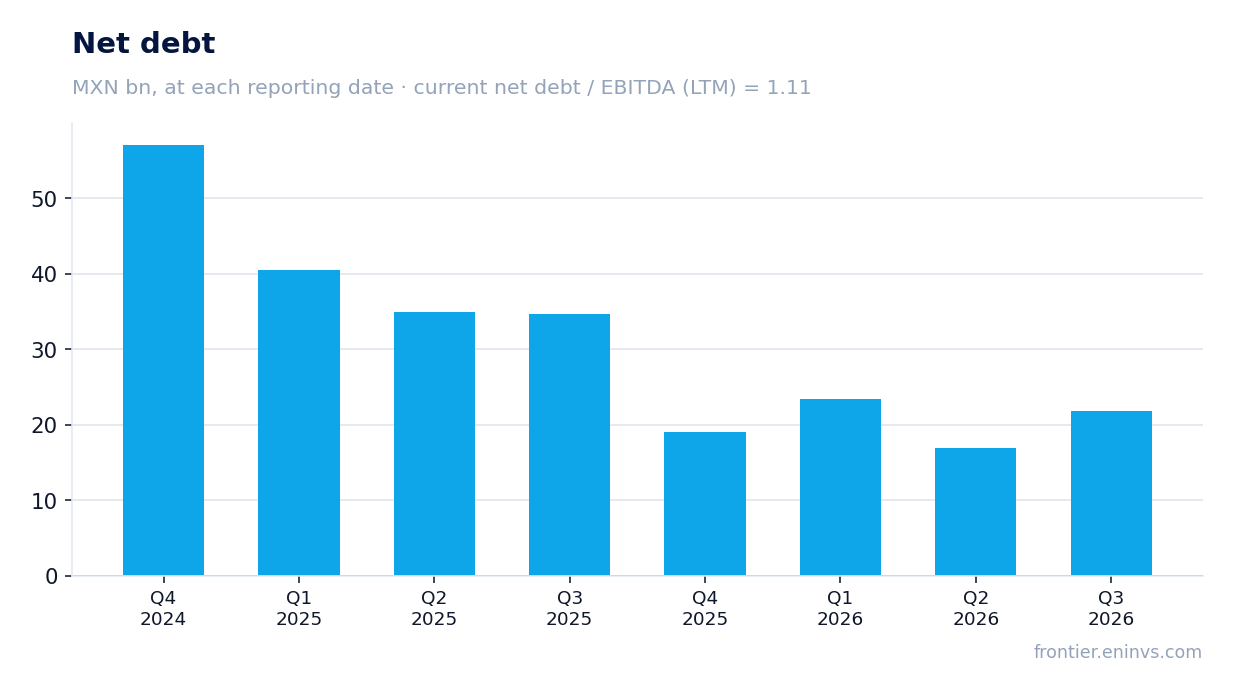
Net debt rose to 21.8 bn MXN from 16.9 bn at end-June, but fell from 34.6 bn over twelve months
Net debt at 30 September 2026 was 21.8 bn MXN versus 16.9 bn at 30 June 2026, an increase of 4.9 bn over the quarter. Over twelve months debt fell: from 34.6 bn at 30 September 2025 to 21.8 bn at 30 September 2026, a reduction of 12.8 bn. The quarterly rise coincided with negative operating cash flow, which explains why the company had to borrow more.
The ratio of net debt to trailing-twelve-month EBITDA is 1.11. That is a moderate level and does not put pressure on the finances. However, the facts do not include an earlier value of this ratio, so no direction of leverage can be stated – only the current level.
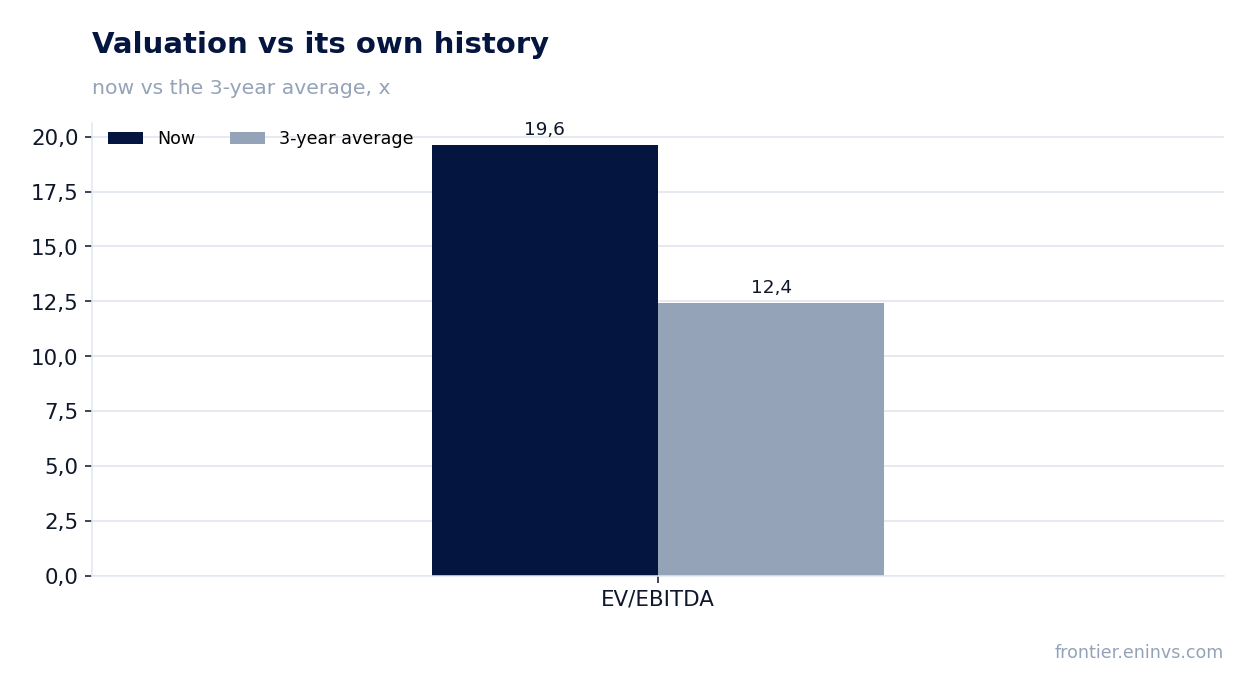
EV/EBITDA of 19.6 is 58% above its own three-year average of 12.4 – the share is more expensive than its history
The current trailing-twelve-month EV/EBITDA multiple is 19.6. Its own three-year average is 12.4. The share therefore trades 58% above its historical valuation. That is a substantial gap, which requires either a strong EBITDA acceleration or an acknowledgement that the market is pricing in factors not reflected in the reported figures.
On the portal's model, the fair value of the share implies +9% upside to the current market capitalisation. That is moderate upside and does not offset the risk of the multiple reverting to its historical average. For reference, the trailing-twelve-month P/E is 36.2, which also points to a rich valuation of earnings.
A dividend yield of 0.92% does not offset the rich valuation and weak cash flow
The trailing-twelve-month dividend yield is 0.92%. That is a low level and provides no meaningful support for the share. With the current price and negative operating cash flow in the third quarter, the company is unlikely to increase payouts unless it uses borrowed funds.
Our estimate for the current year's dividend assumes the payout ratio stays at last year's level and trailing-twelve-month profit of 10.1 bn MXN. However, quarterly profit is volatile, and if the fourth quarter is weak the dividend could be lower. A yield of 0.92% is well below the key rate, making the share unattractive for income-oriented investors.
Valuation on the latest reported figures
| Metric | Value |
|---|---|
| Market cap | 366 bn MXN |
| P/E (LTM) | 36.2 |
| EV/EBITDA (LTM) | 19.6 |
| P/B | 2.52 |
| Net debt / EBITDA (LTM) | 1.11 |
| Operating cash flow (LTM) | 25.1 bn |
| ROE | 7.5% |
| Dividend yield (12m) | 0.9% |
| EV/EBITDA, 3-year average | 12.4 |
Bottom line
The strong points of the report were revenue growth to +4.6% and a recovery in the EBITDA margin to 16.1% from 12.7% a year earlier. However, the 293.2% profit increase is almost entirely explained by a low year-ago base rather than a sustainable operational improvement. Negative operating cash flow in the third quarter and a 4.9 bn MXN increase in debt raise questions about earnings quality. At an EV/EBITDA of 19.6 against a historical average of 12.4 the share looks expensive, and the portal model's upside is only +9%. The verdict is neutral: the current price already reflects the profit recovery but leaves no margin for disappointment.
Open the company's financial profile CARSO →
See also: market overview · valuation map · stock screeners