CEMEX: net profit up 54.4% but revenue growth slowed to 8.1% — margin holds while the multiple sits above its own history
In its Q3 2026 report CEMEX posted revenue of USD 4,590.5 mn, operating profit of USD 651.7 mn and net profit of USD 407.1 mn. Year on year revenue added 8.1% and net profit 54.4%, while the net margin rose to 8.9% from 6.2%. The share looks neutral: strong margin and moderate leverage are offset by an EV/EBITDA of 5.9 against its own three-year average of 5.5 and a 7% discount to the portal model's fair value.
Key takeaways
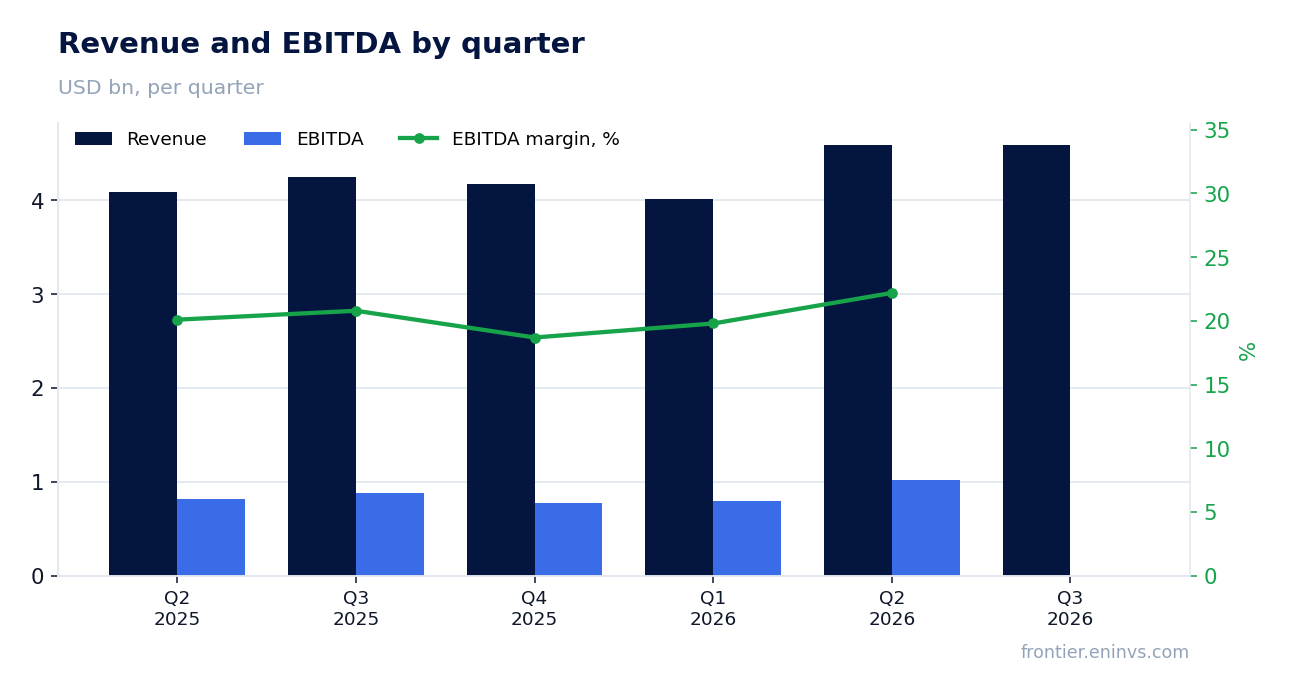
— Q3 revenue grew 8.1% year on year after 12.2% in Q2 – growth decelerated
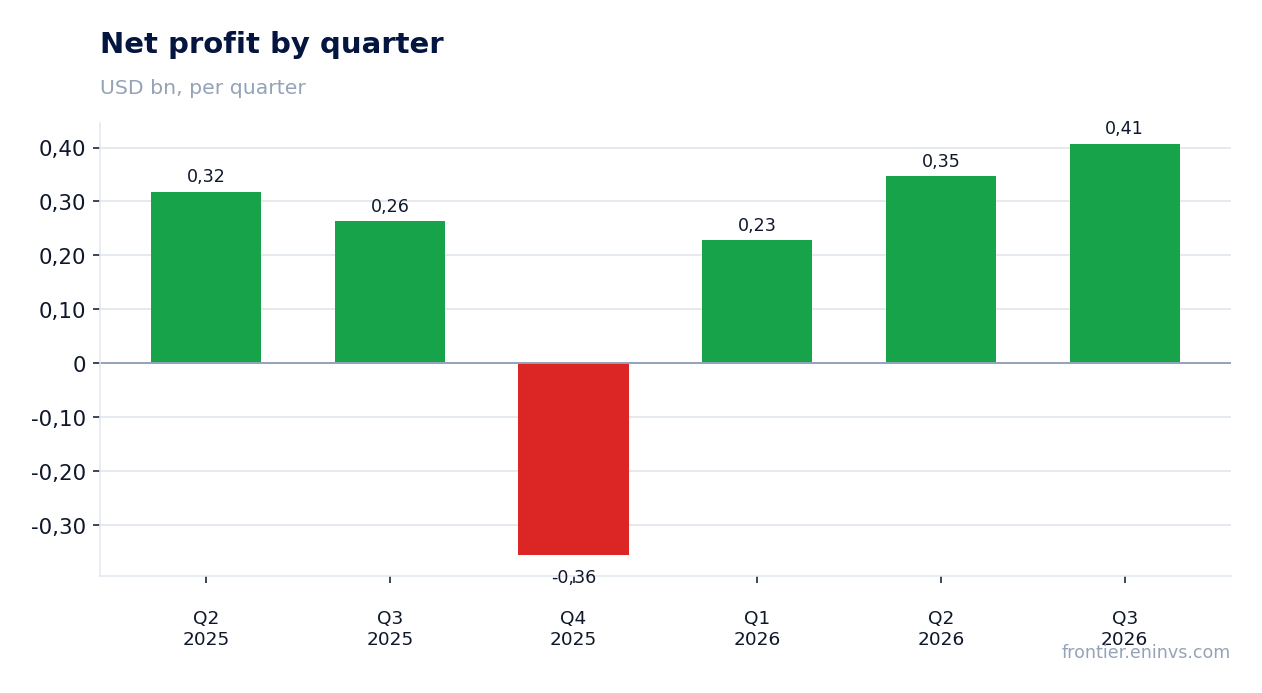
— Net profit added 54.4% year on year and the net margin rose to 8.9% from 6.2%
— Operating profit of USD 651.7 mn on revenue of USD 4,590.5 mn implies an operating margin of about 14.2%
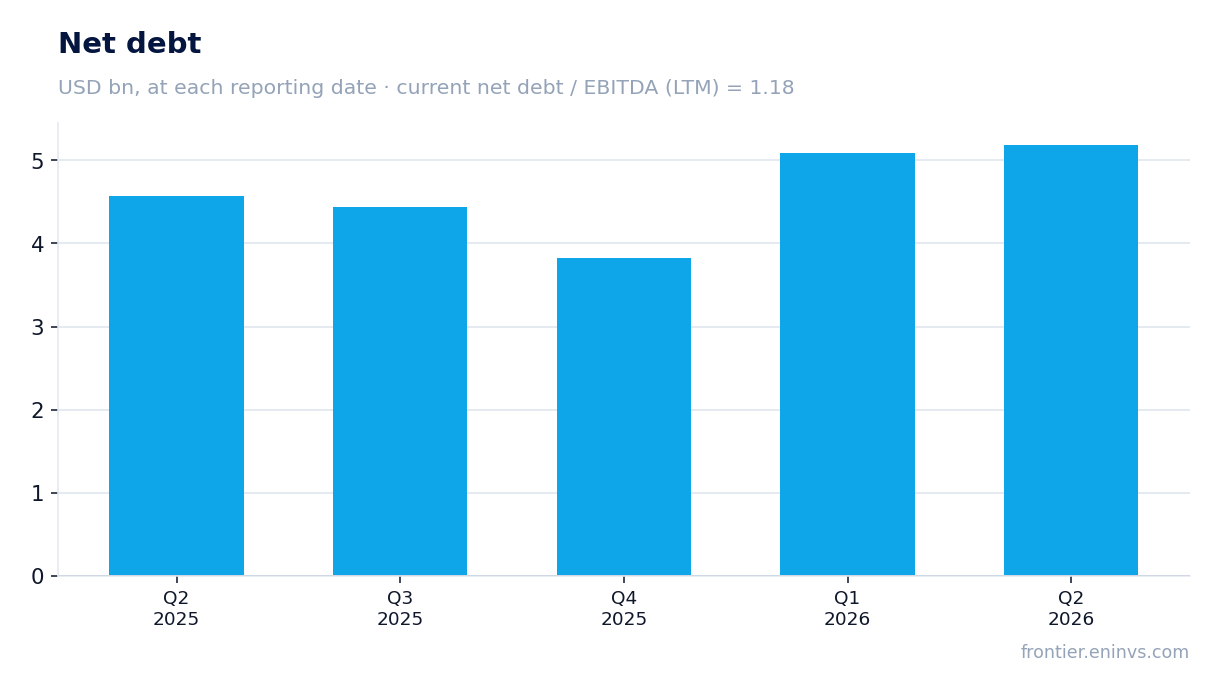
— Leverage of 1.18x LTM EBITDA is moderate for a cement business
— EV/EBITDA of 5.9 is 7% above its own three-year average of 5.5 – the share is more expensive than its own history
— Trailing twelve-month dividend yield of 0.95% is modest relative to the price
— The portal model shows a 7% discount to fair value – a thin cushion
Attractiveness
Key figures, USD bn
| Metric | Q3 2025 | Q3 2026 | Change |
|---|---|---|---|
| Revenue | 4.25 | 4.59 | +8.1% |
| EBITDA | 0.88 | — | — |
| Operating profit | 0.55 | 0.65 | +19.1% |
| Net profit | 0.26 | 0.41 | +54.4% |
| Operating cash flow | 0.74 | — | — |
| Capex | 0.33 | — | — |
| EBITDA margin | 20.8% | — | — |
| Net margin | 6.2% | 8.9% | +2.7 pp |
Q3 revenue grew 8.1% year on year after 12.2% in Q2 – growth decelerated
Q3 2026 revenue came to USD 4,590.5 mn, 8.1% above the same quarter a year earlier. In Q2 growth was 12.2%, so the pace decelerated. The slowdown comes against a higher base: Q3 2025 revenue was already USD 4,245.4 mn.
Sequential dynamics also show a stall: versus Q2 2026 revenue was virtually flat at 4,590.5 against 4,593.4 mn. Growth therefore rests on the year-on-year comparison rather than on intra-year acceleration.
For a cement business this is typical: volumes depend on the construction season and prices on local competition. The report gives no breakdown that would explain the deceleration, so we state the fact: growth remains positive but its pace has fallen.
Net profit added 54.4% year on year and the net margin rose to 8.9% from 6.2%
Q3 2026 net profit was USD 407.1 mn against USD 263.7 mn a year earlier – up 54.4%. The net margin rose to 8.9% from 6.2% in Q3 2025.
Profit outrunning revenue means the margin gain did not come from volumes alone. With revenue of USD 4,590.5 mn and operating profit of USD 651.7 mn the operating margin is about 14.2%, above the level at which the net margin would have been 6.2%.
The gap between operating and net profit – USD 244.6 mn – is interest and taxes. A lower burden relative to revenue was the main contributor to the net margin gain. The report gives no detail, so we name only the outcome: profit grew faster than revenue.
Operating profit of USD 651.7 mn on revenue of USD 4,590.5 mn implies an operating margin of about 14.2%
Q3 2026 operating profit was USD 651.7 mn on revenue of USD 4,590.5 mn – about 14.2% of revenue. A year earlier, on revenue of USD 4,245.4 mn, operating profit was USD 547.3 mn, or about 12.9%.
The 1.3 percentage point gain in operating margin is the main source of the strong net profit. It means the company either raised prices faster than costs or cut variable expenses. The report gives no cost breakdown, so the specific cause cannot be named.
What matters for a holder is different: an operating margin above 14% is a level at which even revenue growth decelerating to 8.1% leaves profit rising. If the margin holds, profit will grow more slowly than revenue but stay positive.
Leverage of 1.18x LTM EBITDA is moderate for a cement business
Net debt at the latest annual balance-sheet date was USD 3,822.0 mn, equal to 1.18x LTM EBITDA. For capital-intensive cement production this is a moderate level: it leaves headroom to typical covenants of 3–4x EBITDA.
LTM EBITDA was USD 3,244.5 mn on revenue of USD 17,400.0 mn – about 18.6% of revenue. A debt-to-EBITDA ratio below 1.2 means the company can service debt from current cash flow without new financing.
The direction of the debt change is not disclosed in the facts, so we state the level only: leverage is moderate but not zero. A 20% fall in EBITDA would lift the ratio to 1.48 – still comfortable, but the cushion is no longer unlimited.
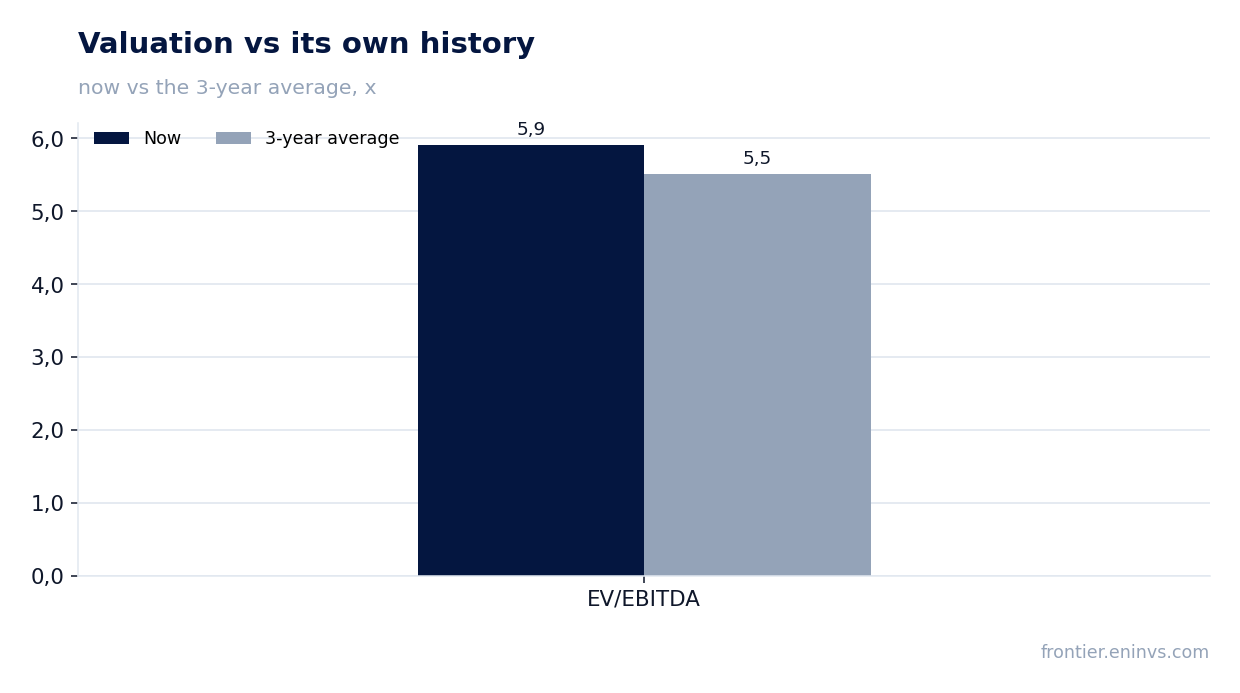
EV/EBITDA of 5.9 is 7% above its own three-year average of 5.5 – the share is more expensive than its own history
The LTM EV/EBITDA multiple is 5.9 against its own three-year average of 5.5. The share trades 7% above its own history. That is not a bubble, but it is not a discount either: the market has already priced in the current margin level.
The LTM P/E is 24.5 on net profit of USD 626.1 mn and a market cap of USD 15,369.7 mn. Such a P/E assumes profit will grow rather than stagnate. With revenue growth decelerating to 8.1%, that requires the margin to hold.
The portal model, which re-prices EBITDA at current commodity prices at the target EV/EBITDA, puts fair value 7% above the market. That is the portal's own calculation, not a consensus: the cushion is thin and does not cover the deceleration risk.
Trailing twelve-month dividend yield of 0.95% is modest relative to the price
The trailing twelve-month dividend yield is 0.95%. That is a modest level: at the current price the payout is not the main argument for buying. For comparison, the dollar key rate is not applicable here, but the yield is clearly below what an investor can get in risk-free instruments.
Our estimate of the current-year dividend starts from LTM net profit of USD 626.1 mn and a payout ratio not disclosed in the facts. If the company pays out half of profit, the yield stays around 1%. Everything hinges on policy and one-off items.
A fall in profit could cut the payout: in Q4 2025 the company posted a loss of USD 355.7 mn, and a repeat of such a quarter would shrink the annual base. The dividend is not the main driver of this share, but neither is it protection against a decline.
The portal model shows a 7% discount to fair value – a thin cushion
On the portal model the share's fair value is 7% above the current market price. This is the portal's own calculation, based on re-pricing EBITDA at current commodity prices at the target EV/EBITDA. It is not a consensus and not a target price.
A 7% discount is smaller than the typical quarterly volatility of the cement sector. That means the market values the share close to fair value and the margin of safety is thin. A purchase would need either profit growth or a lower multiple.
With EV/EBITDA at 5.9 against a three-year average of 5.5 the share is no longer cheap. The portal model confirms: upside is limited, and the main bet is on holding the margin rather than on a re-rating.
Valuation on the latest reported figures
| Metric | Value |
|---|---|
| Market cap | 15.4 bn USD |
| P/E (LTM) | 24.5 |
| EV/EBITDA (LTM) | 5.9 |
| P/B | 1.19 |
| Net debt / EBITDA (LTM) | 1.18 |
| ROE | 12.8% |
| Dividend yield (12m) | 0.9% |
| EV/EBITDA, 3-year average | 5.5 |
Bottom line
The report's strength is the margin: net margin rose to 8.9% from 6.2% and operating margin to 14.2%. The weakness is revenue deceleration to 8.1% after 12.2% in Q2. Leverage of 1.18x EBITDA is moderate and the 0.95% dividend yield is modest. The share trades 7% above its three-year average on EV/EBITDA, and the portal model shows only a 7% discount to fair value. The verdict is neutral: strong margin is already in the price, and growth needs a new driver.
Open the company's financial profile CEMEX →
See also: market overview · valuation map · stock screeners