Grupo México: revenue grows for a third straight quarter, but net debt added 2.9 bn USD in the quarter
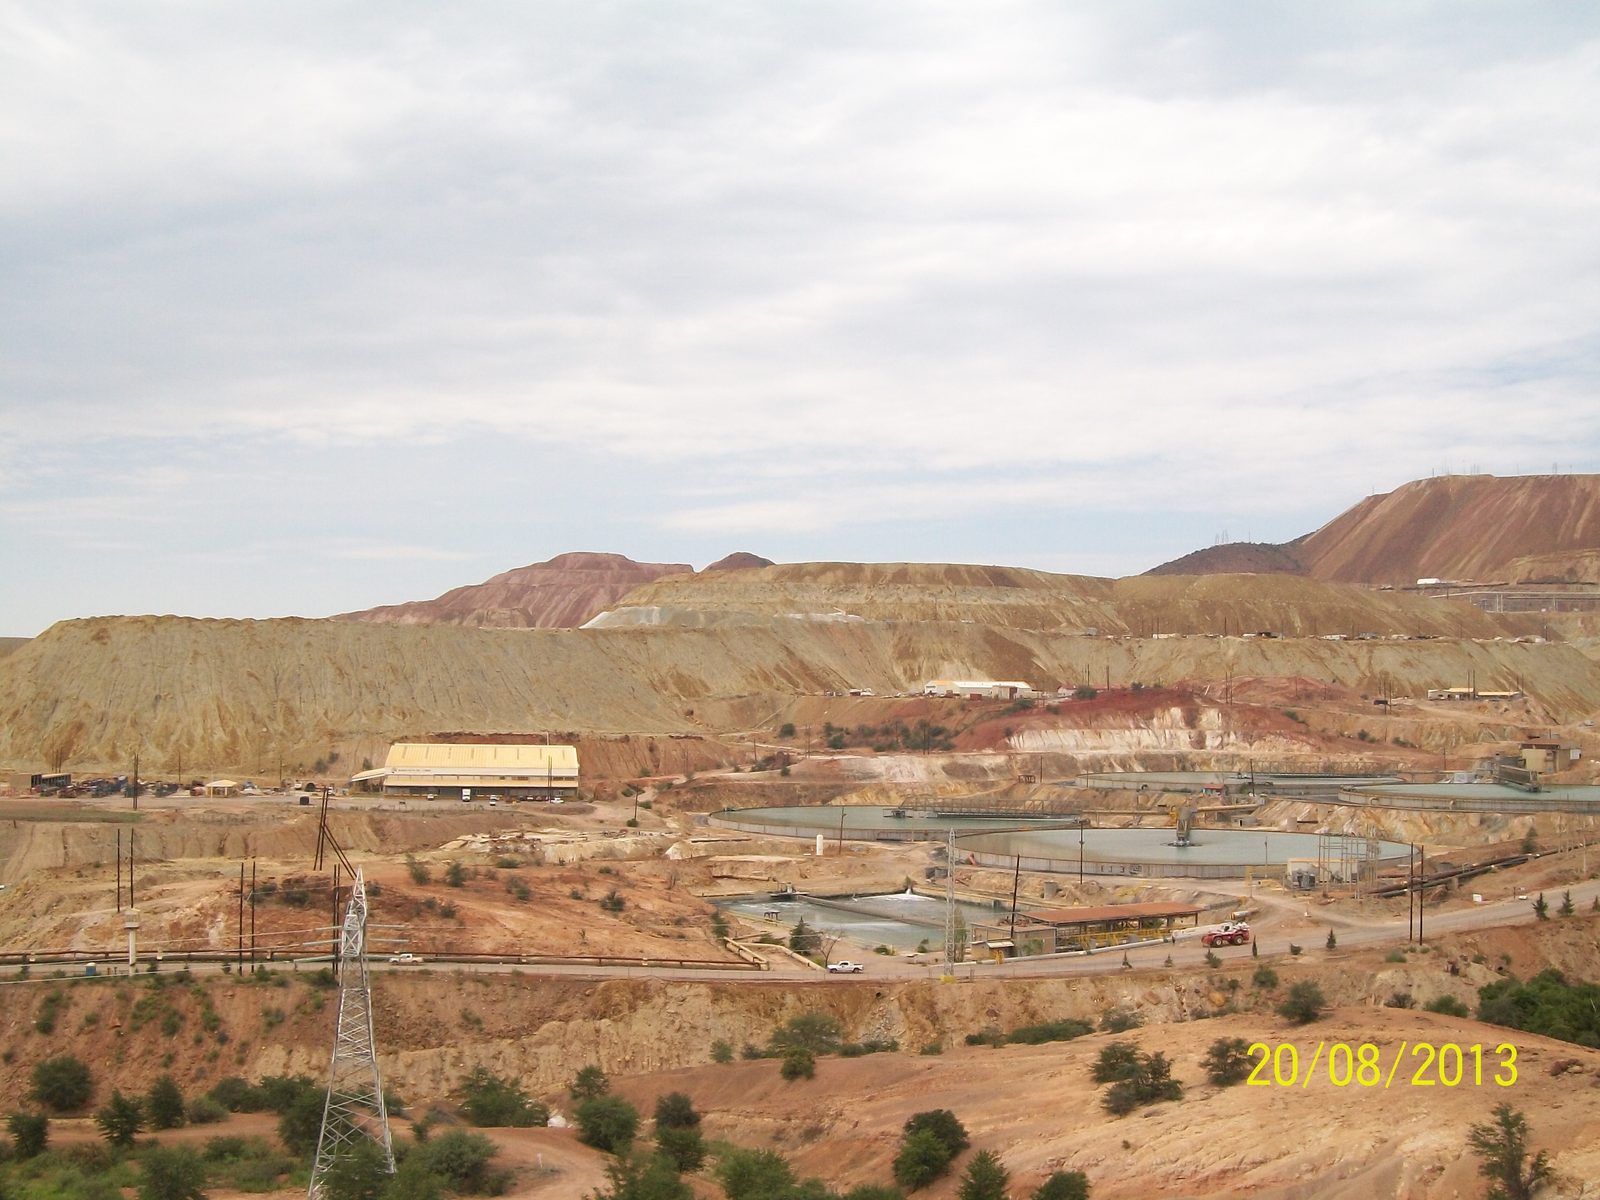
In its Q3 2026 report Grupo México posted revenue of 6,333.0 mn USD, EBITDA of 3,969.9 mn and net profit of 2,003.9 mn. Revenue grew 31.4% year on year, EBITDA 52.0%, and the EBITDA margin rose to 62.7% from 54.2%. Net debt at end-September stood at 4.0 bn USD against 1.1 bn on 30 June. With an LTM P/E of 19.6 and the portal model pointing to -8% versus fair value, the share looks neutral: strong operating momentum is offset by higher debt and a price above its own history.
Key takeaways
— Revenue above 5.5 bn USD for a third straight quarter, but growth decelerated from 35.0% to 31.4%
— EBITDA rose 52.0% and the margin added 8.5 percentage points to 62.7%
— Net profit of 2,003.9 mn USD at a 31.6% margin versus 29.6% a year earlier
— Net debt rose from 1.1 bn USD on 30 June to 4.0 bn on 30 September
— Operating cash flow of 2,392.9 mn USD does not cover the quarter's debt increase
— LTM P/E of 19.6, while the portal model points to -8% versus fair value
— Trailing 12-month dividend yield of 2.3% is modest for a company with ROE of 31.0%
Attractiveness
Key figures, USD bn
| Metric | Q3 2025 | Q3 2026 | Change |
|---|---|---|---|
| Revenue | 4.82 | 6.33 | +31.4% |
| EBITDA | 2.61 | 3.97 | +52.0% |
| Operating profit | 2.37 | 3.45 | +45.7% |
| Net profit | 1.43 | 2.00 | +40.4% |
| Operating cash flow | 1.98 | 2.39 | +20.8% |
| EBITDA margin | 54.2% | 62.7% | +8.5 pp |
| Net margin | 29.6% | 31.6% | +2.0 pp |
Revenue above 5.5 bn USD for a third straight quarter, but growth decelerated from 35.0% to 31.4%
Q3 2026 revenue came in at 6,333.0 mn USD, up 31.4% year on year. It was the third consecutive quarter above 5.5 bn: 5,565.3 mn in Q1 and 5,717.5 mn in Q2. The absolute level keeps rising, but the annual growth rate decelerated from 35.0% in Q2 to 31.4% in Q3.
The deceleration does not signal weakness: the year-earlier base was already high, and 31.4% growth remains one of the best readings of the past two years. More important for valuation is that the company has held revenue above 6 bn USD for a second straight quarter – a new level for the business.
The facts do not disclose what drove the increase. The report gives no segment breakdown, so whether metals prices, volumes or both produced the growth cannot be established from the available data. Watch the next release: whether revenue stays above 6 bn USD once the comparison base rises further.
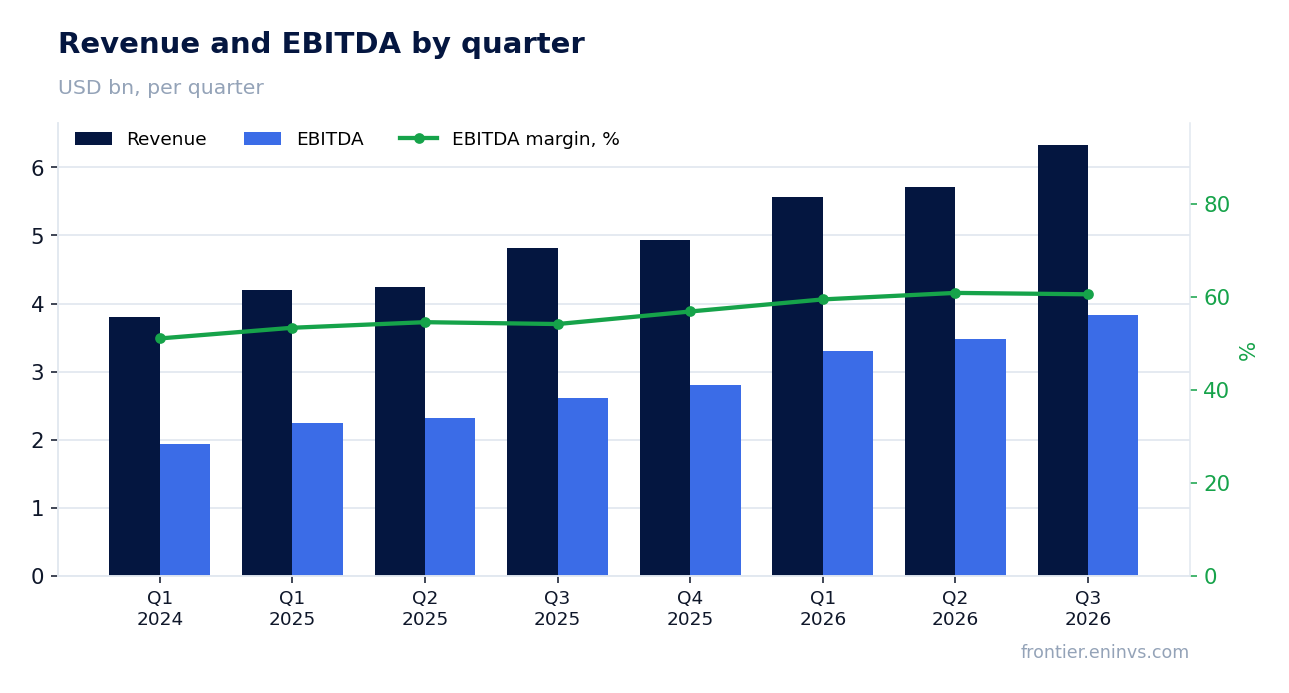
EBITDA rose 52.0% and the margin added 8.5 percentage points to 62.7%
Q3 EBITDA reached 3,969.9 mn USD, up 52.0% year on year. The EBITDA margin rose to 62.7% from 54.2% – an 8.5 percentage point gain. That is the highest margin in recent quarters: about 59.5% in Q1 2026 and about 60.9% in Q2.
Operating profit was 3,451.6 mn USD, so the gap between EBITDA and operating profit – about 518.0 mn – is depreciation and other non-cash items. The margin is growing faster than revenue, meaning costs are rising more slowly than income. The facts do not disclose which cost line produced the effect.
Whether the margin holds above 60% is the key question for valuation. If it does, profit stays high even as revenue growth slows. If it is a one-off from metals prices, the margin returns to 54–55% and next year's profit will be noticeably lower.
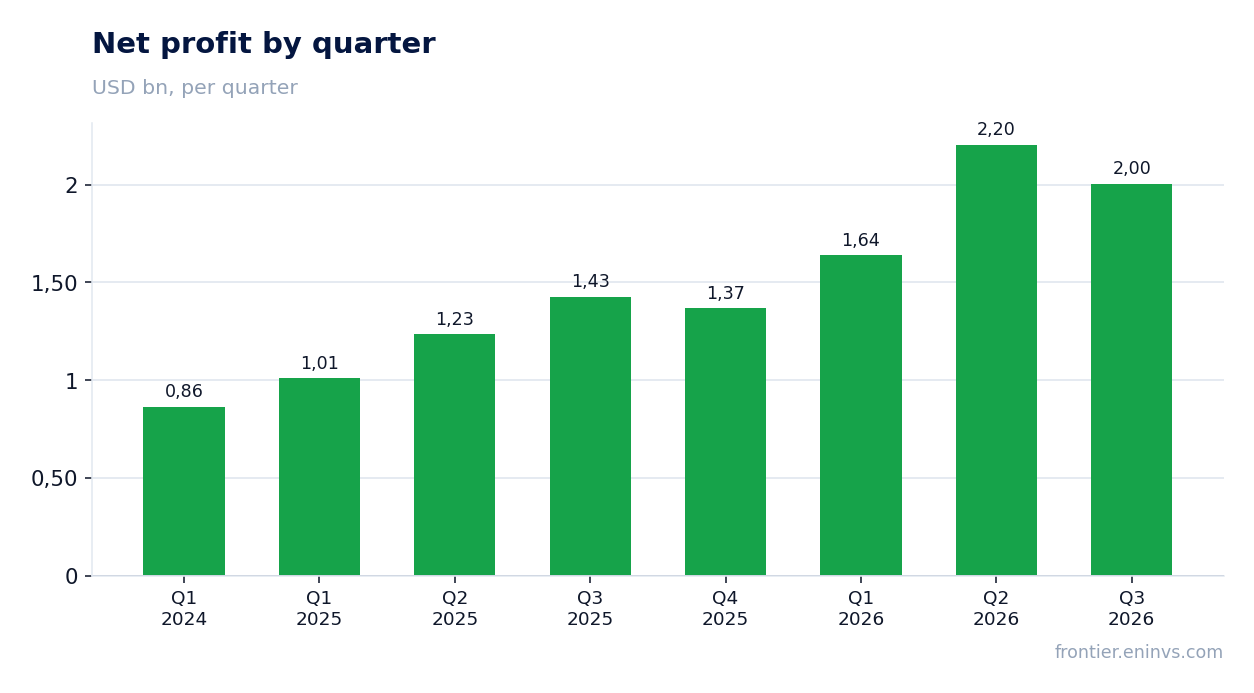
Net profit of 2,003.9 mn USD at a 31.6% margin versus 29.6% a year earlier
Q3 net profit was 2,003.9 mn USD, up 40.4% year on year. The net margin rose to 31.6% from 29.6%. Profit growth lags EBITDA growth (52.0%), pointing to higher costs below the operating line – likely interest and taxes, though the facts do not disclose the exact cause.
Over the trailing twelve months net profit was 5,039.6 mn USD. That is the base for the LTM P/E of 19.6 at a market capitalisation of 98.8 bn USD. Quarterly profit of 2,003.9 mn is below Q2's 2,203.9 mn even though revenue was higher. The gap reflects higher costs or one-off items not detailed in the facts.
ROE of 31.0% is strong for a mining company. It is supported by the high margin and a moderate equity base. If the margin normalises, ROE will fall, and that will feed into the valuation.
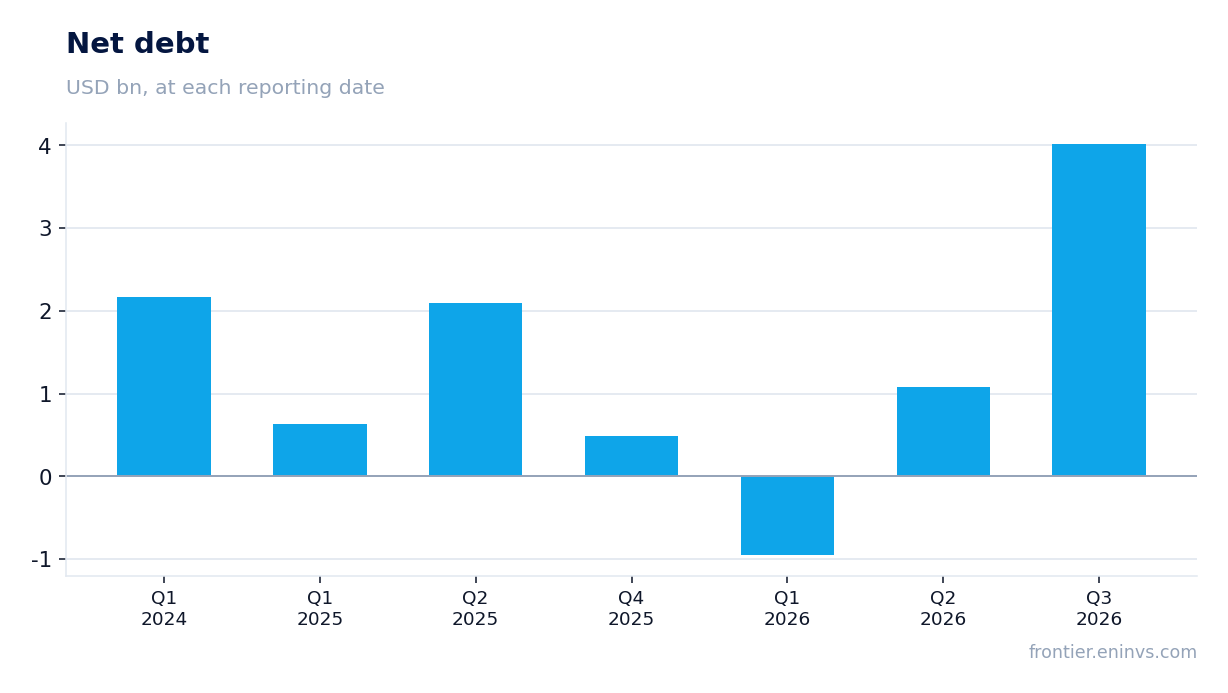
Net debt rose from 1.1 bn USD on 30 June to 4.0 bn on 30 September
Net debt on 30 September 2026 was 4.0 bn USD against 1.1 bn on 30 June – an increase of 2.9 bn in the quarter. Over twelve months debt rose from 2.1 bn on 30 June 2025 to 4.0 bn on 30 September 2026, a gain of 1.9 bn. The quarterly increase is well above the annual one, meaning most of the debt was raised in the last three months.
With quarterly EBITDA of 3,969.9 mn, debt of 4.0 bn looks moderate: the ratio of debt to quarterly EBITDA is about one. But the company does not disclose what the borrowed funds were used for – investment, dividends or working capital. Without that, it is impossible to say whether the increase is one-off or a new debt policy.
For the shareholder, interest expense matters: with debt up 2.9 bn in the quarter, debt-service costs will rise in coming reports. That could cap net profit growth even with strong EBITDA.
Operating cash flow of 2,392.9 mn USD does not cover the quarter's debt increase
Q3 operating cash flow was 2,392.9 mn USD. That is below Q2's 3,649.2 mn and above Q3 2025's 1,981.0 mn. The flow is positive and covers most of quarterly EBITDA, indicating good conversion of profit into cash.
The 2.9 bn increase in debt in the quarter exceeds operating cash flow of 2,392.9 mn. So even with strong cash flow the company raised borrowed funds. Capital expenditure for the quarter is not disclosed in the facts, so it is impossible to say how much went to investment and how much to dividends or other uses.
The combination of positive cash flow and rising debt is the main question for the report. If the money went into capacity expansion, it is an investment in future growth. If it went to shareholder payouts or working capital, leverage may stay elevated.
LTM P/E of 19.6, while the portal model points to -8% versus fair value
The LTM P/E is 19.6 on profit of 5,039.6 mn USD and a market capitalisation of 98.8 bn. For comparison with its own history, the facts give only the three-year average EV/EBITDA of 6.1. The current EV/EBITDA is not in the facts, so a direct comparison is not possible. But with market capitalisation of 98.8 bn and net debt of 4.0 bn, EV is about 102.8 bn, and LTM EBITDA is about 13.4 bn, giving EV/EBITDA of about 7.7. That is above the three-year average of 6.1, meaning the share trades above its own history.
The portal model, which reprices EBITDA at current commodity prices at the target EV/EBITDA, points to -8% versus fair value. This is the portal's own model, not a market consensus. It suggests the current price is somewhat above fair value.
The trailing 12-month dividend yield is 2.3%. With ROE of 31.0% and a strong margin, that is modest: the company prefers to direct profit into development or debt reduction rather than payouts. For an income-oriented investor, that is a constraint.
Trailing 12-month dividend yield of 2.3% is modest for a company with ROE of 31.0%
The trailing 12-month dividend yield is 2.3% at a market capitalisation of 98.8 bn USD. That is modest for a company with a 62.7% EBITDA margin and ROE of 31.0%. The company directs a significant share of profit into investment and debt service rather than shareholder payouts.
Our estimate for the current year's dividend assumes profit stays at the trailing 12-month level of 5,039.6 mn and the current yield of 2.3%. If profit holds at that level, the dividend is unlikely to rise materially. The key factor is payout policy: with debt rising, the company may prefer to use free cash to reduce it.
A 2.3% yield is below what one might expect from a company with such a margin. For comparison, the dollar key rate is currently lower, but for an emerging market 2.3% is low. If debt keeps rising, the dividend could be cut or frozen.
Valuation on the latest reported figures
| Metric | Value |
|---|---|
| Market cap | 98.8 bn USD |
| P/E (LTM) | 19.6 |
| P/B | 4.24 |
| ROE | 31.0% |
| Dividend yield (12m) | 2.3% |
Bottom line
The report's strength is operational: revenue above 6 bn USD for a second straight quarter, EBITDA up 52.0%, margin at 62.7%. The weakness is debt: it rose 2.9 bn USD in the quarter, and operating cash flow did not cover the increase. The portal model points to -8% versus fair value, and the P/E of 19.6 and EV/EBITDA of about 7.7 are above the three-year average. The share looks neutral: operating momentum is strong, but debt and price limit the upside. Verdict – neutral.
Open the company's financial profile GMEXICO →
See also: market overview · valuation map · stock screeners