Orbia: revenue up 3,310x, but the margin nearly halved
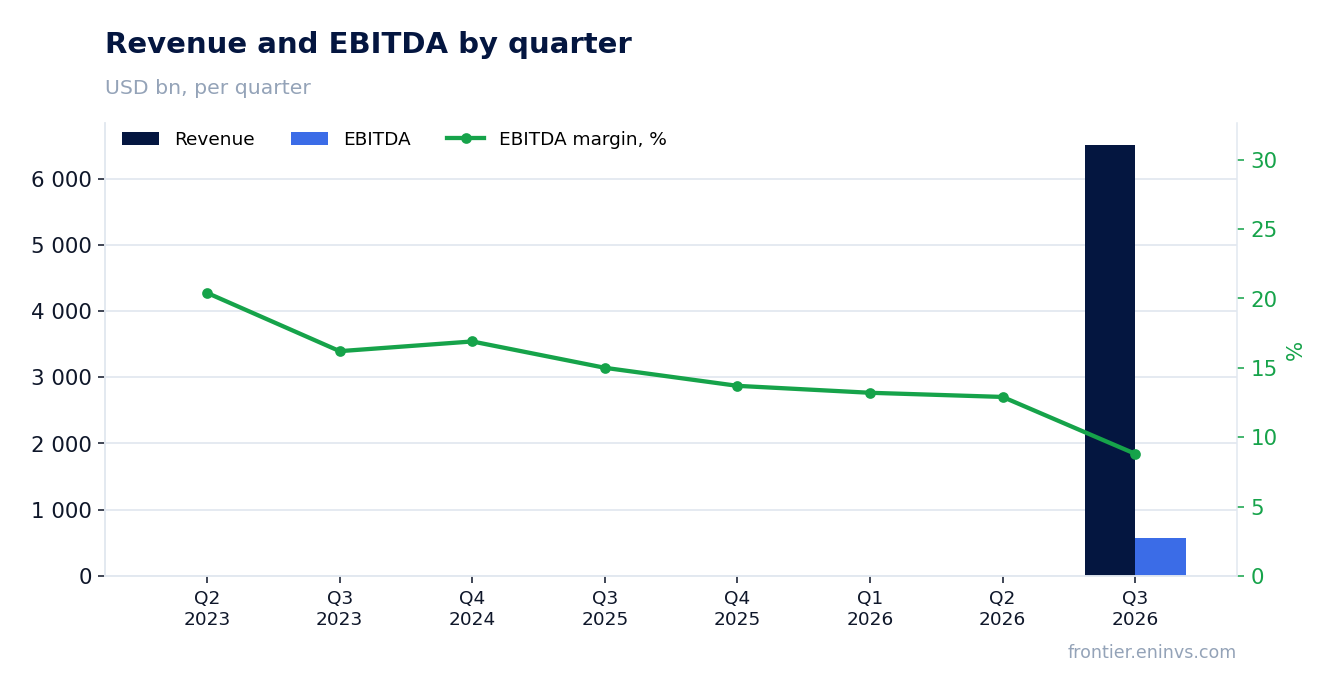
The Q3 2026 report, for the quarter ended 30 September, shows revenue of 6,511,000 million USD against 1,966 million USD a year earlier – growth of 331,080.1%. EBITDA came in at 575,000 million USD (+194,815.3% YoY), and net profit at 92,000 million USD versus a loss of 120 million USD a year earlier. At the same time, the EBITDA margin fell to 8.8% from 15.0%, and the net margin was 1.4% versus -6.1%. In our view, the share looks attractive at the current price: the portal's model implies upside to fair value of +80%, although leverage and margin compression call for caution.
Key takeaways
— Revenue grew 331,080.1% YoY, an acceleration from +5.3% in Q4 2025
— EBITDA rose 194,815.3% YoY, but its margin compressed to 8.8% from 15.0%
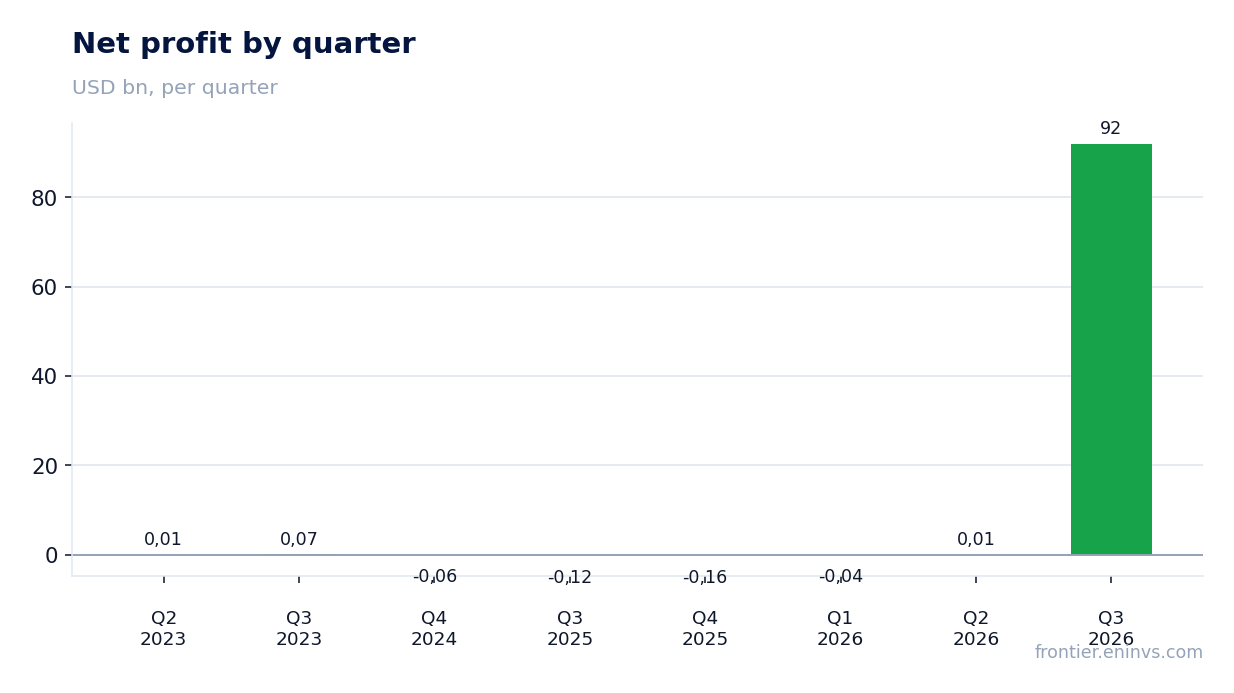
— Net profit of 92,000 million USD replaced a loss of 120 million USD a year earlier, with the net margin at +1.4%
— Debt on the balance sheet is 3,907 million USD at the latest annual report, and the quarter's data do not disclose its movement
— The portal's model puts the share's upside to fair value at +80% at the current price
— The share is held in the live MX Commodity-Upside strategy on the portal
Attractiveness
Key figures, USD bn
| Metric | Q3 2025 | Q3 2026 | Change |
|---|---|---|---|
| Revenue | 1.97 | 6 511 | +331080.1% |
| EBITDA | 0.29 | 575 | +194815.3% |
| Operating profit | 0.13 | 560 | +430669.2% |
| Net profit | -0.12 | 92.0 | to profit |
| Operating cash flow | 0.38 | — | — |
| Capex | 0.11 | — | — |
| EBITDA margin | 15.0% | 8.8% | -6.2 pp |
| Net margin | -6.1% | 1.4% | +7.5 pp |
Revenue grew 331,080.1% YoY, an acceleration from +5.3% in Q4 2025
In Q3 2026 revenue was 6,511,000 million USD against 1,966 million USD in the same quarter a year earlier. Growth of 331,080.1% is an acceleration from +5.3% in Q4 2025. That scale is incomparable with the company's prior dynamics, when quarterly revenue ranged between 1.8 and 2.4 billion USD.
Earlier quarters provide the base: Q4 2025 revenue was 1,875 million USD, Q1 2026 was 1,963 million USD, and Q2 2026 was 2,352 million USD. The reported level is orders of magnitude above that base, which changes the scale of the business rather than just the growth rate.
What exactly produced the jump does not follow from the available data. We record the fact of the multiple increase in revenue and the acceleration versus the prior quarter, but do not attribute it to a specific segment or one-off transaction.
EBITDA rose 194,815.3% YoY, but its margin compressed to 8.8% from 15.0%
EBITDA in the reported quarter was 575,000 million USD, 194,815.3% above the year-earlier level. Operating profit reached 560,000 million USD. At the same time, the EBITDA margin fell to 8.8% from 15.0% a year earlier.
Margin compression amid multiple revenue growth means costs grew faster than revenue. Absolute EBITDA rose, but each dollar of revenue brings less operating profit than a year ago. For a company whose quarterly EBITDA previously ranged from 256 to 444 million USD, the new level of 575,000 million USD is incomparable with the prior scale.
The reason for the margin compression is not disclosed in the available data. We note the gap between revenue and EBITDA growth: revenue rose 331,080.1% while EBITDA rose 194,815.3%, lagging revenue.
Net profit of 92,000 million USD replaced a loss of 120 million USD a year earlier, with the net margin at +1.4%
Net profit for Q3 2026 was 92,000 million USD against a loss of 120 million USD in the same quarter a year earlier. The net margin turned positive at 1.4% versus -6.1% a year earlier.
The swing from loss to profit came on the back of operating profit rising to 560,000 million USD. At the same time, the net margin of 1.4% is well below the 8.8% EBITDA margin, meaning a substantial burden remains between operating and net results – interest, taxes and other items.
Earlier quarters showed an unstable result: a loss of 62 million USD in Q4 2024, a loss of 120 million USD in Q3 2025, a loss of 157 million USD in Q4 2025, a loss of 38 million USD in Q1 2026, and a profit of 15 million USD in Q2 2026. The reported quarter is the first with a profit of this scale.
Debt on the balance sheet is 3,907 million USD at the latest annual report, and the quarter's data do not disclose its movement
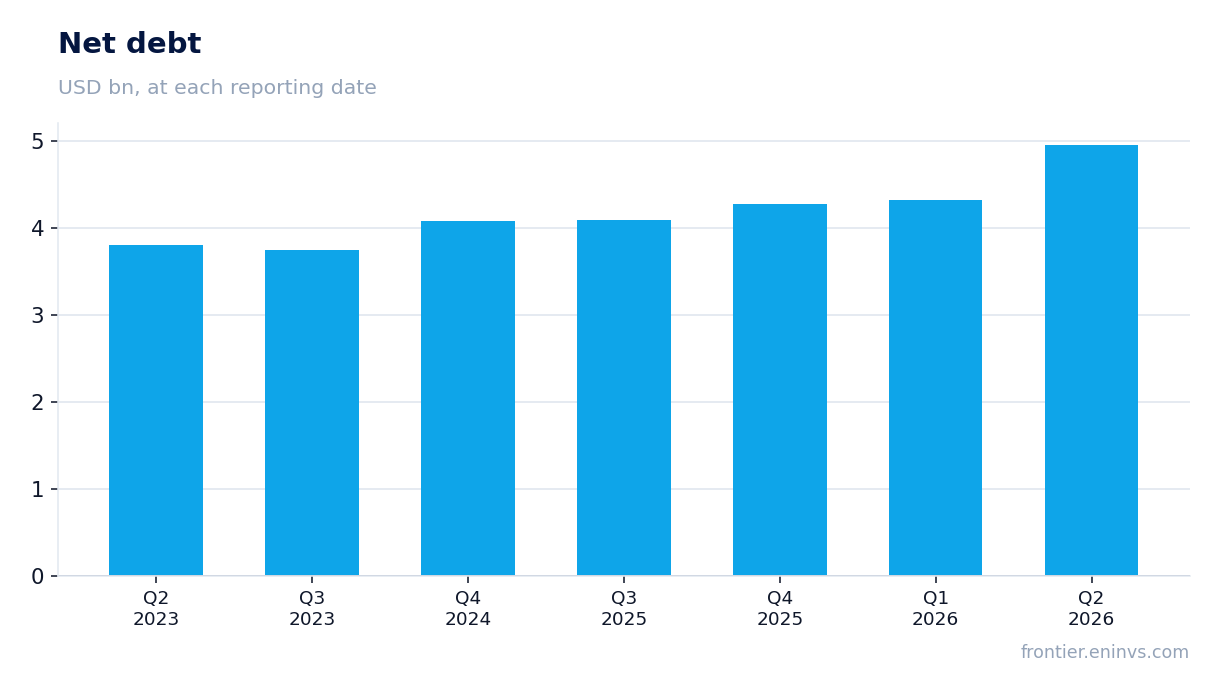
Net debt at the latest annual balance sheet is 3,907 million USD. The Q3 2026 data do not include a net debt figure, so its movement over the reported period cannot be judged.
Earlier quarters showed debt rising from 3,800 million USD in Q2 2023 to 4,953 million USD in Q2 2026. The annual balance sheet at 3,907 million USD is below that trajectory, but it cannot be compared directly with quarterly values – they are different dates.
With EBITDA of 575,000 million USD in the reported quarter, debt of 3,907 million USD looks small, but a debt-to-EBITDA ratio on a quarterly basis would be incorrect. We record the absolute debt level and draw no conclusion about the direction of leverage.
The portal's model puts the share's upside to fair value at +80% at the current price
On the portal's model, EBITDA re-priced at current commodity prices at the target EV/EBITDA implies upside to fair value of +80% from the current price. This is our own estimate, not a market consensus or a target price.
The three-year average EV/EBITDA is 4.70. Current market capitalisation is 2,373.9 million USD. At that capitalisation and reported-quarter EBITDA of 575,000 million USD, the multiple looks low, but quarterly EBITDA is not comparable with the annual bases on which the average is built.
The model relies on re-pricing EBITDA at current commodity prices. If commodity prices stay at current levels, the +80% upside holds; if they fall, the valuation changes.
The share is held in the live MX Commodity-Upside strategy on the portal
The MX_ORBIA share is held in the live model strategy MX Commodity-Upside on the portal. This is a fact of membership, not an argument for the verdict: selection into the strategy follows its own screen.
The strategy focuses on commodity upside, and the reported quarter with multiple revenue and EBITDA growth formally fits that logic. But membership in the strategy does not replace the assessment of the share itself.
Valuation on the latest reported figures
| Metric | Value |
|---|---|
| Market cap | 2.37 bn USD |
| P/B | 1.11 |
| ROE | -5.9% |
Bottom line
The strong point of the report was the swing to profit: net profit of 92,000 million USD against a loss of 120 million USD a year earlier, and a net margin of 1.4% versus -6.1%. However, the EBITDA margin compressed to 8.8% from 15.0%, and revenue growth of 331,080.1% is incomparable with the company's prior base. Debt of 3,907 million USD at the latest annual balance sheet remains without an assessment of its movement over the quarter. The key question for a holder is whether the new revenue scale is sustainable and whether the margin will return to its prior level. In our view, the share looks attractive at the current price: the portal's model implies +80% upside, but margin compression and debt uncertainty call for caution.
Open the company's financial profile ORBIA →
See also: market overview · valuation map · stock screeners