Walmex: revenue accelerated to +3.0%, but EBITDA and profit lag behind

In its third-quarter 2026 report, Walmex posted revenue of MXN 248.8 bn, up 3.0% year on year, an acceleration from 1.9% in the second quarter. EBITDA fell 9.2% to MXN 22.9 bn and net profit declined 6.1% to MXN 11.0 bn, with the EBITDA margin narrowing to 9.2% from 10.5%. At an EV/EBITDA of 7.9 against its own three-year average of 10.7 the share is cheaper than its history, but weak margin and profit growth below revenue leave the assessment neutral.
Key takeaways
— Revenue accelerated to +3.0% year on year, but growth remains modest for a chain of this scale
— EBITDA fell 9.2% and the margin narrowed to 9.2% from 10.5% – costs are growing faster than revenue
— Net profit declined 6.1% to MXN 11.0 bn, with margin pressure outweighing revenue growth
— Net debt remains negative: -MXN 27.1 bn at end-September, net debt/EBITDA LTM at -0.24
— Free cash flow is positive: operating cash flow of MXN 15.0 bn against capex of MXN 11.8 bn
— Dividend yield of 3.5% on payouts funded from stable cash flow
— EV/EBITDA of 7.9 is below its own three-year average of 10.7, but the portal model implies only -1% upside
Attractiveness
Key figures, MXN bn
| Metric | Q3 2025 | Q3 2026 | Change |
|---|---|---|---|
| Revenue | 242 | 249 | +3.0% |
| EBITDA | 25.3 | 22.9 | -9.2% |
| Operating profit | 19.0 | 18.7 | -1.8% |
| Net profit | 11.7 | 11.0 | -6.1% |
| Operating cash flow | 22.0 | 15.0 | -32.0% |
| Capex | 11.7 | -11.8 | -200.1% |
| EBITDA margin | 10.5% | 9.2% | -1.3 pp |
| Net margin | 4.9% | 4.4% | -0.5 pp |
Revenue accelerated to +3.0% year on year, but growth remains modest for a chain of this scale
Revenue in the third quarter of 2026 was MXN 248.8 bn, up 3.0% on the same quarter a year earlier. That is an acceleration from 1.9% in the second quarter of 2026 and 1.7% in the first. The pace remains modest: growth was 3.0% in the fourth quarter of 2025 and 8.3% in the second quarter of 2025.
Over the trailing twelve months revenue was MXN 1,027.6 bn. The quarterly pattern shows that after a slowdown in early 2026 the chain returned to growth of around 3%. The 1.1 percentage point acceleration versus the second quarter is a positive signal, but for a retailer of this scale it is modest.
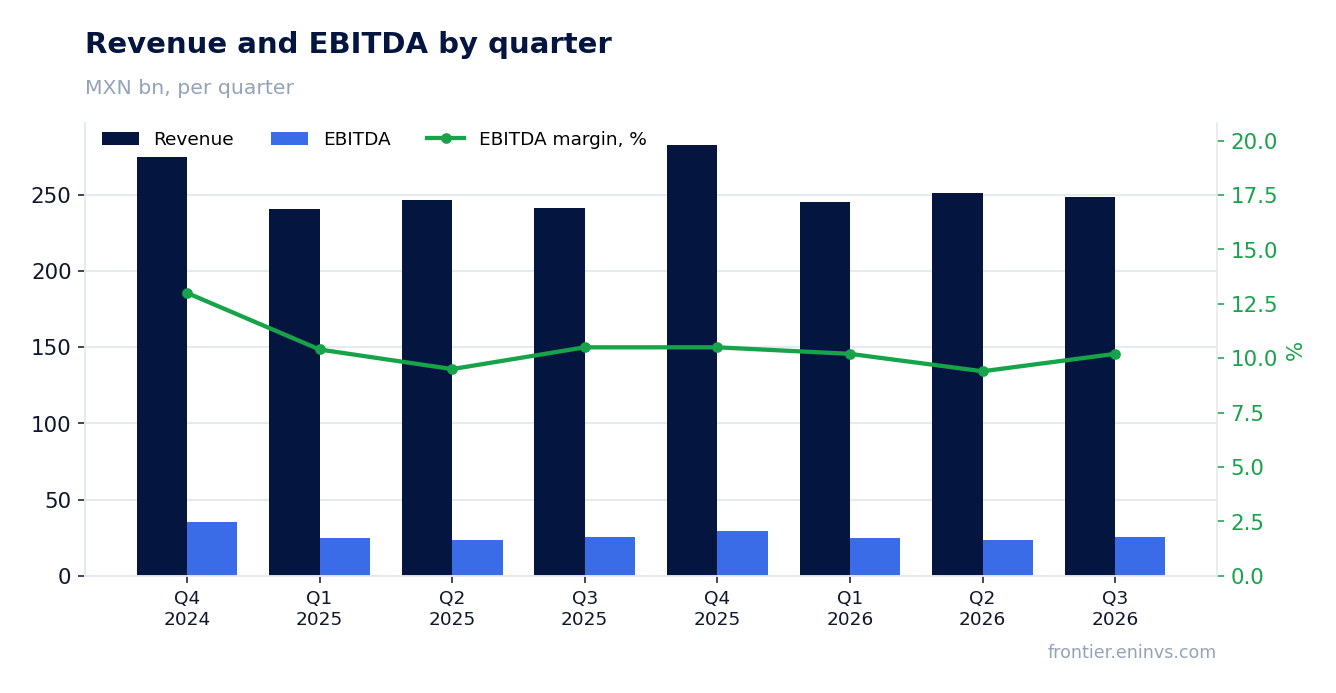
EBITDA fell 9.2% and the margin narrowed to 9.2% from 10.5% – costs are growing faster than revenue
EBITDA in the third quarter of 2026 was MXN 22.9 bn, down 9.2% year on year. The EBITDA margin narrowed to 9.2% from 10.5% a year earlier. With revenue up 3.0%, this means costs grew faster than sales.
Operating profit was MXN 18.7 bn. The 1.3 percentage point margin compression is the main negative of the report: it outweighed the revenue acceleration. Over the trailing twelve months EBITDA was MXN 113.7 bn, and the current quarter is below that average level.
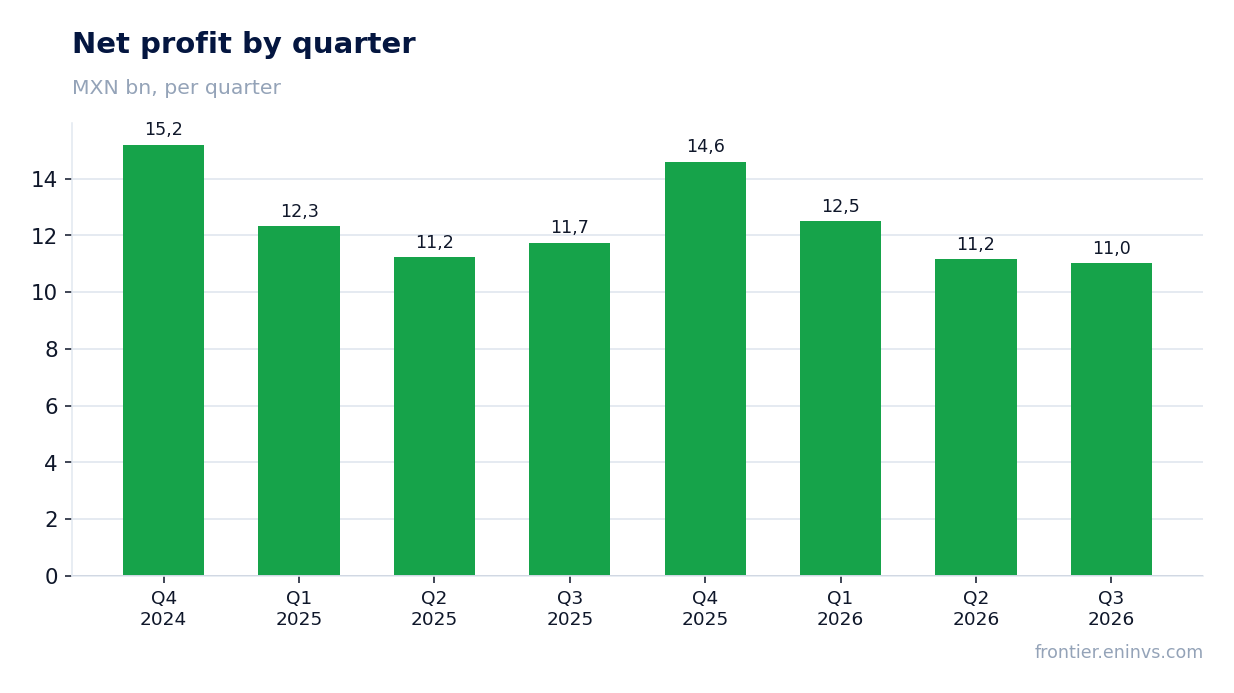
Net profit declined 6.1% to MXN 11.0 bn, with margin pressure outweighing revenue growth
Net profit in the third quarter of 2026 was MXN 11.0 bn, down 6.1% year on year. The net margin narrowed to 4.4% from 4.9%. The decline in profit is smaller than the fall in EBITDA, pointing to support below the operating line.
Over the trailing twelve months net profit was MXN 49.3 bn. Return on equity is 18.1%. Profit remains substantial, but its dynamics are worse than revenue: the company is growing in sales, not in money.
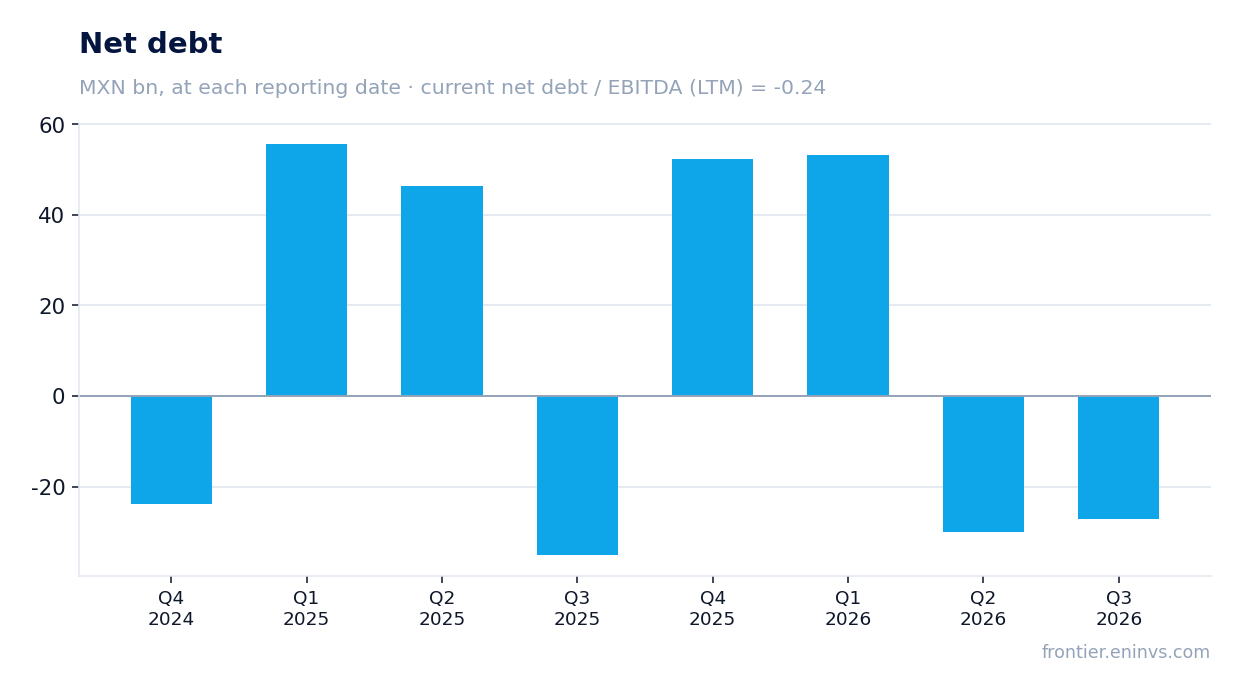
Net debt remains negative: -MXN 27.1 bn at end-September, net debt/EBITDA LTM at -0.24
Net debt at 30 September 2026 was -MXN 27.1 bn, meaning cash exceeds debt obligations. The ratio of net debt to trailing-twelve-month EBITDA is -0.24. That is a level with no debt burden.
Over the quarter net debt moved from -MXN 30.1 bn at 30 June 2026 to -MXN 27.1 bn at 30 September 2026, a change of +MXN 3.1 bn. Over twelve months it moved from -MXN 35.2 bn at 30 September 2025 to -MXN 27.1 bn, a change of +MXN 8.1 bn. Negative net debt remains a cushion.
Free cash flow is positive: operating cash flow of MXN 15.0 bn against capex of MXN 11.8 bn
Operating cash flow in the third quarter of 2026 was MXN 15.0 bn, with capital expenditure of MXN 11.8 bn. The difference of about MXN 3.2 bn remains positive, though small relative to revenue. Over the trailing twelve months operating cash flow was MXN 81.6 bn.
Capex of MXN 11.8 bn is comparable to the third quarter of 2025 – MXN 11.7 bn. The chain continues to invest in development, and against quarterly EBITDA of MXN 22.9 bn the investment takes about half. Free cash flow covers the dividend, but the cushion is thin.
Dividend yield of 3.5% on payouts funded from stable cash flow
The trailing-twelve-month dividend yield is 3.5% on the current price. Payouts rest on operating cash flow of MXN 81.6 bn over the trailing twelve months and net profit of MXN 49.3 bn. With negative net debt of -MXN 27.1 bn the chain has room for payouts.
Our estimate for the current year's dividend assumes profit around MXN 49 bn and a payout ratio close to the historical one. The risk to the payout is further margin compression: if EBITDA keeps falling, profit and the dividend come under pressure. A 3.5% yield is moderate and does not offset weak profit dynamics.
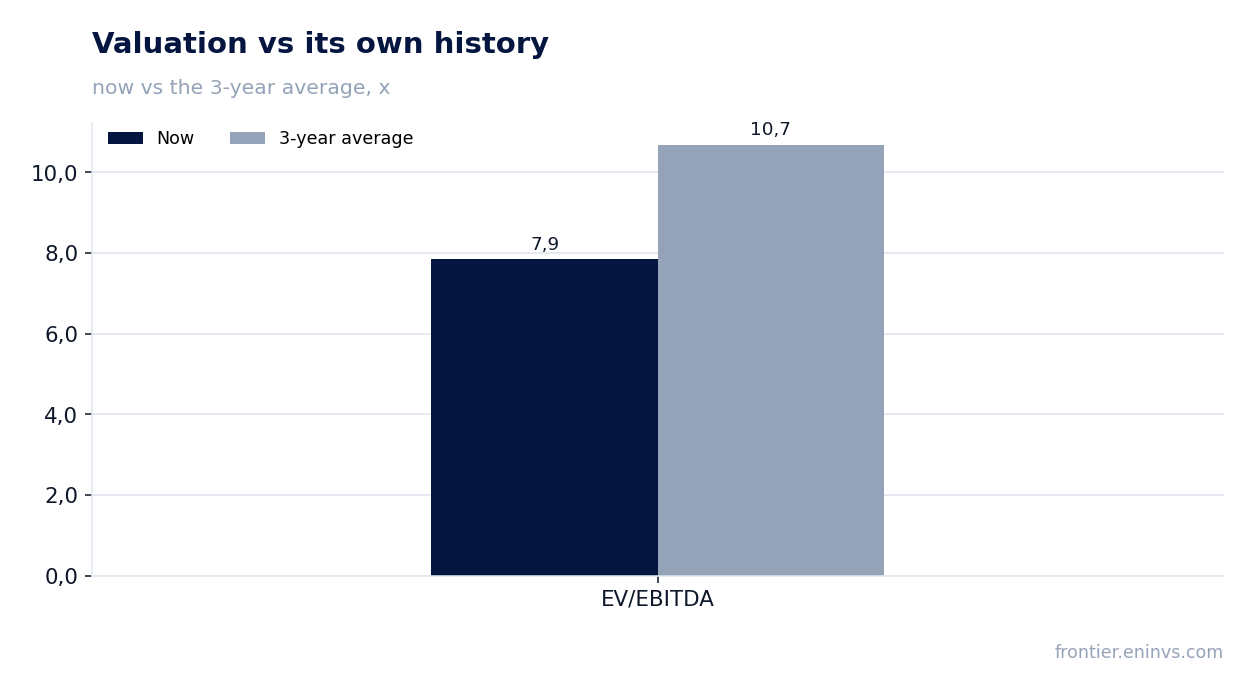
EV/EBITDA of 7.9 is below its own three-year average of 10.7, but the portal model implies only -1% upside
EV/EBITDA over the trailing twelve months is 7.9 against its own three-year average of 10.7, i.e. 27% below. On this multiple the share is cheaper than its history. P/E over the trailing twelve months is 17.1, and market capitalisation is MXN 840.5 bn.
The portal model, which compares EBITDA growth with the target multiple, implies -1% upside to fair value. That is, the current price already reflects weak profit growth. The discount to history is real, but it reflects margin compression rather than undervaluation.
Valuation on the latest reported figures
| Metric | Value |
|---|---|
| Market cap | 840 bn MXN |
| P/E (LTM) | 17.1 |
| EV/EBITDA (LTM) | 7.9 |
| P/B | 3.57 |
| Net debt / EBITDA (LTM) | -0.24 |
| Operating cash flow (LTM) | 81.6 bn |
| ROE | 18.1% |
| Dividend yield (12m) | 3.5% |
| EV/EBITDA, 3-year average | 10.7 |
Bottom line
The report's strength remains revenue: it accelerated to +3.0% year on year, and net debt is negative at -MXN 27.1 bn, with a net debt/EBITDA ratio of -0.24. The weakness lies elsewhere: EBITDA fell 9.2%, the margin narrowed to 9.2% from 10.5%, and net profit declined 6.1%. The discount to its own history – EV/EBITDA of 7.9 against an average of 10.7 – is real, but the portal model implies only -1% upside, meaning the price already reflects weak profit growth. For a holder the key question is whether margin compression stops; until then the share looks neutral.
Open the company's financial profile WALMEX →
See also: market overview · valuation map · stock screeners