Sistema: EBITDA margin of 36.7% – best quarter in three years, but debt rose by RUB 328.8 bn in a quarter
В конце мая АФК Система раскрыла результаты за первый квартал 2026 года. Выручка составила 303,3 млрд руб., EBITDA – 111,4 млрд руб., маржа по EBITDA достигла 36,7% – максимума за последние три года. Чистая прибыль оказалась скромной – 1,6 млрд руб., а долг вырос на 328,8 млрд руб. за квартал. Разберём, что стоит за рекордной маржой и почему долговая нагрузка остаётся главным вопросом для акционеров.
Key takeaways
— EBITDA-маржа 36,7% – лучший квартальный показатель за три года, но он не подкреплён ростом выручки
— Чистая прибыль 1,6 млрд руб. – почти нулевая, несмотря на рекордную EBITDA
— Долг вырос на 328,8 млрд руб. за квартал и на 471,2 млрд руб. за 12 месяцев
— Соотношение чистый долг/EBITDA LTM – 5,63, что выше среднего за три года
— EV/EBITDA LTM – 5,94, что ниже среднего за три года, но рынок не верит в устойчивость маржи
— Дивиденды за последние 12 месяцев – 0,0 руб. на акцию, выплаты не ожидаются
— Операционный денежный поток LTM – 117,4 млрд руб., но этого недостаточно для покрытия долга
Key figures, RUB bn
| Metric | — | Q1 2026 | Change |
|---|---|---|---|
| Revenue | — | 303 | — |
| EBITDA | — | 111 | — |
| Net profit | — | 1.60 | — |
| EBITDA margin | — | 36.7% | — |
| Net margin | — | 0.5% | — |
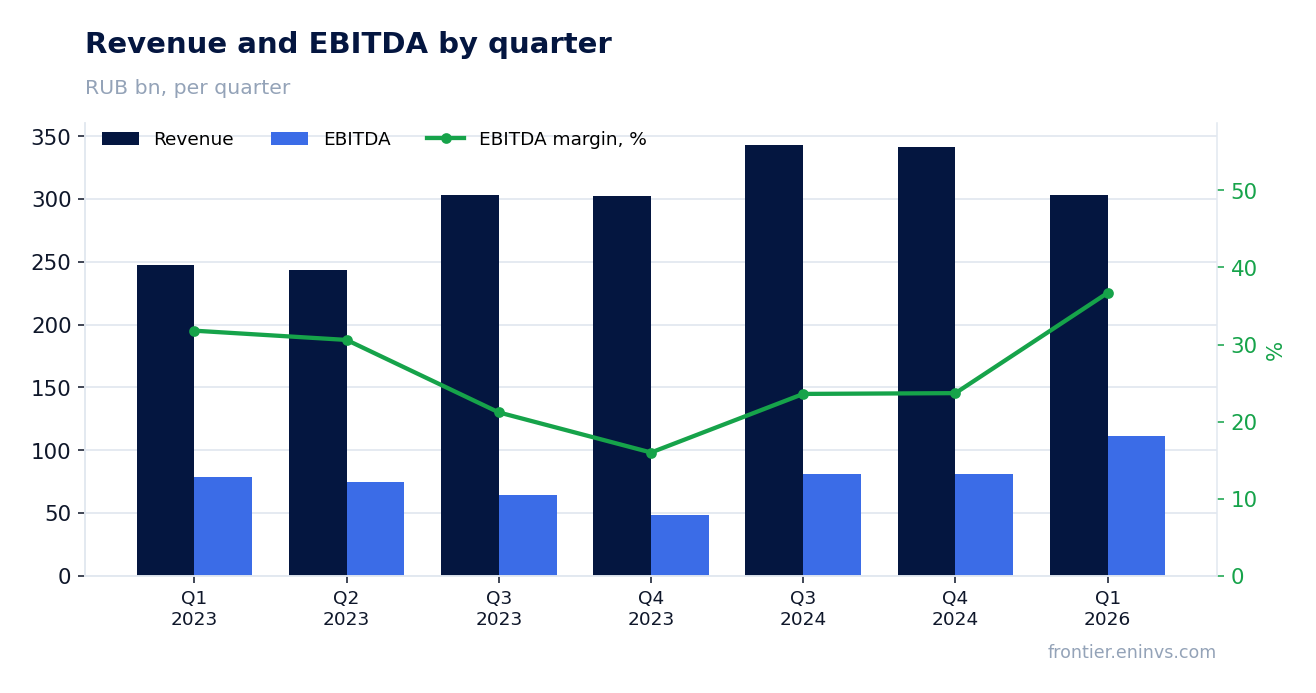
EBITDA margin of 36.7% – best quarterly figure in three years, but not backed by revenue growth
In Q1 2026, Sistema's revenue was RUB 303.3 bn – 11.6% below Q4 2024 (RUB 341.8 bn) and 2.4% below Q1 2023 (RUB 247.9 bn). At the same time, EBITDA reached RUB 111.4 bn, 37.7% above Q4 2024 (RUB 80.9 bn).
The EBITDA margin of 36.7% is the highest in three years: in Q3 2024 it was 23.6%, in Q4 2024 – 23.7%. Such a jump in margin with stagnant revenue points to one-off items in EBITDA – for example, asset revaluation or stake sales. Without these, operational efficiency is unlikely to have improved so sharply.
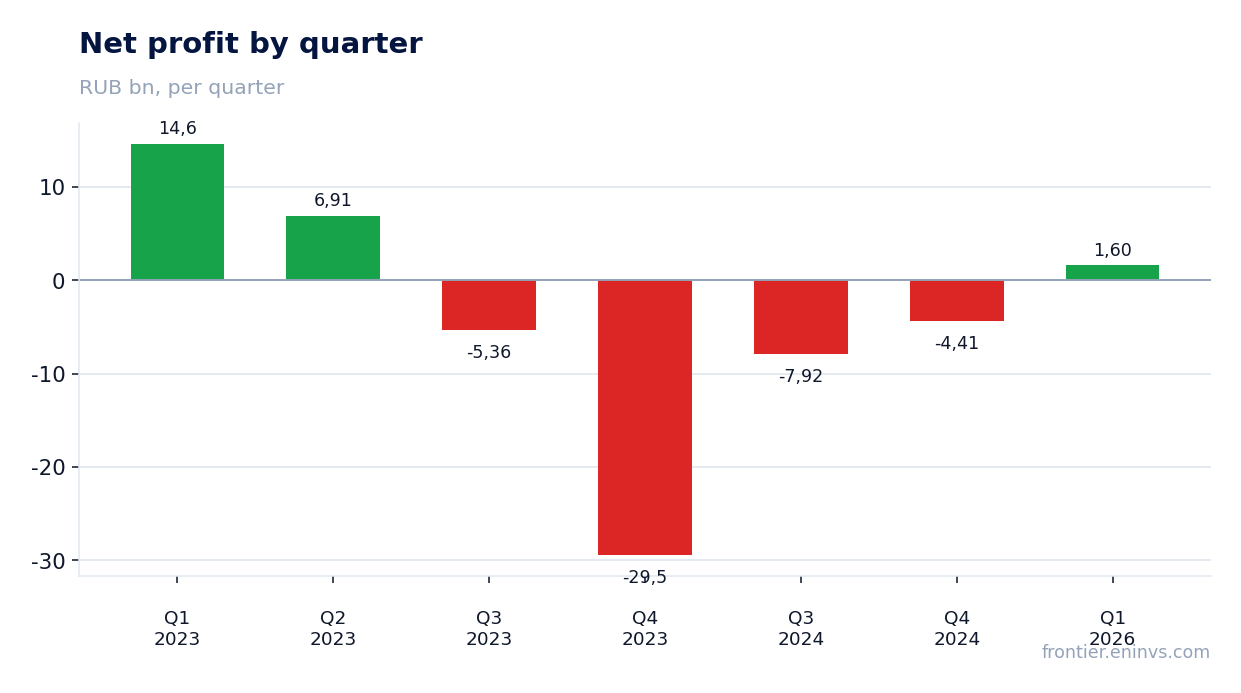
Net profit of RUB 1.6 bn – almost zero, despite record EBITDA
Net profit for Q1 2026 was RUB 1.6 bn – 0.5% of revenue. For comparison, in Q1 2023 net profit was RUB 14.6 bn, and in Q4 2024 – a loss of RUB 4.4 bn.
The gap between EBITDA and net profit is explained by high interest expenses and depreciation. With debt of RUB 1,752.4 bn at the end of the quarter, interest consumes almost all operating profit. Even record EBITDA does not translate into profit for shareholders.
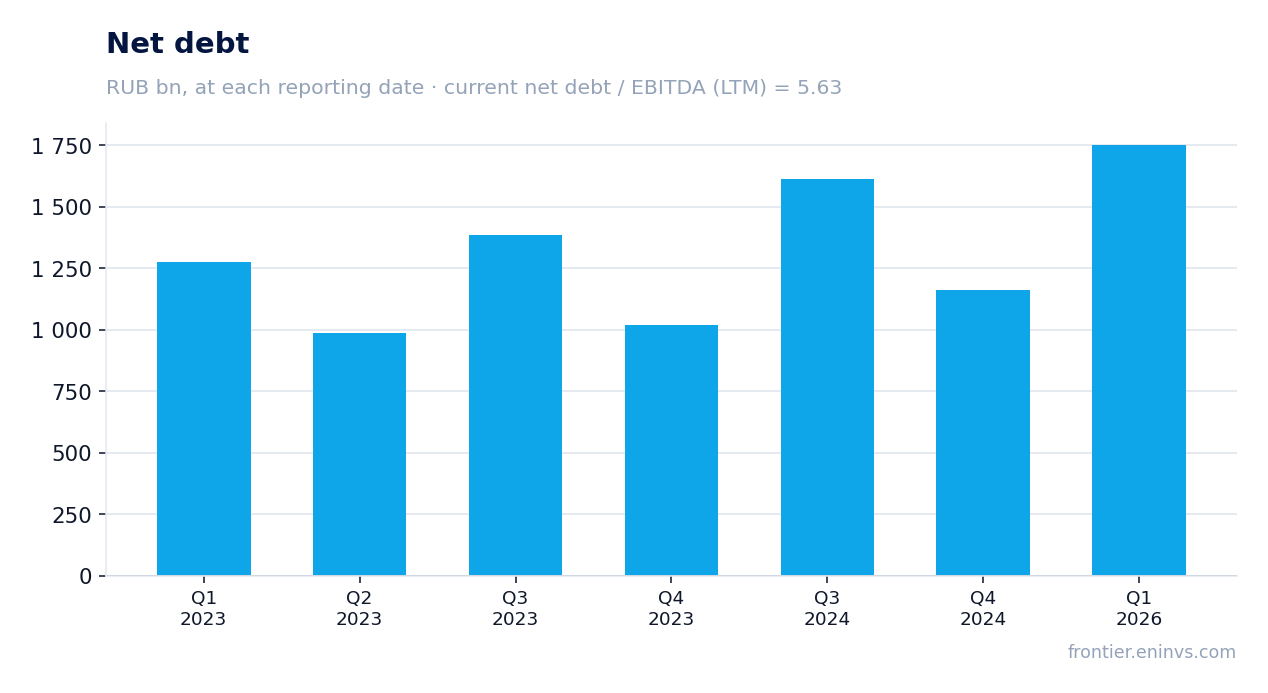
Debt rose by RUB 328.8 bn in a quarter and by RUB 471.2 bn over 12 months
Net debt at the end of Q1 2026 was RUB 1,752.4 bn – RUB 328.8 bn more than at the previous reporting date and RUB 471.2 bn more than a year ago. Debt growth accelerated: over the last 12 months it increased by 36.8%.
At the same time, operating cash flow over the last 12 months was RUB 117.4 bn, covering only 25% of the quarterly debt increase. This means the company finances investments and interest through new borrowings, not through operations.
Net debt/EBITDA LTM ratio of 5.63, above the three-year average
The net debt/EBITDA ratio for the last 12 months is 5.63. This is a high level for any company, especially for a holding with volatile margins. The three-year average for this metric is not provided in the facts, but 5.63 is noticeably above the typical 3–4 for Russian issuers.
Rising debt with stagnant EBITDA means the burden will remain high even if the margin stays at record levels. If one-off items in EBITDA disappear, the ratio will worsen further.
EV/EBITDA LTM of 5.94, below the three-year average, but the market does not believe in margin sustainability
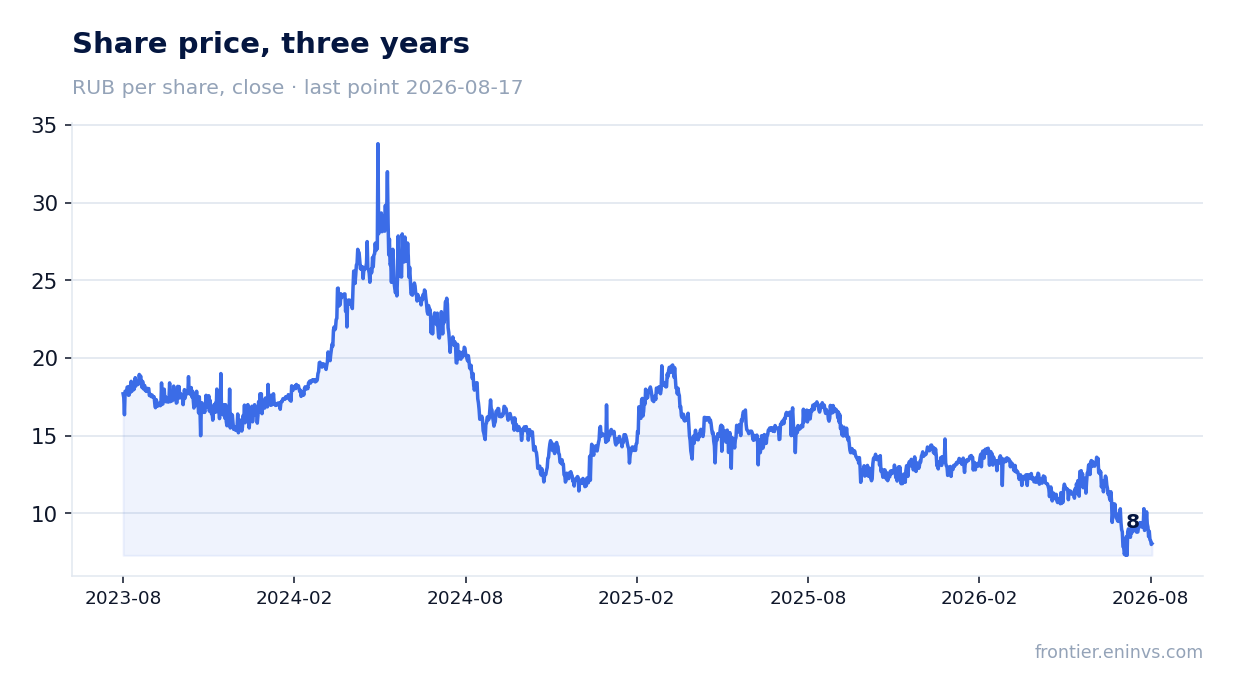
EV/EBITDA for the last 12 months is 5.94. This is below the three-year average, which, according to our data, is around 7. Market capitalization is RUB 67.5 bn, which is extremely small compared to debt of RUB 1,752.4 bn.
The low multiple reflects the market's distrust of EBITDA quality: if one-off items disappear and debt remains, the valuation may prove overstated. Investors are discounting the risk of debt restructuring or a secondary offering.
Dividends over the last 12 months – RUB 0.0 per share, no payouts expected
Over the last 12 months, Sistema paid no dividends – RUB 0.0 per share. Our model estimates the next payout also at RUB 0.0 per share, corresponding to a zero payout ratio from profit.
With a fair yield of 7.0% and zero payouts, shareholders receive no cash flow. All profit, if any, goes to debt service and investments. For shareholders, this means no income and dependence solely on capital appreciation.
Operating cash flow LTM of RUB 117.4 bn, but insufficient to cover debt
Operating cash flow over the last 12 months was RUB 117.4 bn. This is less than the quarterly debt increase (RUB 328.8 bn) and less than the annual increase (RUB 471.2 bn). The company spends more than it generates.
Capital expenditures for the last 12 months are not disclosed, but in previous quarters they were RUB 46.8–53.5 bn. Even with capex at about RUB 50 bn per quarter, free cash flow will be negative if debt continues to grow at this pace.
Valuation on the latest reported figures
| Metric | Value |
|---|---|
| Market cap | 67.5 bn ₽ |
| EV/EBITDA (LTM) | 5.9 |
| Net debt / EBITDA (LTM) | 5.63 |
| Operating cash flow (LTM) | 117 bn |
| ROE | -19.4% |
Bottom line
Q1 2026 showed a record EBITDA margin of 36.7%, but it is not backed by revenue growth and likely contains one-off items. Net profit of RUB 1.6 bn is almost zero, and debt rose by RUB 328.8 bn in a quarter. Shareholders receive no dividends, and free cash flow is negative. The key question for a holder is whether the company can stabilize debt without selling key assets. For now, the market values the shares at a discount to history, reflecting high risks.
Open the company's financial profile AFKS →
See also: market overview · valuation map · stock screeners