Acron: profit up almost half again, but the trailing dividend yield is only 1.4%
On 28 September Acron reported results for the second quarter of 2026. Revenue rose 6.5% year on year to RUB 61.0 bn, EBITDA – by 27.0% to RUB 31.4 bn, net profit – by 48.9% to RUB 23.4 bn. The EBITDA margin climbed to 51.4% from 43.2% a year earlier, while net debt stood at RUB 126.7 bn as of 30 June. Yet the stock trades above its own three-year average multiple, and the trailing dividend yield is only 1.4% against the 10.5% we consider fair for this name. The shares look neutral: the strong quarter is already in the price, and the dividend stream does not yet justify expectations.
Key takeaways
— Revenue rose 6.5% year on year, but that is slower than the first quarter, when it fell 22.5%
— EBITDA added 27.0%, and the margin climbed to 51.4% – the best level in recent quarters
— Net profit rose 48.9% to RUB 23.4 bn, with its margin reaching 38.4% versus 27.5% a year earlier
— Operating cash flow of RUB 18.3 bn did not cover capital expenditure of RUB 20.4 bn
— Net debt fell to RUB 126.7 bn from RUB 129.0 bn at the end of March, but rose by RUB 20.4 bn over the year
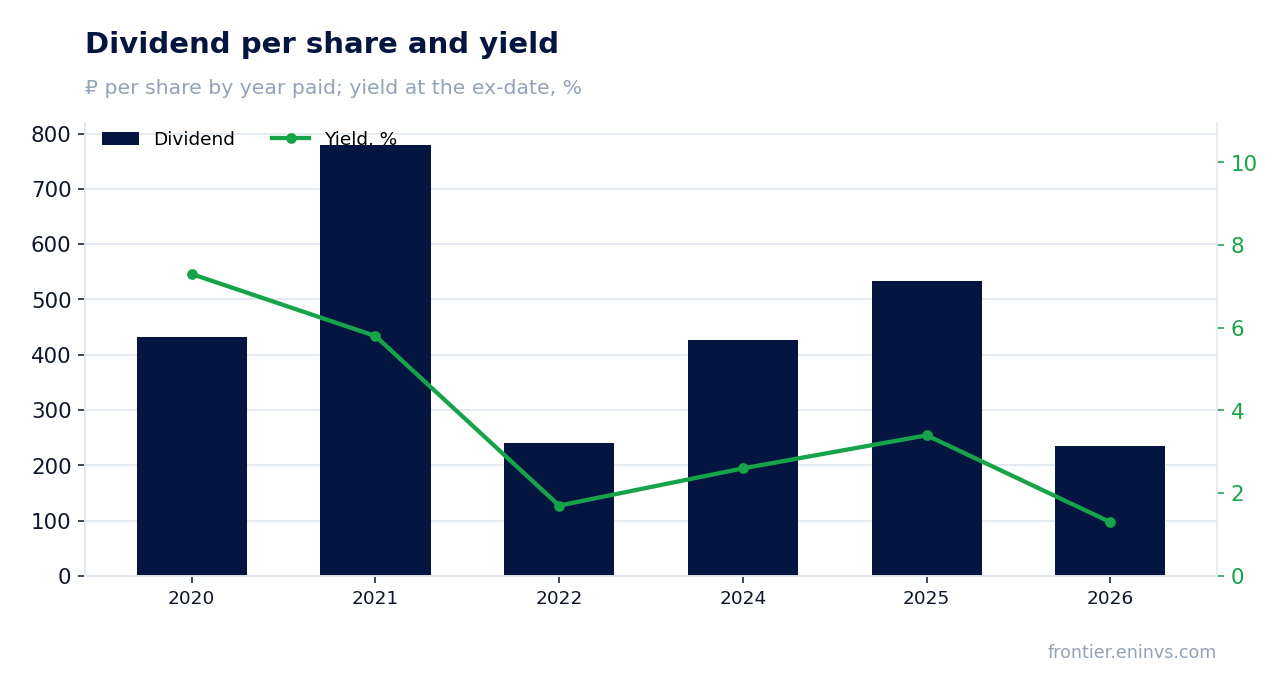
— The dividend over the last 12 months is RUB 235 per share, a yield of only 1.4% against a key rate of 14.0%
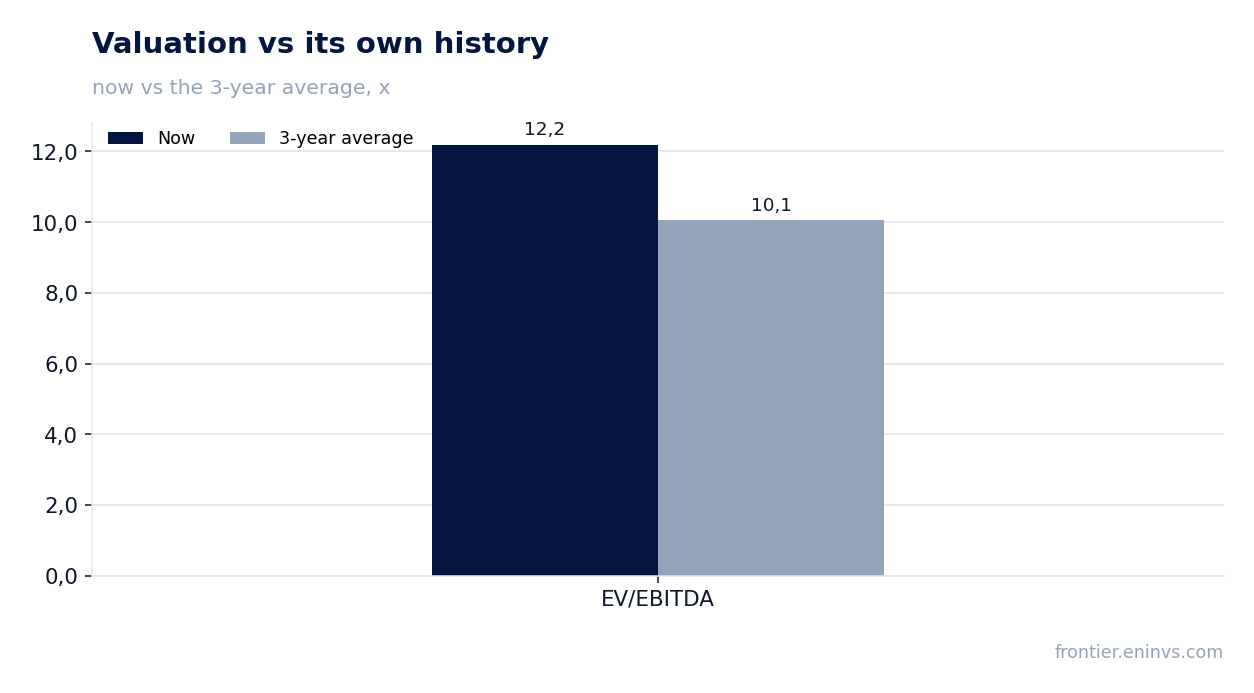
— The stock trades at EV/EBITDA of 12.2 versus a three-year average of 10.1, and the portal model implies a 3% downside to fair value
Attractiveness
Key figures, RUB bn
| Metric | Q2 2025 | Q2 2026 | Change |
|---|---|---|---|
| Revenue | 57.3 | 61.0 | +6.5% |
| EBITDA | 24.7 | 31.4 | +27.0% |
| Operating profit | 21.1 | 26.9 | +27.4% |
| Net profit | 15.7 | 23.4 | +48.9% |
| Operating cash flow | 11.9 | 18.3 | +53.7% |
| Capex | 11.7 | 20.4 | +75.0% |
| EBITDA margin | 43.2% | 51.4% | +8.2 pp |
| Net margin | 27.5% | 38.4% | +10.9 pp |
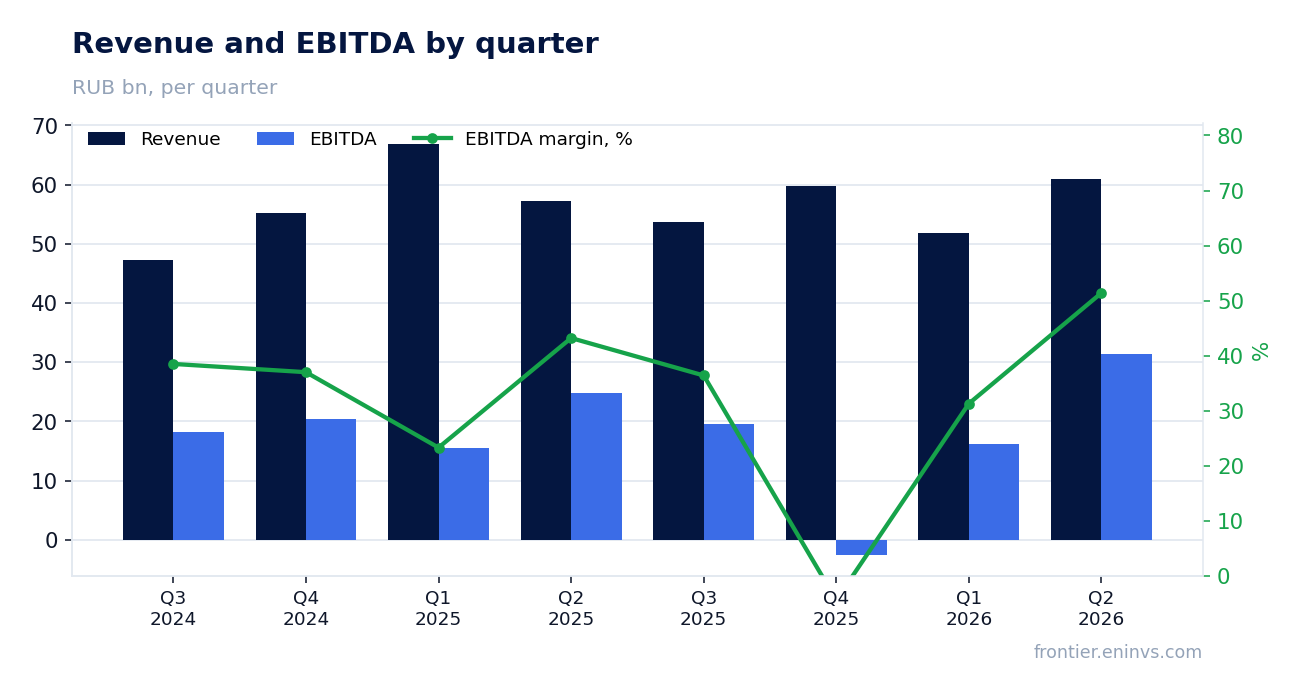
Revenue rose 6.5% year on year, but that is slower than the first quarter, when it fell 22.5%
In the second quarter of 2026, Acron's revenue reached RUB 61.0 bn, up 6.5% year on year. That is markedly slower than the first quarter, when it fell 22.5%. However, compared with the first quarter of this year, the dynamics improved: then revenue was shrinking, now it is growing.
The main contribution to growth likely came from mineral fertiliser prices, which remained high. Sales volumes may also have increased, but the report does not provide exact data. Importantly, the company has returned to growth after the slump at the start of the year.
EBITDA added 27.0%, and the margin climbed to 51.4% – the best level in recent quarters
EBITDA in the second quarter of 2026 rose 27.0% year on year to RUB 31.4 bn. The EBITDA margin was 51.4% versus 43.2% a year earlier. This is the highest margin level in several quarters.
Such margin growth could be driven by favourable pricing as well as cost reductions. However, without a breakdown of expenses, it is impossible to say for sure. Notably, in the first quarter of 2026 EBITDA was RUB 16.3 bn, meaning it nearly doubled in the second quarter.
Net profit rose 48.9% to RUB 23.4 bn, with its margin reaching 38.4% versus 27.5% a year earlier
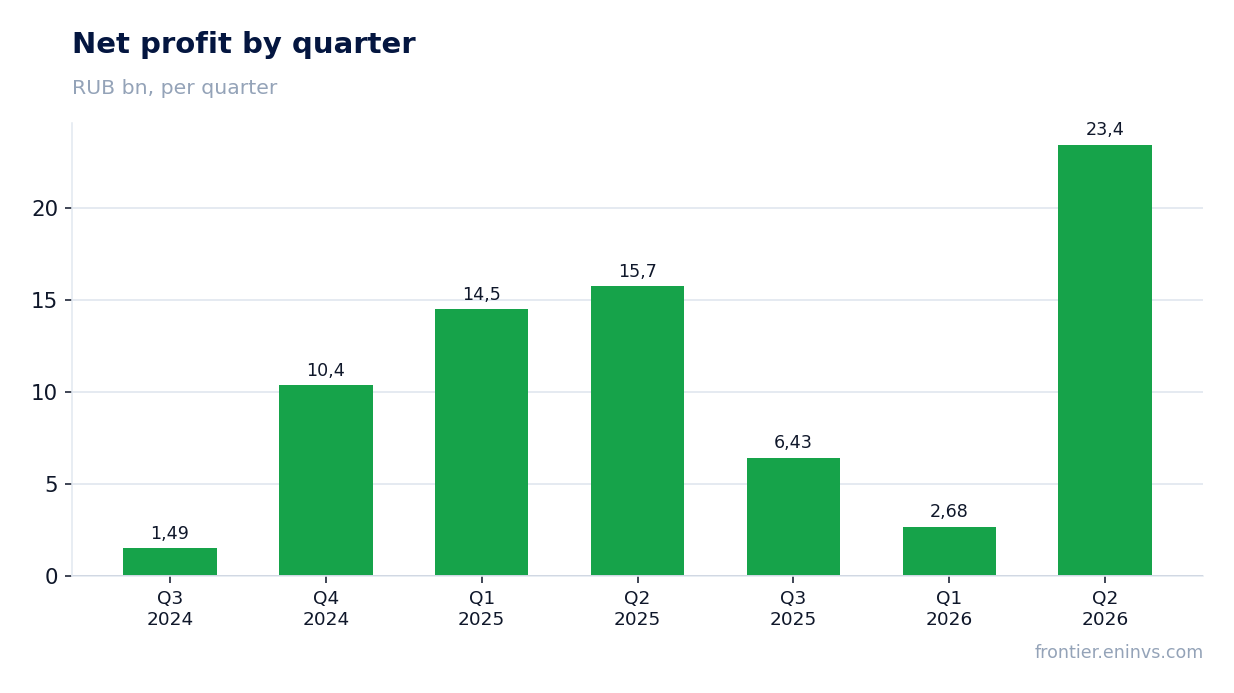
Net profit in the second quarter of 2026 was RUB 23.4 bn, up 48.9% year on year. The net margin rose to 38.4% from 27.5% a year earlier. This growth outpaces EBITDA dynamics, which may indicate lower interest expenses or one-off factors.
In the first quarter of 2026, net profit was only RUB 2.7 bn, so the second quarter saw a sharp jump. This could be due to seasonality or improved operational efficiency. Without additional data, it is difficult to isolate the one-off component.
Operating cash flow of RUB 18.3 bn did not cover capital expenditure of RUB 20.4 bn
Operating cash flow in the second quarter of 2026 was RUB 18.3 bn, while capital expenditure was RUB 20.4 bn. Thus, free cash flow was negative. This means the company funded investments through debt or accumulated funds.
In the first quarter of 2026, operating cash flow was only RUB 1.0 bn, and capital expenditure was RUB 7.9 bn. In the second quarter, both figures increased, but capital expenditure still exceeds operating cash flow. This may be due to the implementation of an investment programme.
Net debt fell to RUB 126.7 bn from RUB 129.0 bn at the end of March, but rose by RUB 20.4 bn over the year
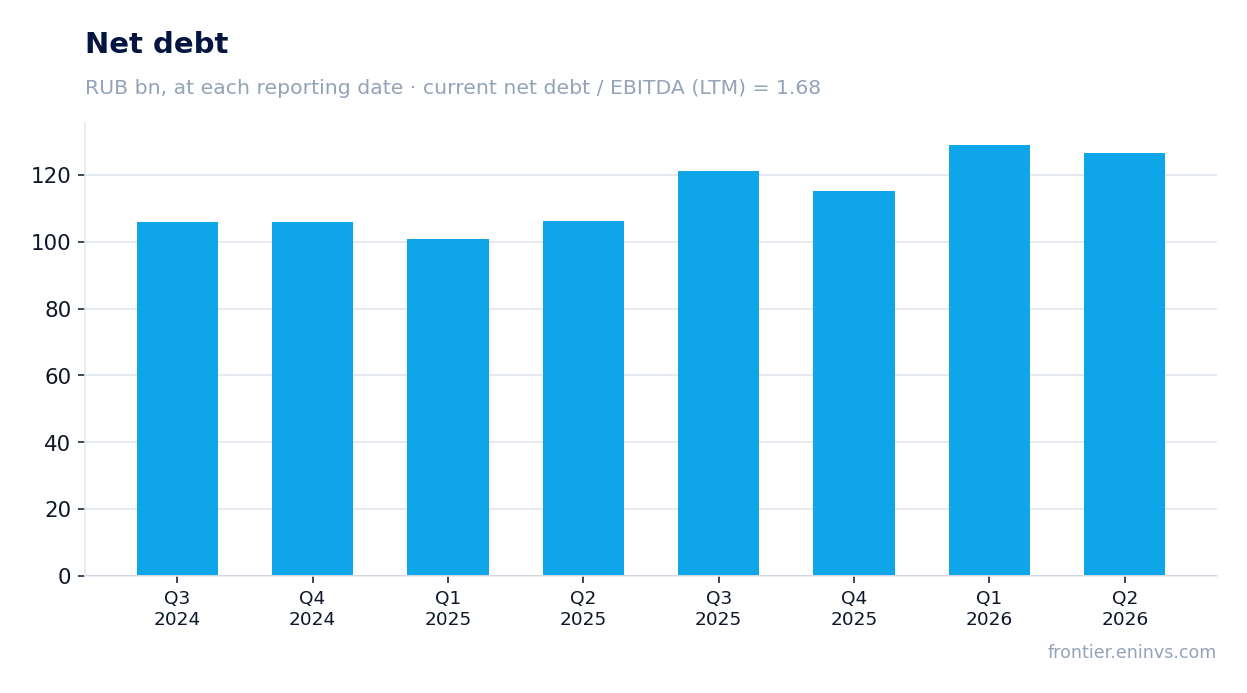
Net debt as of 30 June 2026 was RUB 126.7 bn, down from RUB 129.0 bn as of 31 March 2026. However, over the last 12 months, net debt increased by RUB 20.4 bn – from RUB 106.3 bn as of 30 June 2025.
The net debt to EBITDA ratio over the last 12 months is 2.13. This is a moderate level, but it is higher than a year ago when debt was lower. The company continues to invest, which requires financing.
The dividend over the last 12 months is RUB 235 per share, a yield of only 1.4% against a key rate of 14.0%
Over the last 12 months, Acron paid RUB 235 per share, giving a dividend yield of only 1.4% to the current price. This is significantly below the key rate of 14.0% and our fair yield estimate of 10.5% for this name.
In 2026, the company has already paid RUB 235 per share, and no further payouts are planned for this year. Dividend history shows that in 2025 it paid RUB 534 per share, in 2024 – RUB 427, and in 2021 – RUB 780. The current level of payments is substantially lower.
Our dividend estimate for the current year is based on a payout ratio of 0.46 of profit. However, if current profit and the investment programme persist, payouts may remain modest. The main risk is a further increase in capital expenditure, which would constrain free cash flow.
The stock trades at EV/EBITDA of 12.2 versus a three-year average of 10.1, and the portal model implies a 3% downside to fair value
Acron's current EV/EBITDA over the last 12 months is 12.2, above the three-year average of 10.1. Thus, the stock trades at a premium to its own history. This may be justified by profit growth expectations, but it creates a risk of correction.
Our model, based on current commodity prices and a target EV/EBITDA, shows that the fair value of the share is 3% below the current market price. This is not a target price, but an estimate from the portal's model. At the same time, ROE is 38.6%, indicating high capital efficiency.
Valuation on the latest reported figures
| Metric | Value |
|---|---|
| Market cap | 618 bn ₽ |
| EV/EBITDA (LTM) | 12.2 |
| P/B | 2.95 |
| Net debt / EBITDA (LTM) | 2.13 |
| ROE | 38.6% |
| Dividend yield (12m) | 1.4% |
| EV/EBITDA, 3-year average | 10.1 |
Dividend per share, ₽, and yield at the ex-date
| Year paid | Dividend | Yield |
|---|---|---|
| 2020 | 432.00 | 7.3% |
| 2021 | 780.00 | 5.8% |
| 2022 | 240.00 | 1.7% |
| 2024 | 427.00 | 2.6% |
| 2025 | 534.00 | 3.4% |
| 2026 | 235.00 | 1.3% |
Bottom line
Bottom line: the quarter was strong – revenue rose 6.5%, EBITDA 27.0%, net profit 48.9%, and the EBITDA margin reached 51.4%. However, operating cash flow did not cover capital expenditure, and the dividend yield of 1.4% is well below the key rate and our fair estimate. The stock trades above its three-year average multiple, and the portal model does not imply upside. As a result, the shares look neutral: operational growth is there, but it is already priced in, and the dividend stream does not yet justify expectations.
Open the company's financial profile AKRN →
See also: market overview · valuation map · stock screeners