Alrosa: revenue down a third, EBITDA margin compressed to 21.5%, and the quarter closed in the red
28 сентября мы разбираем отчёт Алросы за второй квартал 2026 года. Выручка составила 45,4 млрд руб., снизившись на 33,2% год к году, EBITDA – 9,8 млрд руб. (–68,7%), чистая прибыль – минус 0,15 млрд руб. против 24,6 млрд годом ранее. Маржа EBITDA сжалась до 21,5% с 45,9%, а операционная прибыль составила лишь 0,3 млрд руб. При текущей цене акция выглядит непривлекательно: падение спроса на алмазы давит на выручку и рентабельность, а долговая нагрузка в 2,17 EBITDA и отсутствие дивидендов за последние 12 месяцев не дают поддержки.
Key takeaways
— Revenue fell 33.2% year-on-year, decelerating from the first quarter
— EBITDA collapsed 68.7%, margin compressed to 21.5% – half of last year's level
— Operating profit nearly wiped out – 0.3 bn RUB on revenue of 45.4 bn
— Net loss of 0.15 bn RUB – a thin line between profit and loss
— Debt rose to 120.1 bn RUB, with net debt/EBITDA LTM at 2.17
— No dividends paid over the last 12 months, and the fair yield of 10.5% remains a benchmark
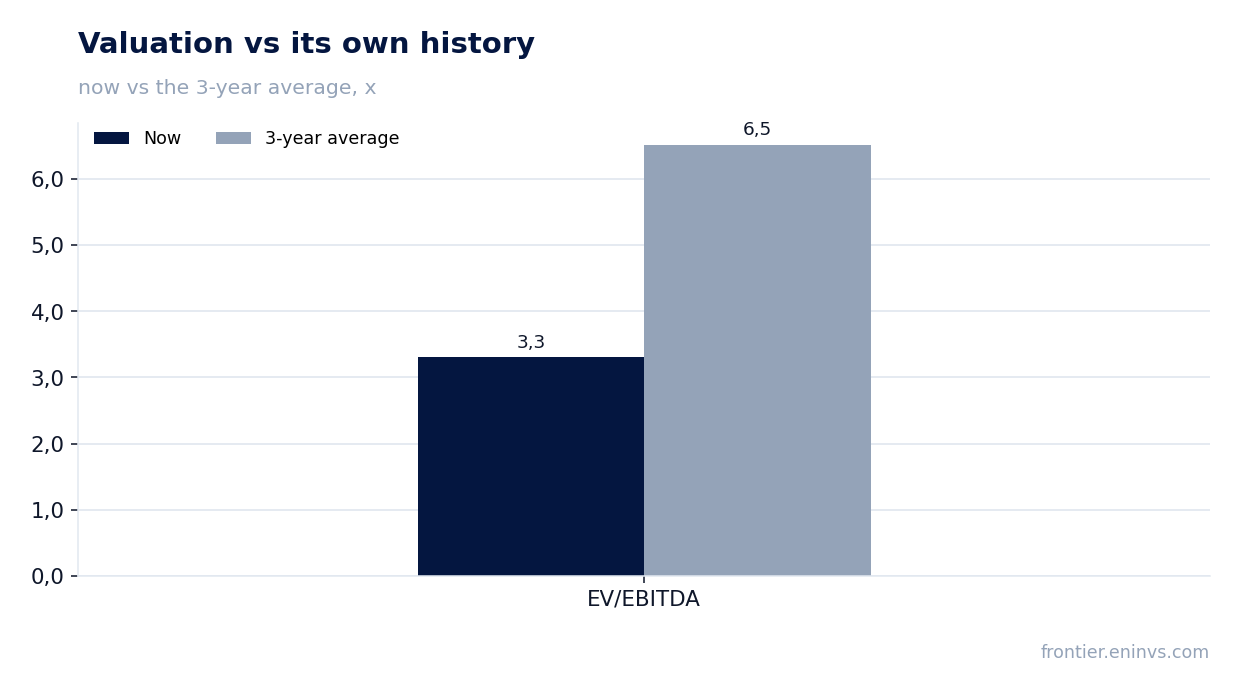
— EV/EBITDA 5.38 is below the 3-year average of 7.57, but the profit decline outweighs this
Attractiveness
Key figures, RUB bn
| Metric | Q2 2025 | Q2 2026 | Change |
|---|---|---|---|
| Revenue | 68.0 | 45.4 | -33.2% |
| EBITDA | 31.2 | 9.76 | -68.7% |
| Operating profit | 22.2 | 0.34 | -98.4% |
| Net profit | 24.6 | -0.15 | -100.6% |
| Operating cash flow | 12.4 | 0.94 | -92.4% |
| Capex | 11.1 | 9.37 | -15.9% |
| EBITDA margin | 45.9% | 21.5% | -24.4 pp |
| Net margin | 36.2% | -0.3% | -36.5 pp |
Revenue fell 33.2% year-on-year, decelerating from the first quarter
Alrosa's revenue in Q2 2026 was 45.4 bn RUB, down 33.2% year-on-year. The decline has continued for a second consecutive quarter: in Q1 the drop was 32.2%, meaning the pace has decelerated. Quarter-on-quarter, revenue was almost flat – 44.9 bn RUB in Q1 versus 45.4 bn in Q2.
The main reason is weak demand for diamonds in key markets. The company does not disclose segment details, but a one-third revenue drop with stable production volumes points to lower realised prices. This is also confirmed by the margin compression: with revenue down 33.2%, EBITDA fell 68.7%.
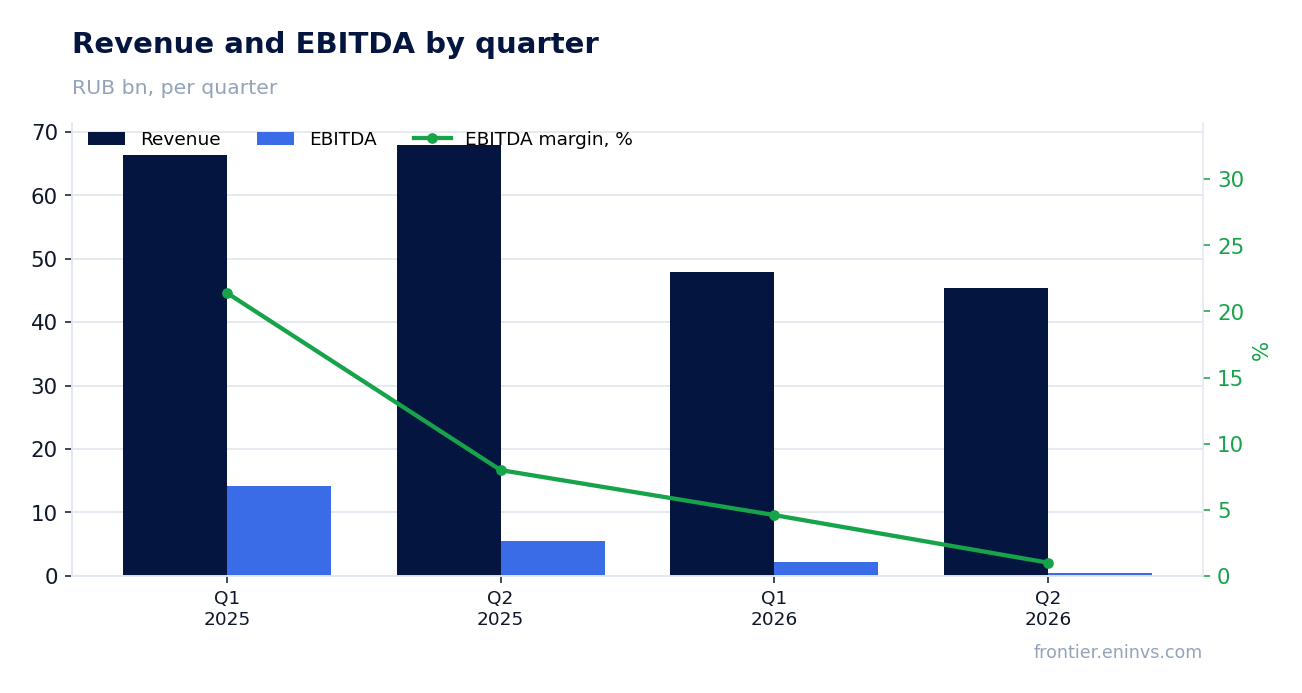
EBITDA collapsed 68.7%, margin compressed to 21.5% – half of last year's level
EBITDA in Q2 2026 was 9.8 bn RUB, down 68.7% year-on-year. The EBITDA margin fell to 21.5% from 45.9% a year earlier. This is the lowest margin in several quarters: even in the weak Q4 2025, the margin was around 7.8%, but revenue was lower then.
The margin compression is explained by fixed costs not falling in proportion to revenue. With revenue down a third, the company cannot quickly cut mining and personnel expenses. As a result, operating profit was only 0.3 bn RUB – almost all earnings were eaten up by costs.
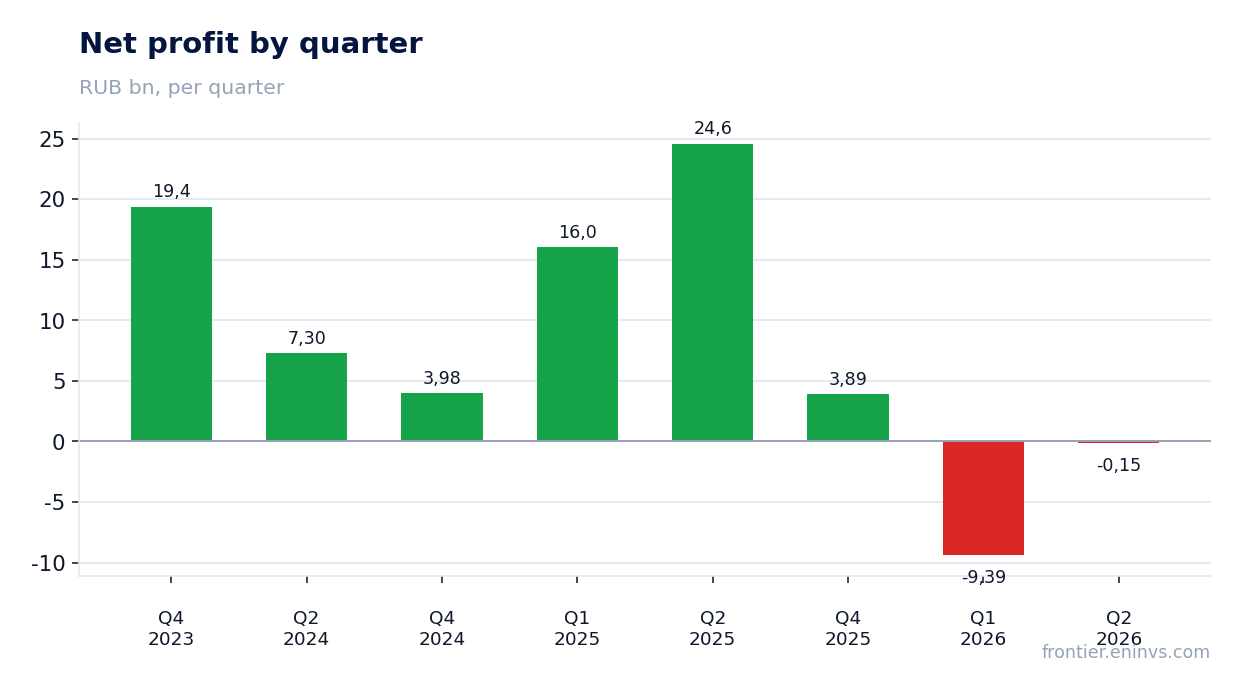
Operating profit nearly wiped out – 0.3 bn RUB on revenue of 45.4 bn
Operating profit in Q2 2026 was 0.3 bn RUB versus 22.2 bn RUB a year earlier. That is a 98.5% decline. With revenue of 45.4 bn RUB, the operating margin is less than 1%.
This dynamic means the company is operating at almost break-even on an operating level. Any further decline in prices or increase in costs could lead to an operating loss. In Q1 2026, there was already an operating loss of 6.0 bn RUB, so Q2 only slightly improved the picture.
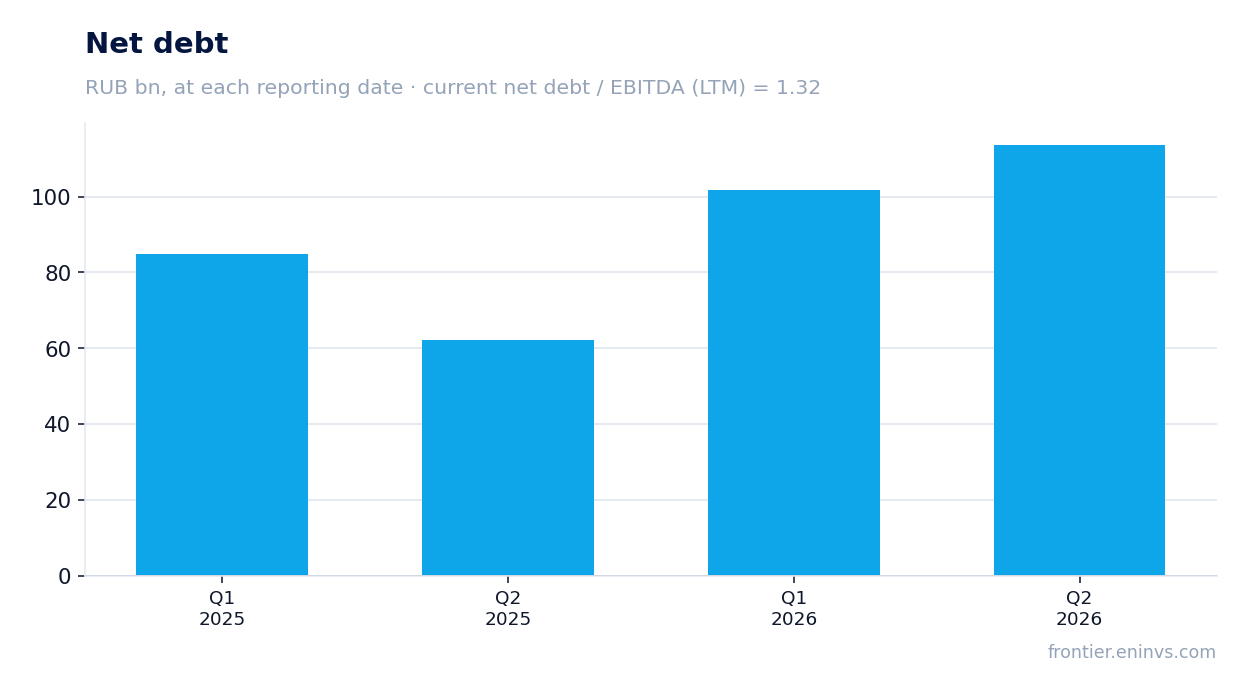
Net loss of 0.15 bn RUB – a thin line between profit and loss
Net loss in Q2 2026 was 0.15 bn RUB versus net profit of 24.6 bn RUB a year earlier. That is a 100.6% decline. The loss is small, but it shows that even with positive EBITDA, the company cannot cover all expenses, including interest on debt and taxes.
In Q1 2026, the loss was significantly larger – 9.4 bn RUB. In Q2, it was reduced to almost zero, but this does not change the overall picture: the company is balancing on the edge of profitability.
Debt rose to 120.1 bn RUB, with net debt/EBITDA LTM at 2.17
Net debt as of 30 June 2026 was 120.1 bn RUB, up from 101.8 bn RUB on 31 March 2026 (+18.2 bn RUB). Over the year, debt rose from 115.7 bn RUB on 30 June 2025 to 120.1 bn RUB (+4.4 bn RUB).
The net debt/EBITDA LTM ratio is 2.17. This is a moderate level, but with falling EBITDA it could rise quickly. Operating cash flow in Q2 2026 was 0.9 bn RUB, while capital expenditures were 9.4 bn RUB, meaning the company spends more on investment than it earns. This forces it to increase debt.
No dividends paid over the last 12 months, and the fair yield of 10.5% remains a benchmark
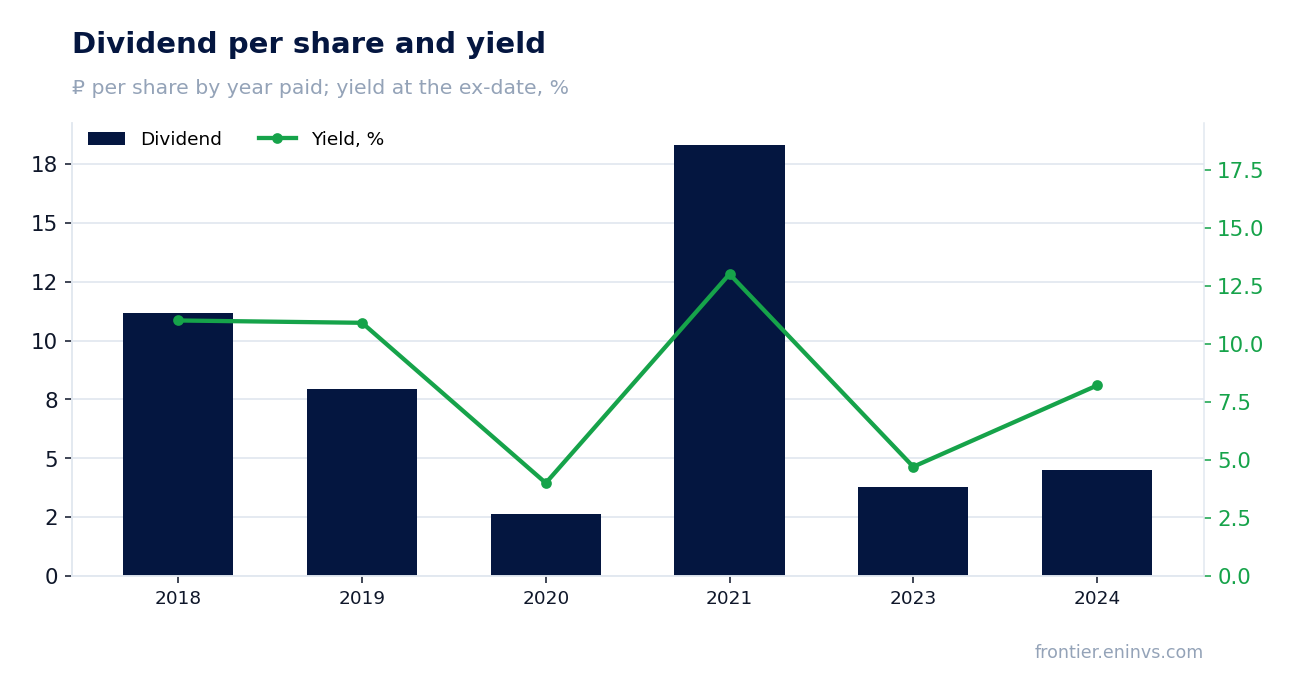
No dividends were paid over the last 12 months – 0.0 RUB per share. No payments have been made this calendar year either, and no further payouts are planned. This is due to losses and the need to direct funds to investments.
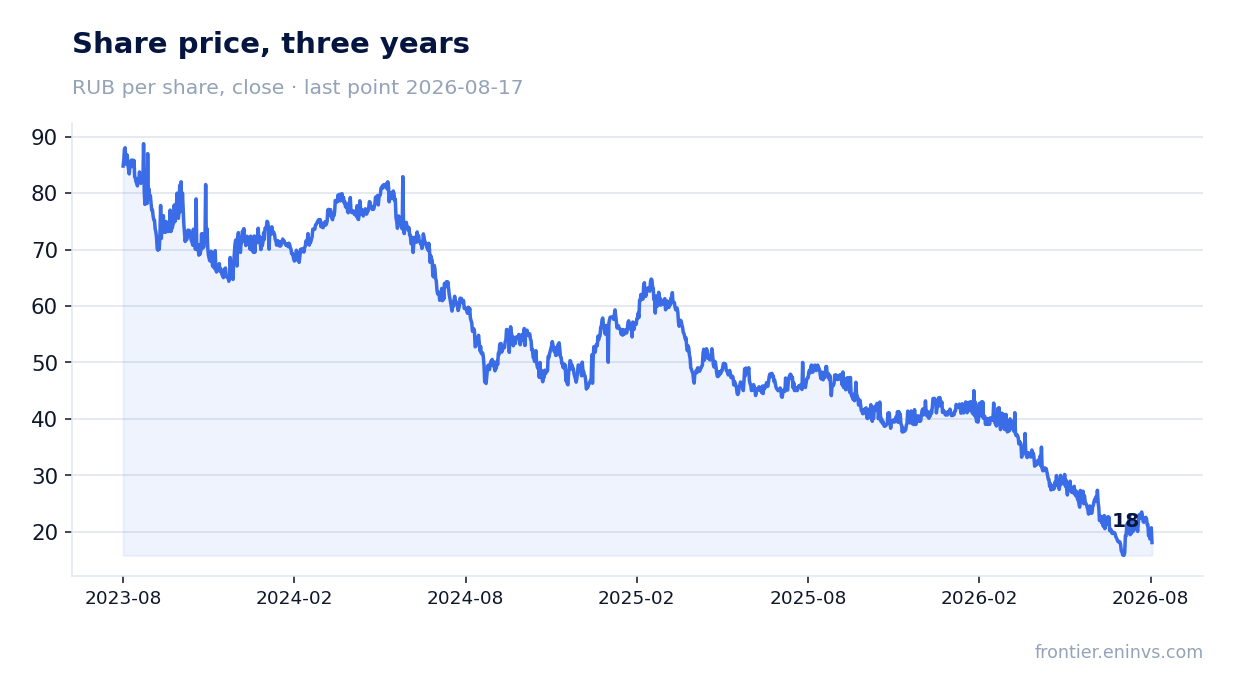
Our estimate of the fair dividend yield for this stock is 10.5%. At the current share price of 18.46 RUB, this would correspond to a dividend of about 1.94 RUB per share. However, with a loss of 0.15 bn RUB for the quarter and no profit over the last 12 months, such dividends are unlikely. The central bank key rate is 14.0%, making risk-free investments more attractive than Alrosa shares without dividends.
EV/EBITDA 5.38 is below the 3-year average of 7.57, but the profit decline outweighs this
The current EV/EBITDA LTM is 5.38, below the 3-year average of 7.57. Formally, the stock trades cheaper than its historical valuation. However, this is due to the fall in EBITDA: LTM EBITDA is 55.4 bn RUB, and if profit declines further, the multiple could rise.
P/E LTM is 11.85, which also does not look high, but the profit over the last 12 months includes stronger previous quarters. According to our model, the fair value of the share, based on current commodity prices and the target EV/EBITDA, implies a downside of 55% to the current market price. This means the market may be too optimistic.
Valuation on the latest reported figures
| Metric | Value |
|---|---|
| Market cap | 136 bn ₽ |
| P/E (LTM) | 11.9 |
| EV/EBITDA (LTM) | 5.4 |
| P/B | 0.34 |
| Net debt / EBITDA (LTM) | 2.17 |
| Operating cash flow (LTM) | 24.3 bn |
| ROE | -0.2% |
| EV/EBITDA, 3-year average | 7.6 |
Dividend per share, ₽, and yield at the ex-date
| Year paid | Dividend | Yield |
|---|---|---|
| 2018 | 11.17 | 11.0% |
| 2019 | 7.95 | 10.9% |
| 2020 | 2.63 | 4.0% |
| 2021 | 18.33 | 13.0% |
| 2023 | 3.77 | 4.7% |
| 2024 | 4.51 | 8.2% |
Bottom line
The main disappointment of the quarter is the 68.7% collapse in EBITDA and near-zero operating profit. Revenue fell 33.2%, decelerating from the first quarter. The company is balancing on the edge of a loss, debt is rising, and no dividends are being paid. The only positive is that EV/EBITDA is below its historical average, but this is a consequence of falling profit, not undervaluation. At the current price, the stock looks unattractive.
Open the company's financial profile ALRS →
See also: market overview · valuation map · stock screeners