Astra: revenue accelerated to +47%, but operating cash flow turned negative again
On August 25, Astra Group published its condensed interim consolidated financial statements for H1 2026. In Q2, revenue grew 47.0% YoY to RUB 5,122.7 million, EBITDA rose 139.8% to RUB 2,270.3 million, and net profit increased 288.7% to RUB 1,853.4 million. However, operating cash flow for the quarter was negative at RUB -205.0 million, raising questions about earnings quality. At the current price, the share looks rather attractive: multiples are significantly below their own historical averages, but cash flow sustainability remains a key risk.
Key takeaways
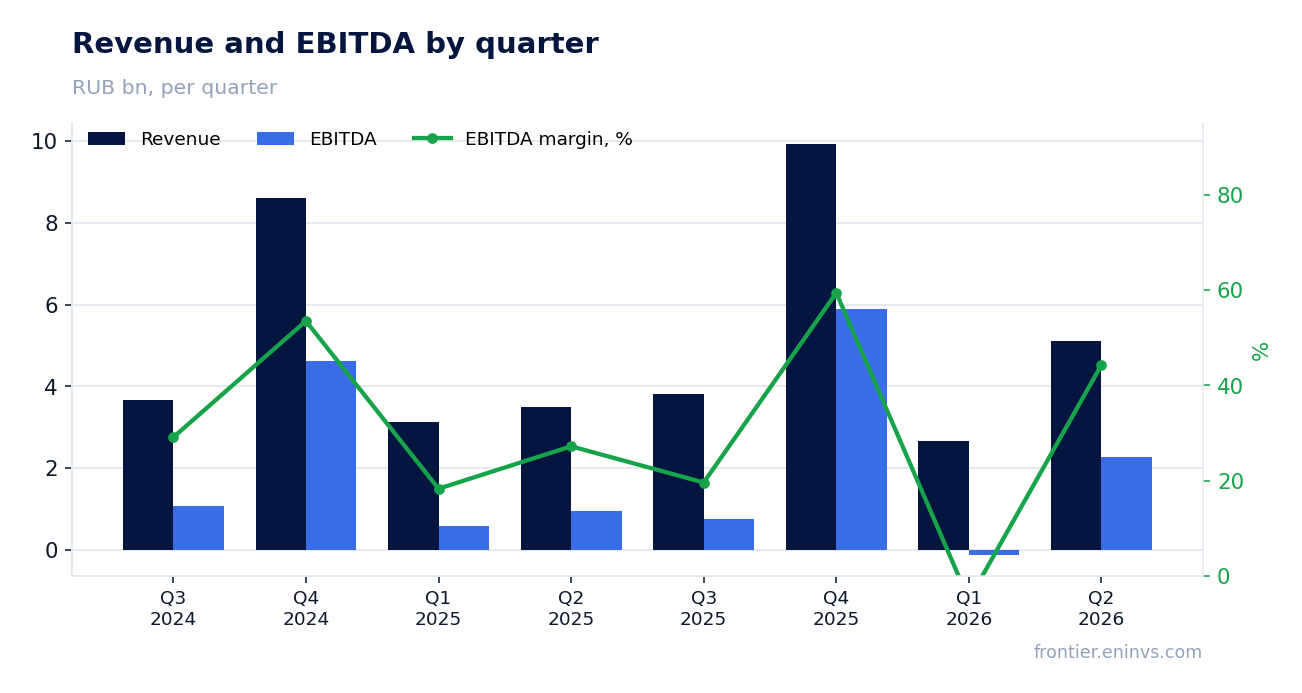
— Q2 revenue grew 47.0% – the fastest pace in the last five quarters
— EBITDA margin reached 44.3% versus 27.2% a year earlier – helped by slower growth in commercial and administrative expenses
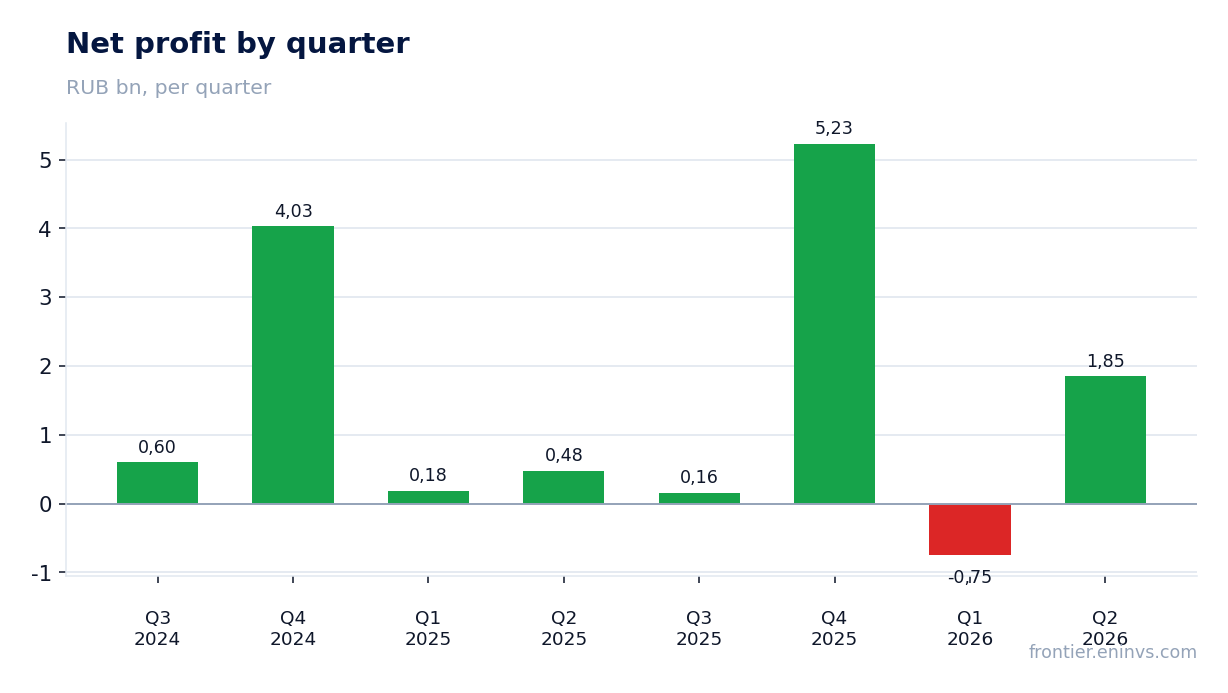
— Net profit rose 288.7% – driven by higher operating profit and a positive deferred tax effect
— Q2 operating cash flow turned negative at RUB -205.0 million – profit again not fully converting into cash
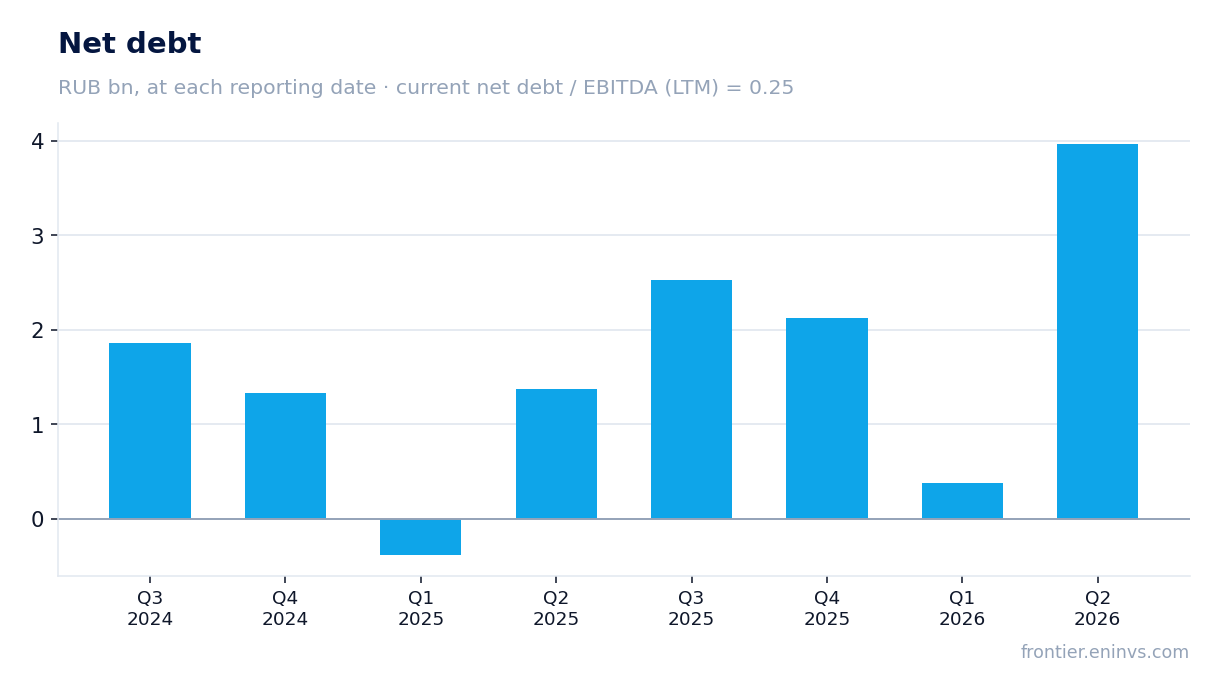
— Leverage remains low: net debt at end-June was RUB 3,968.4 million, or 0.25 of LTM EBITDA
— Capex for H1 rose to RUB 2,077.8 million – the company continues to invest in development and infrastructure
— Trailing dividend yield is 2.1%, well below our fair yield of 7.0%
Attractiveness
Key figures, RUB bn
| Metric | Q2 2025 | Q2 2026 | Change |
|---|---|---|---|
| Revenue | 3.49 | 5.12 | +47.0% |
| EBITDA | 0.95 | 2.27 | +139.8% |
| Operating profit | 0.46 | 1.77 | +283.8% |
| Net profit | 0.48 | 1.85 | +288.7% |
| Operating cash flow | -0.85 | -0.21 | — |
| Capex | 0.61 | 1.35 | +119.9% |
| EBITDA margin | 27.2% | 44.3% | +17.1 pp |
| Net margin | 13.7% | 36.2% | +22.5 pp |
Q2 revenue grew 47.0% – the fastest pace in the last five quarters
In Q2 2026, Astra's revenue reached RUB 5,122.7 million, up 47.0% from the same quarter a year earlier. This is a sharp acceleration after a 15.4% decline in Q1 2026 and modest 4.1% growth in Q3 2025. The company does not disclose revenue by segment in the report, but the dynamics point to recovering demand for software and services.
For H1 2026, revenue totaled RUB 7,779.4 million, up 17.4% from H1 2025. Quarterly dynamics, however, are highly uneven: Q1 was weak, Q2 was strong. This is typical for project-based businesses with large deals at quarter-end, but it makes forecasting difficult.
EBITDA margin reached 44.3% versus 27.2% a year earlier – helped by slower growth in commercial and administrative expenses
EBITDA in Q2 2026 rose 139.8% YoY to RUB 2,270.3 million, with EBITDA margin reaching 44.3% versus 27.2% in Q2 2025. Profitability improved sharply: revenue grew 47% while cost of sales rose only 6.1% (to RUB 2,135.0 million), providing strong operating leverage.
Commercial and administrative expenses grew moderately in Q2: marketing and commercial costs rose 3.2% (to RUB 622.3 million), and general and administrative costs rose 66.3% (to RUB 503.2 million). R&D expenses increased 33.1% (to RUB 87.4 million). As a result, operating profit nearly quadrupled to RUB 1,774.8 million from RUB 462.5 million a year earlier.
Net profit rose 288.7% – driven by higher operating profit and a positive deferred tax effect
Net profit in Q2 2026 reached RUB 1,853.4 million versus RUB 476.8 million a year earlier. Growth was driven primarily by operating profit, but also by a positive income tax benefit of RUB 25.0 million – a year earlier there was an expense of RUB 3.2 million. This is a one-off factor related to the revaluation of deferred tax assets and liabilities.
For H1 2026, net profit totaled RUB 1,101.2 million, up 66.7% from H1 2025. However, H1 2026 included a net loss in Q1 (RUB -752.2 million), which was more than offset in Q2. Adjusted net profit for H1 was RUB 1,179.7 million, higher than reported due to the exclusion of share-based compensation and other non-cash items.
Q2 operating cash flow turned negative at RUB -205.0 million – profit again not fully converting into cash
In Q2 2026, operating cash flow was RUB -205.0 million versus RUB -854.3 million a year earlier. The negative figure is due to working capital dynamics: the company is building up receivables and inventories, and paying taxes. For H1, operating cash flow was positive at RUB 2,319.9 million, but this is almost entirely due to Q1, when inflows were abnormally high (RUB 2,524.9 million).
Free cash flow (operating cash flow minus capex) for H1 was about RUB 242.1 million – less than 20% of net profit for the same period. The company is actively investing in development (creation of intangible assets – RUB 1,536.0 million in H1) and property, plant and equipment (RUB 756.1 million). Until profit more fully converts into cash, dividend capacity remains limited.
Leverage remains low: net debt at end-June was RUB 3,968.4 million, or 0.25 of LTM EBITDA
As of June 30, 2026, Astra's net debt stood at RUB 3,968.4 million versus RUB 382.2 million at end-Q1 2026. The quarterly increase of RUB 3.6 billion was driven by new borrowings (RUB 1,828.3 million in H1) and the issuance of digital financial assets (RUB 500.0 million). Nevertheless, the net debt to LTM EBITDA ratio is only 0.25 – a low level that poses no servicing concerns.
Over the last 12 months, net debt increased by RUB 1.4 billion, but the company still has significant headroom. Interest expenses for H1 were RUB 202.4 million, covered many times by operating profit. Leverage is not a constraint on growth or dividend payments.
Capex for H1 rose to RUB 2,077.8 million – the company continues to invest in development and infrastructure
Total capex (acquisition and creation of intangible assets, acquisition of PP&E) for H1 2026 was RUB 2,077.8 million (RUB 756.1 million for PP&E, RUB 1,321.6 million for intangible asset creation). This is 20% higher than in H1 2025 (RUB 1,765.7 million). The company continues to invest heavily in new product development and infrastructure expansion, including a new headquarters.
High capex is one reason free cash flow remains modest. Over the last 12 months, operating cash flow was RUB 5,700.0 million, but a significant portion is directed to investments. For shareholders, this means dividends are unlikely to be generous in the near term – the company prefers to reinvest in growth.
Trailing dividend yield is 2.1%, well below our fair yield of 7.0%
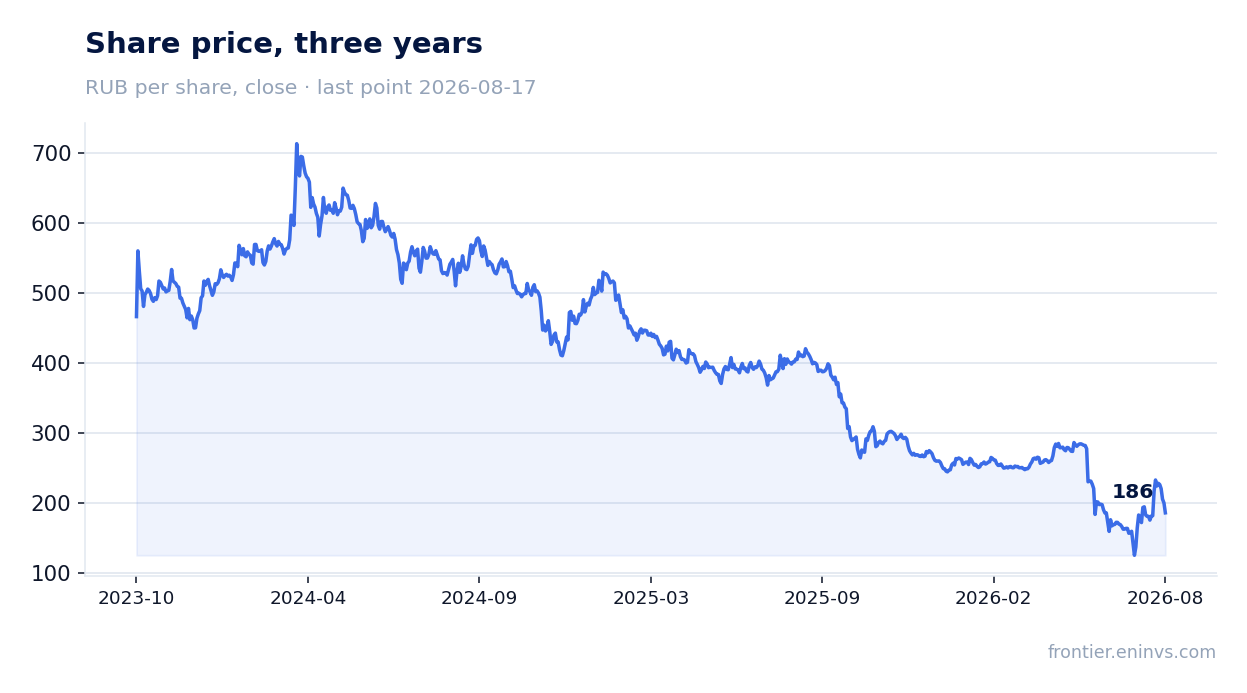
Over the last 12 months, Astra paid dividends of RUB 4.6765 per share, providing a yield of 2.1% at the current price. Our model estimates a fair yield for this stock at 7.0% – meaning the market demands a significantly higher yield, possibly due to uncertainty about cash flow and future payouts.
Our forecast dividend for the next 12 months is RUB 4.68 per share, implying a forward yield of 2.1%. The implied payout ratio in our model is 0.54 of profit. If the company maintains this payout level, the share will only be interesting through substantial price appreciation, not dividend income.
Valuation on the latest reported figures
| Metric | Value |
|---|---|
| Market cap | 46.4 bn ₽ |
| P/E (LTM) | 7.2 |
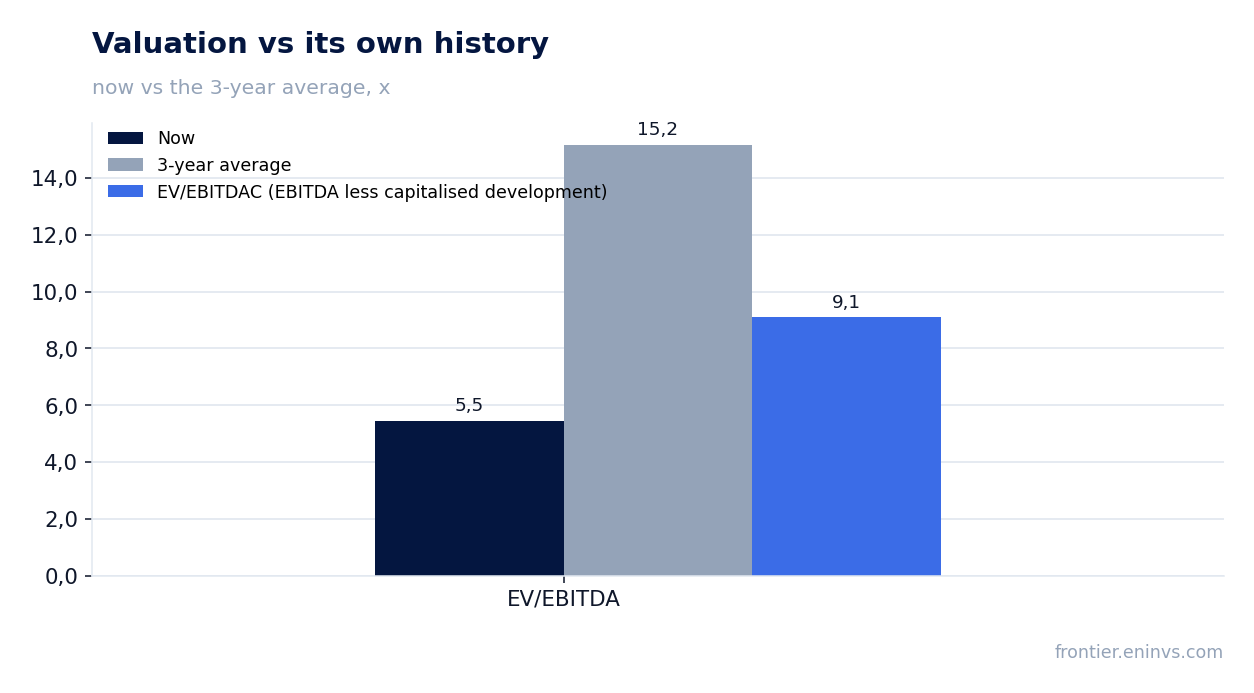
| EV/EBITDA (LTM) | 5.7 |
| EV/EBITDAC (EBITDA less capitalised development) | 9.5 |
| P/B | 3.88 |
| Net debt / EBITDA (LTM) | 0.25 |
| Operating cash flow (LTM) | 5.45 bn |
| ROE | 62.7% |
| Dividend yield (12m) | 2.1% |
| EV/EBITDA, 3-year average | 15.2 |
Bottom line
The report's strengths are clear: revenue accelerated to 47% in Q2, EBITDA margin reached 44.3%, and net profit nearly quadrupled. However, the quality of this profit raises questions: operating cash flow was negative again in Q2, and free cash flow for H1 was minimal. The company is investing heavily in development and infrastructure, which explains the gap between profit and cash, but this has not yet translated into dividend income for shareholders – the yield of 2.1% is well below our expectations. Valuation remains attractive: EV/EBITDA LTM is 5.7 versus a three-year average of 15.2, and P/E LTM is 7.2. Our model upside is only +5%, limiting growth potential. Verdict: rather attractive – the stock is cheap relative to its own history, but sustained positive operating cash flow is needed to confirm the trend.
Open the company's financial profile ASTR →
See also: market overview · valuation map · stock screeners