Basis: profit grows slower than revenue while capitalised development eats the cash flow
On 4 August, Basis reported its results for the second quarter of 2026. Revenue rose 25.7% year on year to RUB 1,451.4 mn, EBITDA by 19.8% to RUB 684.0 mn, and net profit by 6.2% to RUB 337.5 mn. Growth decelerated from the first quarter, when revenue was adding 35.8%, and margins are compressing: the EBITDA margin fell to 47.1% from 49.4%, the net margin to 23.3% from 27.5%. Yet the stock trades at EV/EBITDAC LTM of 7.6 with a dividend yield of 6.9%, and the portal's model implies 24% upside to fair value – a combination sufficient for a cautiously positive view, but not for an unqualified buy.
Key takeaways
— Revenue grew 25.7%, but that is a deceleration from 35.8% a quarter earlier
— Profit lagged revenue: the net margin fell to 23.3% from 27.5%
— Capitalised development of RUB 469.8 mn consumed the operating cash flow
— Leverage is negative: net debt of RUB -0.4 bn at -0.1x LTM EBITDA
— The dividend of RUB 7.2 per share over the last 12 months yields 6.9%
— Valuation at EV/EBITDAC of 7.6 and the portal's model leaves upside
Attractiveness
Key figures, RUB bn
| Metric | Q2 2025 | Q2 2026 | Change |
|---|---|---|---|
| Revenue | 1.15 | 1.45 | +25.7% |
| EBITDA | 0.57 | 0.68 | +19.8% |
| Operating profit | 0.28 | 0.32 | +16.9% |
| Net profit | 0.32 | 0.34 | +6.2% |
| Operating cash flow | -0.01 | 0.29 | to profit |
| Capex | 0.32 | 0.47 | +48.7% |
| EBITDA margin | 49.4% | 47.1% | -2.3 pp |
| Net margin | 27.5% | 23.3% | -4.2 pp |
Revenue grew 25.7%, but that is a deceleration from 35.8% a quarter earlier
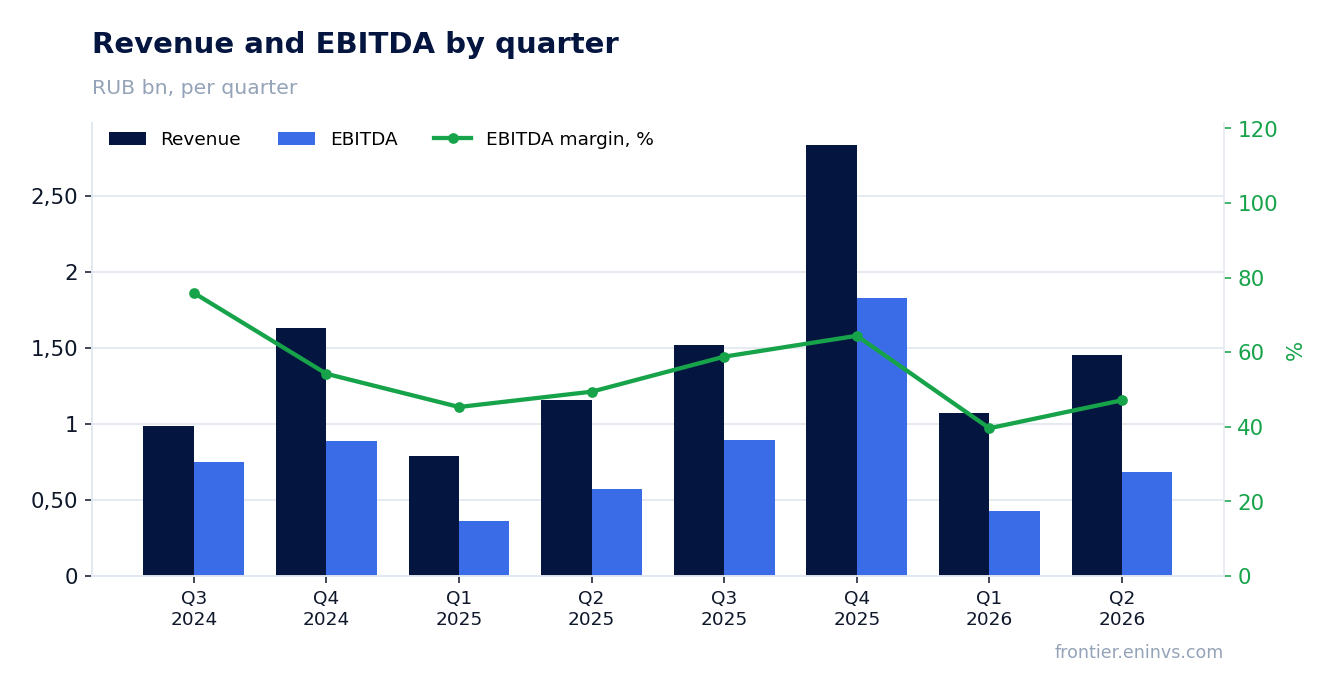
In the second quarter of 2026, Basis's revenue amounted to RUB 1,451.4 mn, up 25.7% year on year. This is a notable deceleration: growth was 35.8% in the first quarter and 73.8% in the fourth quarter of 2025. The slowdown comes against a high base from last year, when second-quarter 2025 revenue jumped 89.8%.
Licences and subscriptions are the main revenue contributor – RUB 1,271.4 mn for the quarter, or 87.6% of the total. Technical support brought in RUB 174.9 mn, other services RUB 5.0 mn. Flagship products (Basis Dynamix, Basis Workplace) generated RUB 1,044.8 mn, complementary products RUB 403.4 mn.
The company notes business seasonality: most orders close in the second half of the year, so quarterly results should not be extrapolated to the full year. Nevertheless, the current growth rate remains high for the enterprise software market, though it lags last year's dynamics.
Profit lagged revenue: the net margin fell to 23.3% from 27.5%
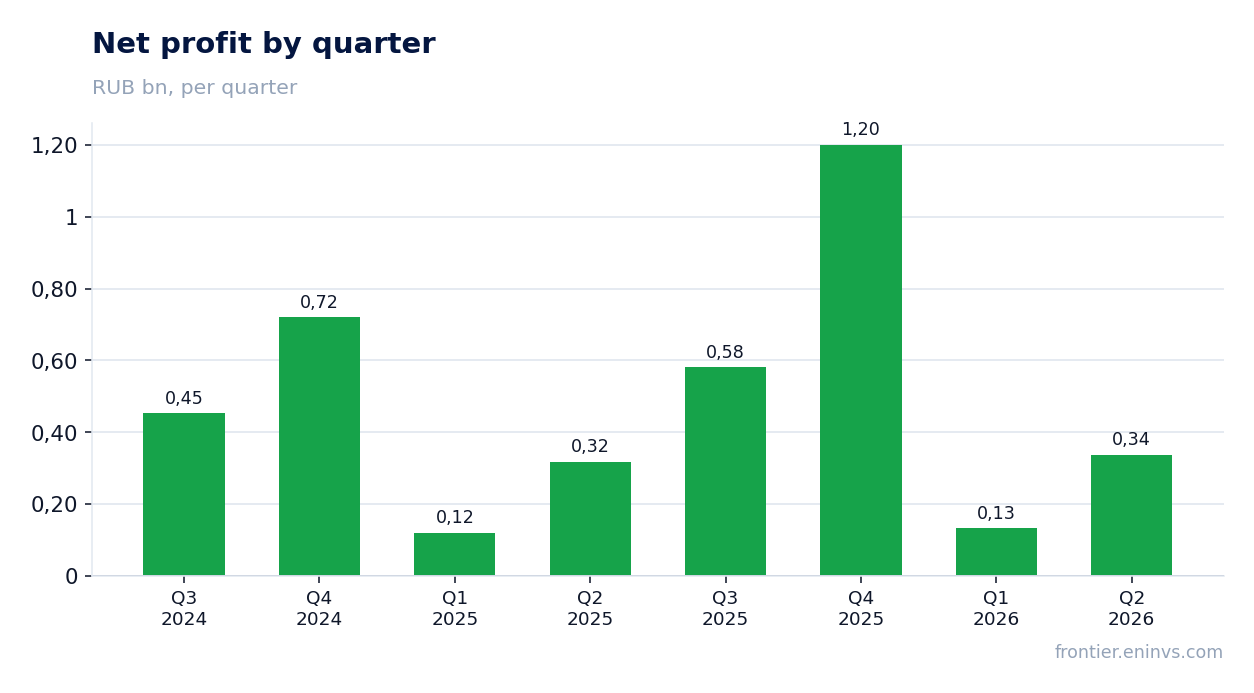
Net profit in the second quarter of 2026 grew only 6.2% year on year, to RUB 337.5 mn, while revenue added 25.7%. As a result, the net margin fell to 23.3% from 27.5% a year earlier. EBITDA rose 19.8% to RUB 684.0 mn, but its margin also compressed – to 47.1% from 49.4%.
Several factors weighed on profit. Marketing and commercial expenses rose to RUB 206.7 mn from RUB 120.3 mn a year earlier, general and administrative costs to RUB 130.7 mn from RUB 110.7 mn. In addition, long-term incentive programme expenses of RUB 32.7 mn appeared, absent a year earlier, and expected credit loss expenses of RUB 19.4 mn versus a negligible gain a year earlier.
Operating profit rose 16.9% to RUB 323.5 mn, but its growth also lags revenue. Gross profit increased 40.4% to RUB 713.0 mn, yet commercial and administrative costs consumed part of that improvement.
Capitalised development of RUB 469.8 mn consumed the operating cash flow
Operating cash flow in the second quarter of 2026 was RUB 289.2 mn, significantly below net profit of RUB 337.5 mn. The gap is primarily explained by capitalised development costs: RUB 341.4 mn of intangible assets were capitalised during the quarter, and total capital expenditures (capex) reached RUB 469.8 mn.
Free cash flow therefore remains under pressure: with operating cash flow of RUB 289.2 mn and capex of RUB 469.8 mn, the company spends more than it earns. For the first half of 2026, operating cash flow was negative – minus RUB 172.7 mn – and FCF was minus RUB 1,151.4 mn. This reflects an aggressive investment phase: the company is investing in new product development and test infrastructure.
Growth in capitalised development is not a cash loss but a deferral of costs to future periods. However, it means current profit is partly supported by capitalised costs that will be amortised and weigh on future results. The EV/EBITDAC multiple, which accounts for capitalisation, stands at 7.6 – a more conservative valuation than EV/EBITDA of 4.4.
Leverage is negative: net debt of RUB -0.4 bn at -0.1x LTM EBITDA
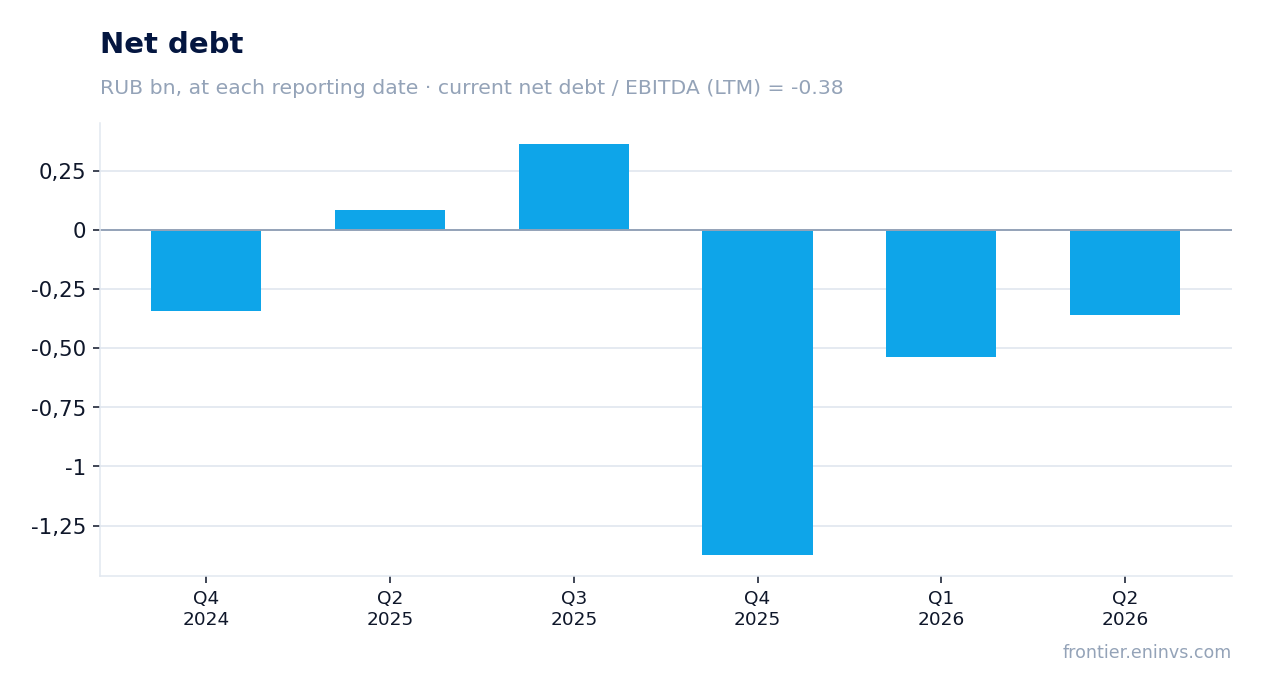
As of 30 June 2026, Basis's net debt was RUB -0.4 bn, meaning the company has a net cash position. A year earlier, on 30 June 2025, net debt was RUB 0.1 bn, so over 12 months it decreased by RUB 0.4 bn. Compared with 31 March 2026, net debt changed from RUB -0.5 bn to RUB -0.4 bn (an increase of RUB 0.2 bn).
The net debt to EBITDA ratio for the last 12 months is -0.1. This is a very low level, reflecting no debt burden. The company has no loans, only lease liabilities of RUB 150.2 mn, which are fully covered by cash of RUB 529.3 mn.
Financial income for the quarter was RUB 21.3 mn, partly offsetting financial expenses of RUB 4.0 mn. Interest expenses relate mainly to leases. This balance sheet structure gives the company resilience but also means a significant portion of cash is not working in the core business.
The dividend of RUB 7.2 per share over the last 12 months yields 6.9%
Over the last 12 months, Basis paid dividends of RUB 7.2 per share, which at the current price gives a yield of 6.9%. This is below the central bank key rate of 14.0%. However, our fair yield estimate for this name is 7.0%, so the current yield is close to fair.
In the current calendar year, RUB 7.2 per share has already been paid, and no further payouts are planned. Our estimate for the current financial year's dividend (to be paid next year) is RUB 7.37 per share, corresponding to a 7.0% yield on the current price. This is our estimate, based on a conservative payout ratio of 0.54 of LTM profit; the board makes the final decision.
The historical yield at the ex-date in 2026 was 8.4% at a price of RUB 86.18. The current yield is lower, reflecting the share price increase. The dividend policy implies paying about half of profit, and if profit remains at the LTM level, the dividend could be around RUB 7.4 per share. The risk of a lower payout is linked to a profit decline due to rising capitalised development and amortisation.
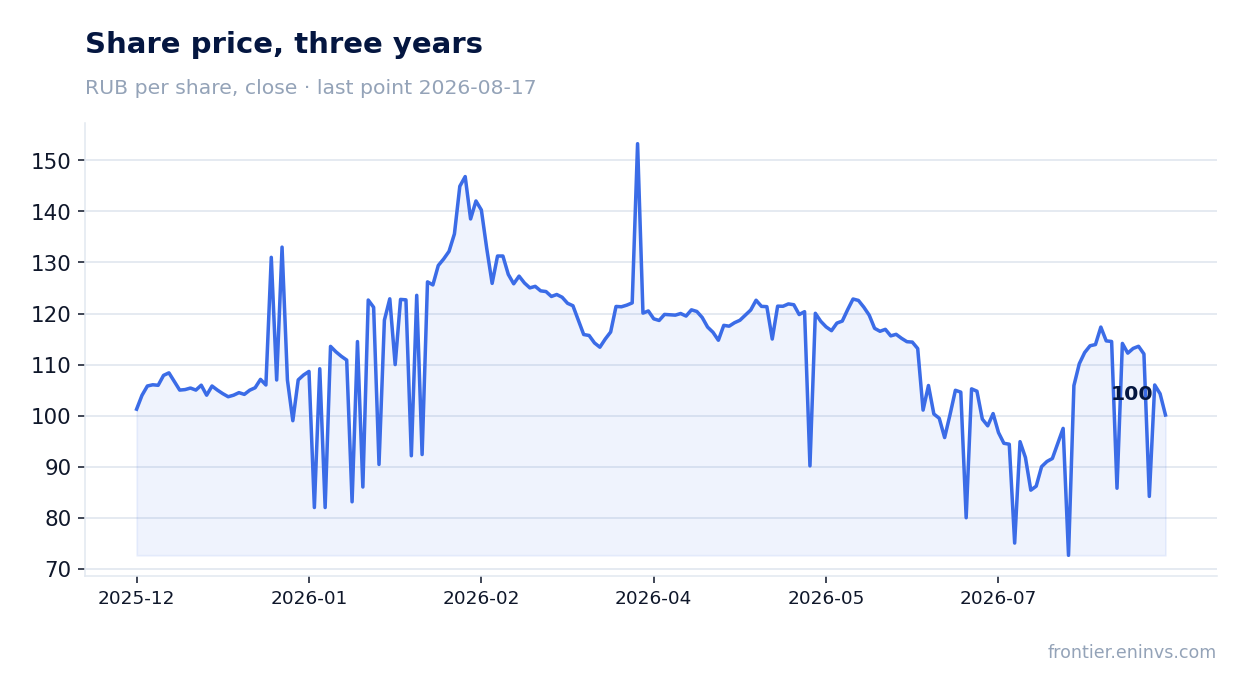
Valuation at EV/EBITDAC of 7.6 and the portal's model leaves upside
According to our data, EV/EBITDAC LTM is 7.6, above EV/EBITDA LTM of 4.4. The gap is explained by significant capitalised development, which inflates EBITDA. P/E LTM is 7.7, also indicating a low valuation. For comparison, our fair value model implies upside to fair value of +24%.
Return on equity (ROE) over the last 12 months was 22.2%, supporting the valuation. The dividend yield of 6.9% is close to our fair estimate of 7.0%. However, the stock trades at a discount to its own history? The FACTS do not contain historical multiples, so we cannot state whether the current valuation is above or below the three-year average.
The portal's model accounts for EBITDA growth and a target multiple, and its result is +24% upside to the current price. This is our own estimate, not a market consensus. The main risk is further deceleration in revenue growth and margin compression, which could lead to multiple de-rating.
Valuation on the latest reported figures
| Metric | Value |
|---|---|
| Market cap | 17.3 bn ₽ |
| P/E (LTM) | 7.7 |
| EV/EBITDA (LTM) | 4.4 |
| EV/EBITDAC (EBITDA less capitalised development) | 7.6 |
| P/B | 3.13 |
| Net debt / EBITDA (LTM) | -0.10 |
| Operating cash flow (LTM) | 2.23 bn |
| ROE | 22.2% |
| Dividend yield (12m) | 6.9% |
Bottom line
Bottom line: Basis delivered 25.7% revenue growth and 6.2% net profit growth in the second quarter of 2026, but momentum is decelerating and margins are compressing. Strengths include negative net debt, high return on equity, and a dividend yield of 6.9% close to fair. Weaknesses are profit lagging revenue, negative free cash flow due to capitalised development, and uncertainty over future dividends. Valuation at EV/EBITDAC of 7.6 and the portal's model (+24%) looks attractive but requires confirmation of sustainable growth. Verdict: 'rather attractive' – the stock is interesting for dividend-oriented holders, but not for aggressive growth.
Open the company's financial profile BAZA →
See also: market overview · valuation map · stock screeners