Basis: profit up 43%, but almost all of it went into capitalised development
Contents
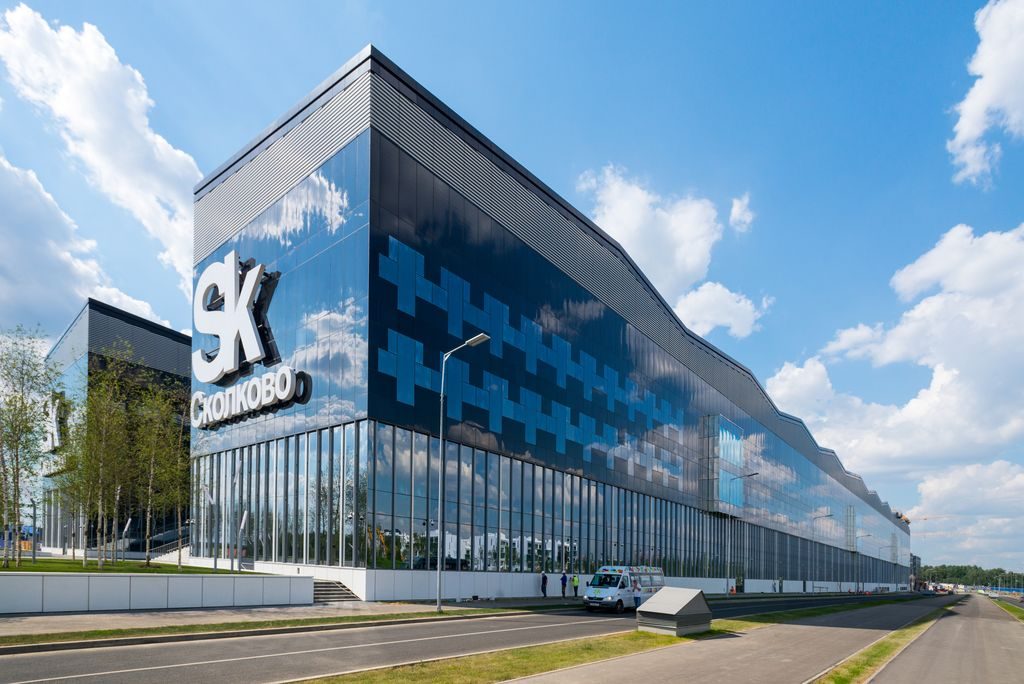
On 10 November Basis reported third-quarter 2026 results. Revenue for the quarter was RUB 1,936.5 mn (+27.3% year on year), EBITDA – RUB 1,248.2 mn (+39.4%), net profit – RUB 833.0 mn (+43.4%). Growth accelerated from the second quarter (+25.7%), the EBITDA margin rose to 64.5% from 58.9%, and net debt at end-September stood at RUB 38.6 mn – 0.01x trailing-twelve-month EBITDA. Our conclusion: rather attractive – the portal model puts upside to fair value at +34%, although free cash flow after capex remains negative. Our view: the share is rather attractive at the current price; upside on the portal model +34%.
Our view: is there upside
Our view in numbers
| Metric | Our read |
|---|---|
| Verdict | Rather attractive |
| Upside on the portal model | +34% |
| How the model works | fundamental value-creation model: EBITDA growth times the target multiple, against market cap |
| Dividend yield, 12m | 4.8% |
| Net debt / EBITDA | 0.01 – low leverage |
| Strongest case for | Revenue accelerated to +27.3%, EBITDA margin reached 64.5%, and net debt was almost eliminated, providing a margin of safety. |
| Strongest case against | Free cash flow is negative (–RUB 380.1 mn over nine months), and the 4.8% dividend yield is half the fair level. |
| What would change the view | If free cash flow turns sustainably positive, the verdict could be upgraded to 'attractive'. |
Key takeaways
— Revenue accelerated to +27.3%, with almost all growth coming from flagship products
— EBITDA margin rose to 64.5% on lower third-party software costs
— Net profit grew 43.4%, but was supported by a one-off gain on acquisition
— Free cash flow remains negative because of capitalised development
— Net debt was almost eliminated, and the company paid RUB 1,188 mn in dividends
— Dividend yield of 4.8% is half the fair level for this stock
— EV/EBITDAC of 9.4x leaves room, but needs confirmation from cash flow
Key figures, RUB bn
| Metric | Q3 2025 | Q3 2026 | Change |
|---|---|---|---|
| Revenue | 1.52 | 1.94 | +27.3% |
| EBITDA | 0.90 | 1.25 | +39.4% |
| Operating profit | 0.59 | 0.89 | +49.8% |
| Net profit | 0.58 | 0.83 | +43.4% |
| Operating cash flow | 0.23 | 1.12 | +384.0% |
| Capex | 0.41 | 0.35 | -14.3% |
| EBITDA margin | 58.9% | 64.5% | +5.6 pp |
| Net margin | 38.2% | 43.0% | +4.8 pp |
Revenue accelerated to +27.3%, with almost all growth coming from flagship products
Third-quarter 2026 revenue was RUB 1,936.5 mn, up 27.3% year on year. That is an acceleration from the second quarter, when growth was 25.7%. For the nine months, revenue reached RUB 4,460.7 mn against RUB 3,465.0 mn a year earlier.
Almost all of the increase came from flagship products: their quarterly revenue was RUB 1,638.1 mn against RUB 976.6 mn a year earlier, a rise of more than 1.6x. Complementary products, by contrast, fell to RUB 292.4 mn from RUB 541.0 mn – nearly halving. This dynamic points to demand concentrating on the core product, the Basis Dynamix virtualisation platform.
In the revenue mix, licences and subscriptions account for RUB 1,759.4 mn in the quarter, technical support for RUB 165.0 mn. The subscription model and support provide recurring income, but most revenue is still recognised at the moment a licence is transferred, which makes quarterly results sensitive to the timing of large deal closures.
Revenue and EBITDA by quarter
| Period | Measure | bn RUB |
|---|---|---|
| Q4 2024 | Revenue | 1.633135 |
| Q1 2025 | Revenue | 0.789813 |
| Q2 2025 | Revenue | 1.154232 |
| Q3 2025 | Revenue | 1.520909 |
| Q4 2025 | Revenue | 2.83775 |
| Q1 2026 | Revenue | 1.072758 |
| Q2 2026 | Revenue | 1.451377 |
| Q3 2026 | Revenue | 1.936518 |
| Q4 2024 | EBITDA | 0.884689 |
| Q1 2025 | EBITDA | 0.357907 |
| Q2 2025 | EBITDA | 0.570754 |
| Q3 2025 | EBITDA | 0.89523 |
| Q4 2025 | EBITDA | 1.826587 |
| Q1 2026 | EBITDA | 0.42489499999999997 |
| Q2 2026 | EBITDA | 0.683999 |
| Q3 2026 | EBITDA | 1.2482170000000001 |
EBITDA margin
| Period | Measure | % |
|---|---|---|
| Q4 2024 | EBITDA margin | 54.2 |
| Q1 2025 | EBITDA margin | 45.3 |
| Q2 2025 | EBITDA margin | 49.4 |
| Q3 2025 | EBITDA margin | 58.9 |
| Q4 2025 | EBITDA margin | 64.4 |
| Q1 2026 | EBITDA margin | 39.6 |
| Q2 2026 | EBITDA margin | 47.1 |
| Q3 2026 | EBITDA margin | 64.5 |
EBITDA margin rose to 64.5% on lower third-party software costs
Third-quarter EBITDA was RUB 1,248.2 mn, up 39.4% year on year. The EBITDA margin rose to 64.5% from 58.9% a year earlier. Operating profit increased to RUB 887.9 mn from RUB 592.8 mn.
The main contribution to margin growth came from lower third-party software costs: within cost of sales they fell to RUB 75.7 mn from RUB 128.1 mn a year earlier. Third-party services also dropped to zero from RUB 22.3 mn. At the same time, depreciation and amortisation rose to RUB 344.2 mn from RUB 290.8 mn, and payroll to RUB 193.7 mn from RUB 158.8 mn.
The margin improvement looks sustainable because it stems from lower purchases of third-party software rather than one-off items. Further improvement is limited, however: depreciation and payroll are growing faster than revenue, which will restrain the margin in coming quarters.
Net profit by quarter
| Period | Measure | bn RUB |
|---|---|---|
| Q4 2024 | Net profit | 0.7203930000000001 |
| Q1 2025 | Net profit | 0.119634 |
| Q2 2025 | Net profit | 0.31769600000000003 |
| Q3 2025 | Net profit | 0.580922 |
| Q4 2025 | Net profit | 1.200567 |
| Q1 2026 | Net profit | 0.132032 |
| Q2 2026 | Net profit | 0.33745800000000004 |
| Q3 2026 | Net profit | 0.8330489999999999 |
Net profit grew 43.4%, but was supported by a one-off gain on acquisition
Third-quarter net profit was RUB 833.0 mn against RUB 580.9 mn a year earlier, up 43.4%. The net margin rose to 43.0% from 38.2%. However, profit includes a one-off gain on the acquisition of a subsidiary of RUB 2.9 mn – small relative to quarterly profit, but it inflates the growth rate.
Expected credit loss charges rose substantially, to RUB 79.7 mn from RUB 7.7 mn a year earlier. This may reflect deteriorating receivables quality or a conservative approach to provisions. Long-term incentive programme expenses also increased, to RUB 33.0 mn from RUB 40.6 mn, related to share-based remuneration.
Financial income fell to RUB 10.4 mn from RUB 34.8 mn, explained by the lower cash balance after dividend payments. Overall, net profit grew mainly through operating leverage rather than one-off items, but the rise in credit loss provisions warrants attention.
Net debt
at each reporting date, current net debt / EBITDA (LTM) = 0.01
| Period | Measure | bn RUB |
|---|---|---|
| Q4 2024 | Net debt | −0.341077 |
| Q2 2025 | Net debt | 0.084293 |
| Q3 2025 | Net debt | 0.36386500000000005 |
| Q4 2025 | Net debt | −1.375538 |
| Q1 2026 | Net debt | −0.539436 |
| Q2 2026 | Net debt | −0.35836999999999997 |
| Q3 2026 | Net debt | 0.038629000000000004 |
Free cash flow remains negative because of capitalised development
Third-quarter operating cash flow was RUB 1,124.1 mn, well above net profit. However, capital expenditures reached RUB 352.8 mn, and capitalisation of intangible assets over nine months was RUB 996.9 mn. As a result, free cash flow for the nine months was negative – minus RUB 380.1 mn against plus RUB 130.8 mn a year earlier.
The company capitalises a significant portion of development costs, which inflates EBITDA and net profit relative to cash flow. EBITDAC for the last twelve months is RUB 2,643.7 mn against EBITDA of RUB 3,935.4 mn – a difference of almost RUB 1.3 bn. This means the real ability to generate cash is lower than EBITDA suggests.
Negative free cash flow alongside growing profit is a key risk for dividends. The company paid RUB 1,188 mn in dividends over nine months, exceeding free cash flow. Payments are funded from the accumulated cash position, which fell to RUB 107.6 mn at end-September from RUB 1,626.8 mn at the start of the year.
Net debt was almost eliminated, and the company paid RUB 1,188 mn in dividends
Net debt at 30 September 2026 was RUB 38.6 mn, or 0.01x trailing-twelve-month EBITDA. A year earlier, at 30 September 2025, net debt was RUB 0.4 bn, and at 30 June 2026 it was minus RUB 0.4 bn (a net cash position). Thus, over the year debt fell by RUB 0.3 bn, while over the quarter it rose by RUB 0.4 bn because of dividend payments.
The company paid RUB 1,188 mn in dividends over the nine months of 2026, which led to a cash outflow. Despite this, leverage remains minimal. The net debt to EBITDA ratio is 0.01 – a level that poses no risk to financial stability.
Low leverage gives the company freedom for investment and shareholder payouts. However, negative free cash flow means further payments may require new borrowing or a reduction in capitalised development.
Share price, three years
close, last point 2026-11-10
| Period | Measure | RUB per share |
|---|---|---|
| 2025-12-10 | Closing price | 101.26 |
| 2025-12-11 | Closing price | 103.98 |
| 2025-12-12 | Closing price | 105.8 |
| 2025-12-15 | Closing price | 106.04 |
| 2025-12-16 | Closing price | 105.94 |
| 2025-12-17 | Closing price | 107.88 |
| 2025-12-18 | Closing price | 108.38 |
| 2025-12-19 | Closing price | 106.7 |
| 2025-12-22 | Closing price | 105.0 |
| 2025-12-23 | Closing price | 105.1 |
| 2025-12-24 | Closing price | 105.4 |
| 2025-12-25 | Closing price | 105.0 |
| 2025-12-26 | Closing price | 105.96 |
| 2025-12-29 | Closing price | 104.0 |
| 2025-12-30 | Closing price | 105.8 |
| 2026-01-05 | Closing price | 105.0 |
| 2026-01-06 | Closing price | 104.3 |
| 2026-01-08 | Closing price | 103.7 |
| 2026-01-09 | Closing price | 104.0 |
| 2026-01-12 | Closing price | 104.5 |
| 2026-01-13 | Closing price | 104.16 |
| 2026-01-14 | Closing price | 104.98 |
| 2026-01-15 | Closing price | 105.46 |
| 2026-01-16 | Closing price | 107.1 |
| 2026-01-19 | Closing price | 106.0 |
| 2026-01-20 | Closing price | 131.0 |
| 2026-01-20 | Closing price | 106.98 |
| 2026-01-21 | Closing price | 133.0 |
| 2026-01-21 | Closing price | 106.96 |
| 2026-01-22 | Closing price | 99.0 |
| 2026-01-22 | Closing price | 107.0 |
| 2026-01-23 | Closing price | 107.96 |
| 2026-01-26 | Closing price | 108.66 |
| 2026-01-27 | Closing price | 82.0 |
| 2026-01-27 | Closing price | 109.18 |
| 2026-01-28 | Closing price | 82.0 |
| 2026-01-28 | Closing price | 113.56 |
| 2026-01-29 | Closing price | 112.5 |
| 2026-01-29 | Closing price | 111.62 |
| 2026-01-30 | Closing price | 110.88 |
| 2026-02-02 | Closing price | 83.12 |
| 2026-02-02 | Closing price | 114.5 |
| 2026-02-03 | Closing price | 86.02 |
| 2026-02-03 | Closing price | 122.64 |
| 2026-02-04 | Closing price | 121.22 |
| 2026-02-05 | Closing price | 90.44 |
| 2026-02-05 | Closing price | 118.7 |
| 2026-02-06 | Closing price | 122.88 |
| 2026-02-09 | Closing price | 110.0 |
| 2026-02-09 | Closing price | 122.76 |
| 2026-02-10 | Closing price | 122.68 |
| 2026-02-11 | Closing price | 92.14 |
| 2026-02-11 | Closing price | 123.56 |
| 2026-02-12 | Closing price | 92.38 |
| 2026-02-12 | Closing price | 126.2 |
| 2026-02-13 | Closing price | 125.6 |
| 2026-02-16 | Closing price | 129.4 |
| 2026-02-17 | Closing price | 130.68 |
| 2026-02-18 | Closing price | 132.18 |
| 2026-02-19 | Closing price | 135.6 |
| 2026-02-20 | Closing price | 144.92 |
| 2026-02-24 | Closing price | 146.82 |
| 2026-02-25 | Closing price | 138.52 |
| 2026-02-26 | Closing price | 142.04 |
| 2026-02-27 | Closing price | 140.28 |
| 2026-03-02 | Closing price | 132.72 |
| 2026-03-03 | Closing price | 125.9 |
| 2026-03-04 | Closing price | 131.26 |
| 2026-03-05 | Closing price | 131.26 |
| 2026-03-06 | Closing price | 127.66 |
| 2026-03-09 | Closing price | 125.82 |
| 2026-03-10 | Closing price | 127.32 |
| 2026-03-11 | Closing price | 125.98 |
| 2026-03-12 | Closing price | 125.02 |
| 2026-03-13 | Closing price | 125.32 |
| 2026-03-16 | Closing price | 124.44 |
| 2026-03-17 | Closing price | 124.3 |
| 2026-03-18 | Closing price | 123.34 |
| 2026-03-19 | Closing price | 123.72 |
| 2026-03-20 | Closing price | 123.18 |
| 2026-03-23 | Closing price | 122.0 |
| 2026-03-24 | Closing price | 121.52 |
| 2026-03-25 | Closing price | 118.72 |
| 2026-03-26 | Closing price | 115.88 |
| 2026-03-27 | Closing price | 115.7 |
| 2026-03-30 | Closing price | 114.24 |
| 2026-03-31 | Closing price | 113.4 |
| 2026-04-01 | Closing price | 115.0 |
| 2026-04-02 | Closing price | 116.38 |
| 2026-04-03 | Closing price | 121.38 |
| 2026-04-06 | Closing price | 121.32 |
| 2026-04-07 | Closing price | 121.64 |
| 2026-04-08 | Closing price | 122.08 |
| 2026-04-09 | Closing price | 153.26 |
| 2026-04-09 | Closing price | 120.08 |
| 2026-04-10 | Closing price | 120.5 |
| 2026-04-13 | Closing price | 118.96 |
| 2026-04-14 | Closing price | 118.64 |
| 2026-04-15 | Closing price | 119.82 |
| 2026-04-16 | Closing price | 119.76 |
| 2026-04-17 | Closing price | 119.68 |
| 2026-04-20 | Closing price | 120.0 |
| 2026-04-21 | Closing price | 119.5 |
| 2026-04-22 | Closing price | 120.72 |
| 2026-04-23 | Closing price | 120.4 |
| 2026-04-24 | Closing price | 119.22 |
| 2026-04-27 | Closing price | 117.34 |
| 2026-04-28 | Closing price | 116.32 |
| 2026-04-29 | Closing price | 114.76 |
| 2026-04-30 | Closing price | 117.68 |
| 2026-05-04 | Closing price | 117.52 |
| 2026-05-05 | Closing price | 118.2 |
| 2026-05-06 | Closing price | 118.68 |
| 2026-05-07 | Closing price | 119.68 |
| 2026-05-08 | Closing price | 120.68 |
| 2026-05-11 | Closing price | 122.6 |
| 2026-05-12 | Closing price | 121.4 |
| 2026-05-13 | Closing price | 121.34 |
| 2026-05-14 | Closing price | 115.0 |
| 2026-05-14 | Closing price | 121.44 |
| 2026-05-15 | Closing price | 121.42 |
| 2026-05-18 | Closing price | 121.88 |
| 2026-05-19 | Closing price | 121.72 |
| 2026-05-20 | Closing price | 119.8 |
| 2026-05-21 | Closing price | 120.36 |
| 2026-05-22 | Closing price | 90.16 |
| 2026-05-22 | Closing price | 120.04 |
| 2026-05-25 | Closing price | 118.48 |
| 2026-05-26 | Closing price | 117.38 |
| 2026-05-27 | Closing price | 116.64 |
| 2026-05-28 | Closing price | 118.12 |
| 2026-05-29 | Closing price | 118.52 |
| 2026-06-01 | Closing price | 120.76 |
| 2026-06-02 | Closing price | 122.84 |
| 2026-06-03 | Closing price | 122.56 |
| 2026-06-04 | Closing price | 121.24 |
| 2026-06-05 | Closing price | 119.68 |
| 2026-06-08 | Closing price | 117.1 |
| 2026-06-09 | Closing price | 116.52 |
| 2026-06-10 | Closing price | 116.9 |
| 2026-06-11 | Closing price | 115.62 |
| 2026-06-15 | Closing price | 115.92 |
| 2026-06-16 | Closing price | 115.14 |
| 2026-06-17 | Closing price | 114.48 |
| 2026-06-18 | Closing price | 114.4 |
| 2026-06-19 | Closing price | 113.14 |
| 2026-06-22 | Closing price | 101.08 |
| 2026-06-23 | Closing price | 105.9 |
| 2026-06-24 | Closing price | 100.32 |
| 2026-06-25 | Closing price | 99.48 |
| 2026-06-26 | Closing price | 95.7 |
| 2026-06-29 | Closing price | 100.18 |
| 2026-06-30 | Closing price | 104.96 |
| 2026-07-01 | Closing price | 104.6 |
| 2026-07-02 | Closing price | 80.0 |
| 2026-07-02 | Closing price | 105.24 |
| 2026-07-03 | Closing price | 104.78 |
| 2026-07-06 | Closing price | 99.32 |
| 2026-07-07 | Closing price | 98.0 |
| 2026-07-08 | Closing price | 100.4 |
| 2026-07-09 | Closing price | 96.68 |
| 2026-07-10 | Closing price | 94.58 |
| 2026-07-13 | Closing price | 94.4 |
| 2026-07-14 | Closing price | 75.04 |
| 2026-07-14 | Closing price | 94.9 |
| 2026-07-15 | Closing price | 91.8 |
| 2026-07-16 | Closing price | 85.4 |
| 2026-07-17 | Closing price | 86.18 |
| 2026-07-20 | Closing price | 90.0 |
| 2026-07-21 | Closing price | 91.02 |
| 2026-07-22 | Closing price | 91.6 |
| 2026-07-23 | Closing price | 94.56 |
| 2026-07-24 | Closing price | 97.5 |
| 2026-07-27 | Closing price | 72.64 |
| 2026-07-27 | Closing price | 105.88 |
| 2026-07-28 | Closing price | 110.16 |
| 2026-07-29 | Closing price | 112.36 |
| 2026-07-30 | Closing price | 113.68 |
| 2026-07-31 | Closing price | 113.92 |
| 2026-08-03 | Closing price | 117.34 |
| 2026-08-04 | Closing price | 114.64 |
| 2026-08-05 | Closing price | 114.52 |
| 2026-08-06 | Closing price | 85.78 |
| 2026-08-06 | Closing price | 114.14 |
| 2026-08-07 | Closing price | 112.24 |
| 2026-08-10 | Closing price | 113.16 |
| 2026-08-11 | Closing price | 113.58 |
| 2026-08-12 | Closing price | 112.08 |
| 2026-08-13 | Closing price | 84.18 |
| 2026-08-13 | Closing price | 106.0 |
| 2026-08-14 | Closing price | 104.28 |
| 2026-08-17 | Closing price | 100.12 |
| 2026-08-18 | Closing price | 107.48 |
| 2026-08-19 | Closing price | 108.44 |
| 2026-08-20 | Closing price | 104.88 |
| 2026-08-21 | Closing price | 78.9 |
| 2026-08-21 | Closing price | 108.54 |
| 2026-08-24 | Closing price | 79.44 |
| 2026-08-24 | Closing price | 102.92 |
| 2026-08-25 | Closing price | 103.8 |
| 2026-08-26 | Closing price | 103.24 |
| 2026-08-27 | Closing price | 104.1 |
| 2026-08-28 | Closing price | 105.62 |
| 2026-08-31 | Closing price | 106.84 |
| 2026-09-01 | Closing price | 104.04 |
| 2026-09-02 | Closing price | 104.2 |
| 2026-09-03 | Closing price | 105.82 |
| 2026-09-04 | Closing price | 104.6 |
| 2026-09-07 | Closing price | 95.0 |
| 2026-09-07 | Closing price | 106.04 |
| 2026-09-08 | Closing price | 106.36 |
| 2026-09-09 | Closing price | 106.52 |
| 2026-09-10 | Closing price | 106.92 |
| 2026-09-11 | Closing price | 107.48 |
| 2026-09-14 | Closing price | 107.18 |
| 2026-09-15 | Closing price | 110.04 |
| 2026-09-16 | Closing price | 108.52 |
| 2026-09-17 | Closing price | 108.04 |
| 2026-09-18 | Closing price | 108.1 |
| 2026-09-21 | Closing price | 105.96 |
| 2026-09-22 | Closing price | 107.52 |
| 2026-09-23 | Closing price | 107.22 |
| 2026-09-24 | Closing price | 106.34 |
| 2026-09-25 | Closing price | 105.16 |
| 2026-09-28 | Closing price | 105.56 |
| 2026-09-29 | Closing price | 105.24 |
| 2026-09-30 | Closing price | 105.16 |
| 2026-10-01 | Closing price | 104.84 |
| 2026-10-02 | Closing price | 105.16 |
| 2026-10-05 | Closing price | 108.44 |
| 2026-10-06 | Closing price | 112.48 |
| 2026-10-07 | Closing price | 116.92 |
| 2026-10-08 | Closing price | 115.02 |
| 2026-10-09 | Closing price | 118.62 |
| 2026-10-12 | Closing price | 119.02 |
| 2026-10-13 | Closing price | 124.54 |
| 2026-10-14 | Closing price | 124.3 |
| 2026-10-15 | Closing price | 124.8 |
| 2026-10-16 | Closing price | 126.14 |
| 2026-10-19 | Closing price | 129.62 |
| 2026-10-20 | Closing price | 131.52 |
| 2026-10-21 | Closing price | 131.92 |
| 2026-10-22 | Closing price | 130.7 |
| 2026-10-23 | Closing price | 134.72 |
| 2026-10-26 | Closing price | 138.2 |
| 2026-10-27 | Closing price | 137.82 |
| 2026-10-28 | Closing price | 140.62 |
| 2026-10-29 | Closing price | 147.22 |
| 2026-10-30 | Closing price | 143.5 |
| 2026-11-02 | Closing price | 142.8 |
| 2026-11-03 | Closing price | 142.76 |
| 2026-11-05 | Closing price | 144.24 |
| 2026-11-06 | Closing price | 147.4 |
| 2026-11-09 | Closing price | 146.06 |
| 2026-11-10 | Closing price | 184.0 |
| 2026-11-10 | Closing price | 148.3 |
Dividend yield of 4.8% is half the fair level for this stock
Over the last twelve months the company paid dividends of RUB 7.2 per share, giving a yield of 4.8% at the current price. For 2026 the payment was also RUB 7.2 per share, with a yield of 8.4% at the ex-date price of RUB 86.18. Our model estimates a fair yield for this stock at 12.0%, twice the actual level.
The model payout ratio is 0.51 of profit. Based on trailing-twelve-month profit of RUB 2,503.1 mn, the calculated dividend would be about RUB 7.2 per share, matching the actual payment. However, profit includes capitalised development, which is not cash flow, so dividend sustainability depends on the ability to generate free cash.
The central bank key rate is 14.0%, which makes a 4.8% dividend yield less attractive compared with risk-free instruments. To improve attractiveness, the company must either increase payouts or demonstrate sustainable positive free cash flow.
EV/EBITDAC of 9.4x leaves room, but needs confirmation from cash flow
By our calculations, trailing-twelve-month EV/EBITDAC is 9.4x, above EV/EBITDA (5.9x), because EBITDAC excludes capitalised development. Trailing P/E is 9.9x, lower than one might expect given profit growth. Return on equity (ROE) reaches 58.0%, reflecting high business efficiency.
Comparing the current multiple with its own three-year history is not possible because the facts contain no historical data. However, the portal model estimates upside to fair value at +34%. This means the market undervalues the company if it can confirm cash flow sustainability.
The main risk to the valuation is negative free cash flow. If the company continues to capitalise development and cannot generate positive cash flow, multiples may remain high and dividend payments under pressure. Confirmation of the valuation requires growth in operating cash flow and lower capitalisation.
Valuation on the latest reported figures
| Metric | Value |
|---|---|
| Market cap | 24.7 bn ₽ |
| P/E (LTM) | 9.9 |
| EV/EBITDA (LTM) | 5.9 |
| EV/EBITDAC (EBITDA less capitalised development) | 9.4 |
| P/B | 4.46 |
| Net debt / EBITDA (LTM) | 0.01 |
| Operating cash flow (LTM) | 3.12 bn |
| ROE | 58.0% |
| Dividend yield (12m) | 4.8% |
Bottom line
The report's strengths were accelerating revenue growth (+27.3%) and a record EBITDA margin (64.5%), as well as near-zero net debt. However, net profit grew 43.4% partly due to a one-off gain on acquisition, and free cash flow remains negative because of capitalised development. A dividend yield of 4.8% is half the fair level, which limits appeal for income-oriented investors. Our conclusion: rather attractive – the portal model puts upside at +34%, but the company needs to demonstrate positive free cash flow to confirm the valuation. Our view: the share is rather attractive at the current price; upside on the portal model +34%.