A 14% rate at 6% inflation: who pays for the tightness
On 11 September the Bank of Russia decides on the key rate. It now stands at 14% with inflation near 6%: money costs about 8 percentage points above the rate of price growth. Below we look at what this price of money does to the economy, where inflation does not respond to the rate, who drops out of the game first, and how central banks in other countries handle the same task.
The calculations use data from the Bank of Russia, Rosstat, the Bank for International Settlements and the reporting of public companies.
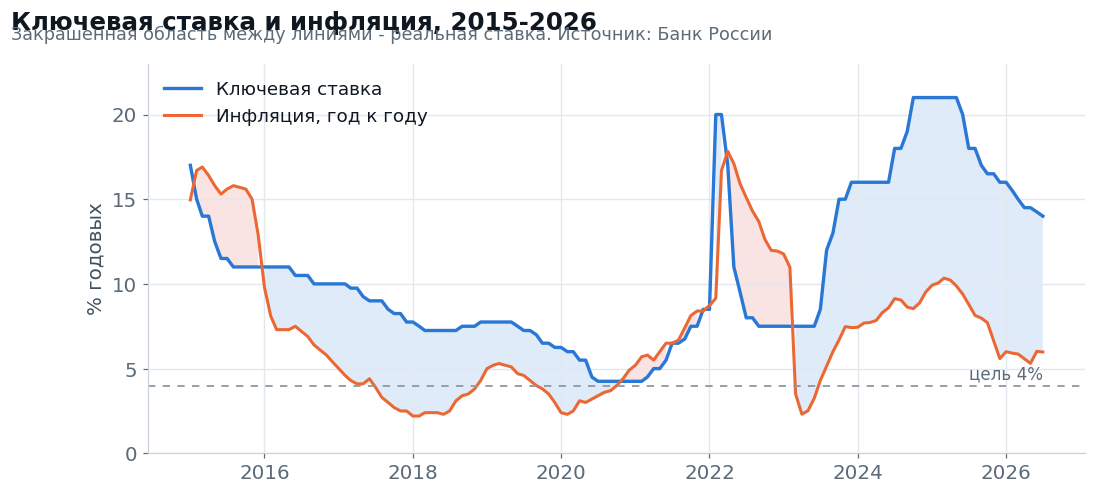
The real rate has stayed above 8 points for 25 months in a row. The average real rate in 2015-2021 was 2.0 points; in 2024-2026 it is 9.6.
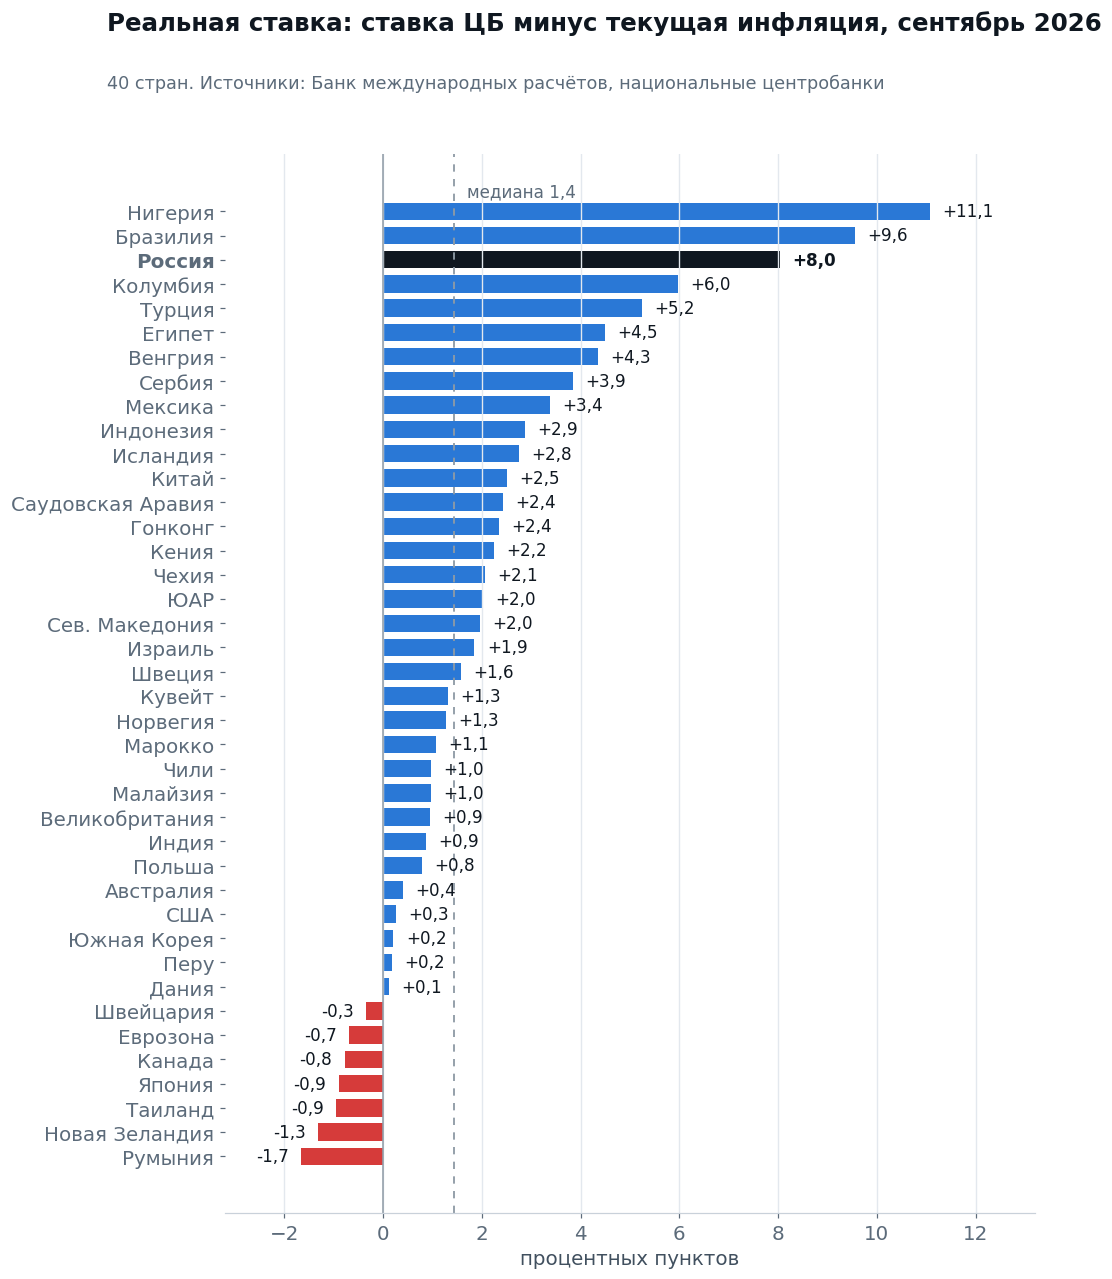
Almost nowhere else is policy this tight. Of 40 countries, only Nigeria, Brazil and Russia have a real rate above 8 points; the median of the sample is 1.4 points.
A significant part of inflation comes from tariffs and fuel. The Bank of Russia itself puts the contribution of higher fuel prices at up to 1.5 points over the year; utility tariffs are being indexed by 9.9%, grid tariffs for industry by 15-16%.
Investment has fallen for the fifth quarter in a row, down 9.9% in 1H. Private business has scaled back construction: capital expenditure of private public companies fell 12.6% in 2025, while that of state-controlled companies rose 15.5%.
Almost half of public companies do not cover interest with operating profit. In 1H2026 the share is 42% versus 33% a year earlier.
There is no unemployment only in the headline figure. At a 2.3% rate, the number of workers on idle time and short hours has grown 2.6 times, and there are 8.7 résumés per vacancy.
Household expectations, used to justify caution, overstated inflation in 88% of months. The average overshoot over the outcome a year later is 4.7 percentage points.
The real rate has stayed above 8 points for 25 months in a row – the tightest episode in the whole history of inflation targeting
A nominal rate says nothing on its own: 14% at 14% inflation is neutral, 14% at 6% inflation is prohibitive. What matters is the gap between the rate and price growth.
The average real rate in 2015-2021 was 2.0 percentage points. Since July 2024 it has not fallen below 8 points even once, and averages 9.6 over 2024-2026. Four consecutive cuts barely changed the tightness: the rate fell more slowly than inflation.
Of forty countries, only three have a real rate above 8 points
According to the central bank policy rate database and the Bank for International Settlements price statistics, supplemented with data from national central banks, the picture is as follows: above 8 points are Nigeria, Brazil and Russia. The median across 40 countries is 1.4 points, 23 countries have a real rate below 2 points, and seven have a negative one.
The company Russia finds itself in consists of countries with double-digit inflation. Nigeria has a real rate of 11.1 points at 15.4% inflation, Turkey 5.2 at 31.8%, Egypt 4.5 at 14.5%. Such tightness is maintained when prices rise at double-digit rates and the currency is not trusted. In Russia inflation is around 6%.
Large emerging economies keep their rates close to neutral. China has a real rate of 2.5 points, and that with inflation of 0.5%, that is, against a backdrop of deflation risk. India is at 0.9, Indonesia 2.9, Malaysia 1.0, South Korea 0.2.
Africa offers no analogue either. South Africa has a real rate of 2.0 points, Kenya 2.2, Morocco 1.1.
The closest case is Brazil, where the real rate is even higher, at 9.6 points. But there gross capital formation grew in the second quarter and the economy adds about 2% a year: a Brazilian company facing expensive domestic credit borrows abroad. A Russian company has no such option, so tightness that is identical by formula hits harder.
A significant part of inflation comes from tariffs and fuel – the rate cannot reach it
The regulator calculated fuel itself. The summary of the key rate discussion of 5 August states directly that the direct contribution of higher motor fuel prices to current price growth was about 0.3 points in June and another 0.2 in the first two weeks of July, and that the total contribution of direct and indirect effects over the year will not exceed 1.5 percentage points. Because of fuel, the 2026 inflation forecast was raised to 6-7%.
The exchange price of gasoline set a historical high in early September – RUB 75,477 per tonne of AI-92, and supply disruptions persisted in a number of regions. The causes are physical: refinery repairs and damage, logistics, export restrictions. The rate has no effect on them.
Regulated tariffs are growing more than twice as fast as the inflation target. The total payment for utilities is being indexed by 9.9% from 1 October, the tariff for electricity transmission through trunk grids by 16%, for industrial consumers by 15.2%, and wholesale gas prices by 9.6%. For a business this is a cost increase that is passed on into prices and does not depend on the cost of credit.
It does not follow that the rate is useless: on the demand-related part of the basket it works, and the current rate of price growth in the second quarter slowed to 5.0% annualised from 8.7% in the first. Something else does follow. Bringing the overall index down to 4% when several large components are set administratively and grow by 10-16% means demanding growth well below target from the rest of the basket. The part of the economy that is sensitive to the rate pays for this.
Inflation expectations, used to justify caution, have overstated inflation by 4.7 points over twelve years
The main argument against a quick cut in the rate is unanchored household expectations: in August they stood at 13.7% with inflation around 6%. The indicator is easy to check: the survey asks about inflation a year ahead, so each value can be compared with what happened twelve months later.
Expectations overstated future inflation in 88% of cases. Over 133 months from February 2014 to July 2025 the average overshoot is 4.7 percentage points, the median 5.1. In 2023-2025 they overstated in 100% of months.
The link with future inflation is practically absent. The correlation of expectations with inflation a year later is 0.19, with current inflation 0.76, with the inflation people observe around them 0.81. The regression explains 4% of the variance. The indicator measures memory of past prices, not a forecast.
They understated exactly when a warning would have been useful. They came in below the outcome 16 times out of 133, and all of these cases fall in 2014 and 2021, that is, on the eve of two inflation spikes.
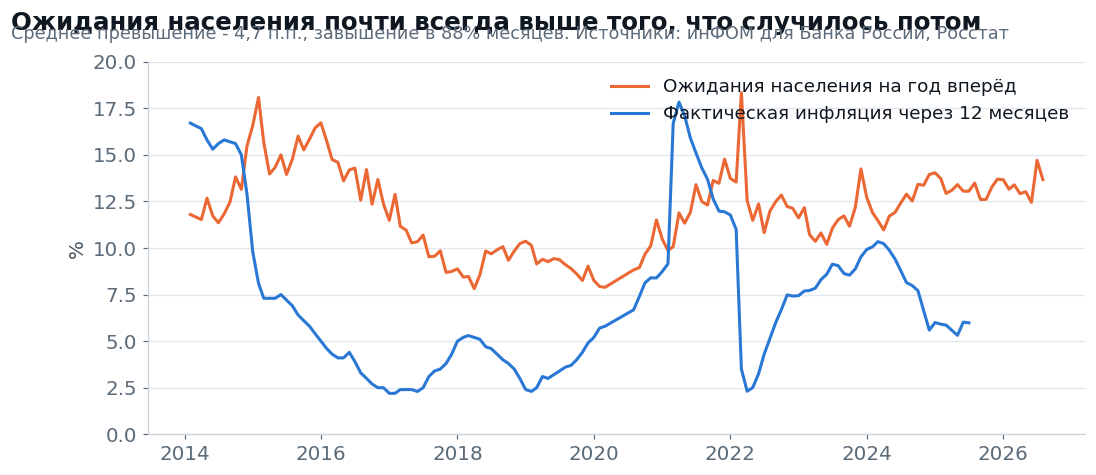
A caveat in the regulator's favour: the Bank of Russia looks not at the level but at the change in expectations, and it is aware of the persistent upward bias. Yet even after subtracting the average bias, the forecast error does not shrink. As an indicator of confidence the survey is useful; as a basis for keeping the real rate near 8 points, it is not.
Investment has fallen for the fifth quarter in a row, and this is future inflation, not today's disinflation
Fixed capital investment fell 9.9% in 1H2026: minus 14.3% in the first quarter and minus 6.6% in the second. For 2025 as a whole it was minus 2.3%. The Ministry of Economic Development expects growth to resume only from 2028, which means the investment pause is planned for three years.
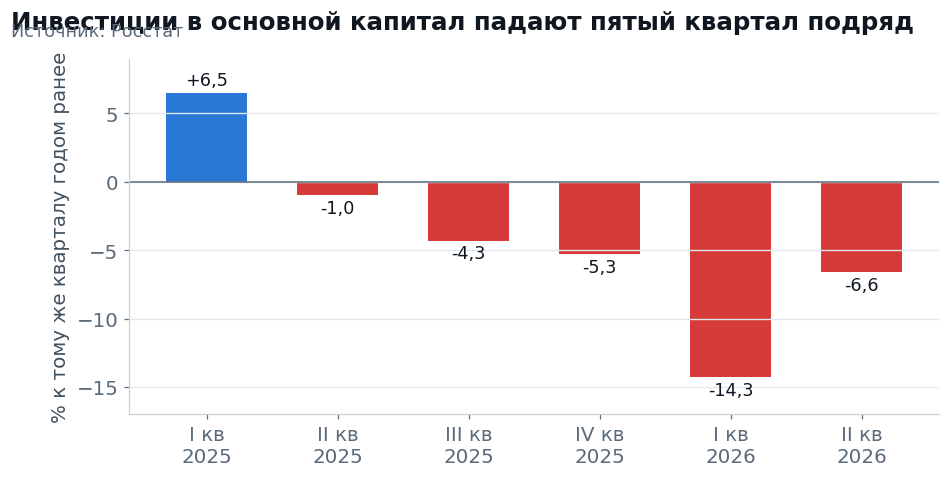
This is the main internal contradiction of current policy. The Bank of Russia lists among its pro-inflationary risks a "possible imbalance between demand and supply amid prolonged retirement of production capacity". But the retirement of capacity is the consequence of the fact that, at a cost of money of 16-18%, a project almost nowhere pays off except on commodity rents. A policy against demand inflation produces supply inflation with a lag of two to three years.
Indirect evidence adds up to the same picture. The business activity index in manufacturing fell to 48.8 points in August from 50.7 in July, capacity utilisation is declining, and loadings on the Russian Railways network over eight months are 0.6% below last year.
Private business has scaled back construction, while state-controlled companies have expanded their programmes
Two different customers do construction in Russia. For a state-controlled company the investment programme is approved together with a tariff or a directive, and expensive credit shifts the timing but does not cancel it. A private company compares the project's return with a deposit and, at a rate of 16-18%, postpones the decision.
The test is based on cash capital expenditure of 153 public companies reporting under IFRS: 18 state-controlled companies and 135 private ones, with the panel composition fixed.
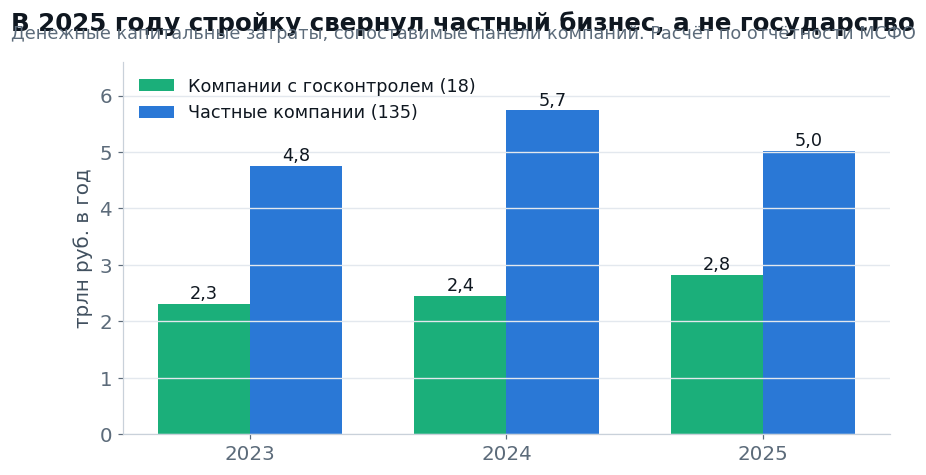
In 2025 private companies cut capital expenditure by 12.6%, while state-controlled companies raised it by 15.5%. The result is robust: excluding the largest contributor in each group gives minus 14.6% for private and plus 11.2% for state companies; the median private company cut investment by 6.9%, the median state company increased it by 4.7%. Adjusted for the rise in construction costs, private investment fell by about a fifth.
The ratio of capital expenditure to revenue diverged in the same way. For private companies it fell from 16.4% in 2024 to 13.4% in 2025, for state-controlled companies it rose from 15.6% to 18.0%. The programmes paid for by tariffs and state demand grew the most: Rosseti, Inter RAO, RusHydro, Transneft, Aeroflot.
Funding-source statistics do not show this: budget funds are direct treasury spending, while construction by Gazprom or Russian Railways is financed from their own money and falls under "own funds" on a par with a private company.
Industry grows only where the buyer is the state
Manufacturing grew a nominal 0.5% in January-July 2026. Inside this near-zero are two different economies: 14 of 24 manufacturing sub-sectors are in the red.
If sector indices are weighted by 2025 shipment volumes, the source of growth becomes visible. Four sectors where the main buyer is the state (other transport equipment, fabricated metal products, computers and electronics, pharmaceuticals) together add 2.7 percentage points. The other twenty subtract 3.1 points. The civilian part of manufacturing, about 80% of shipments, is shrinking by about 3.9%.
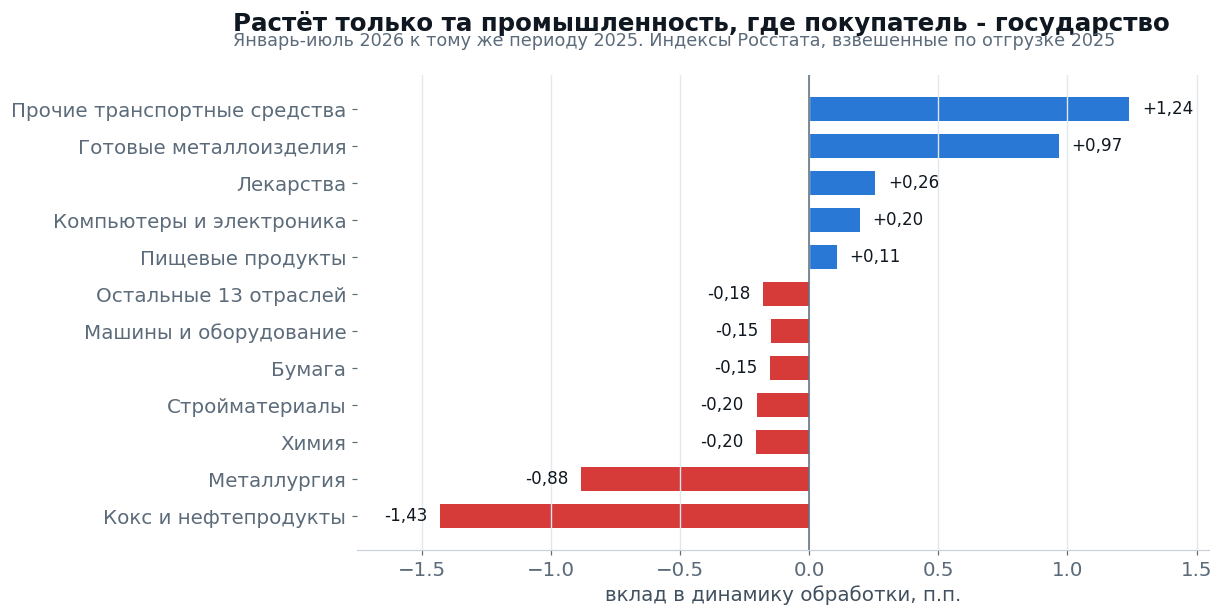
The list of those pulling down reads like a roll call of long-cycle sectors with bank debt: oil refining minus 9.2%, metallurgy minus 6.4%, building materials minus 5.6%, machinery minus 4.1%, paper minus 8.1%.
Selection works not by efficiency but by starting balance sheet
The regulator's thesis is well known: resources should move to more efficient firms, and inefficient companies should leave the market. Who actually leaves can be seen from the reporting. For 117 public non-financial companies we calculated interest coverage, the ratio of operating profit to interest expense. A value below one means that what the business earns is not enough to service its debt.
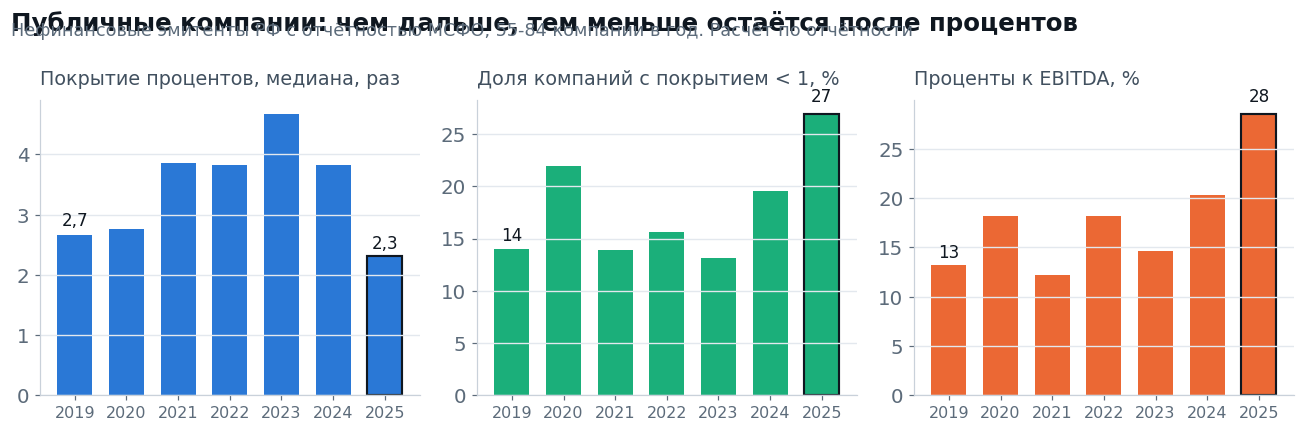
Median interest coverage fell from 4.7x in 2023 to 2.3x in 2025. The share of companies whose operating profit does not cover interest rose from 13% to 27%. Interest takes 28.5% of aggregate EBITDA versus 14.6% two years earlier; for the stable subsample it is 42.3% versus 11.5% in 2021.
1H2026 did not improve the situation, even though the rate was falling. The share not covering interest rose from 33% to 42%, and the amount of interest expense grew about 8% year on year. The reason is that about two thirds of the corporate loan book was issued at floating rates, and a 2.5-point cut in the rate does not offset the debt accumulated over two years.
The winner is not the best operator but the one sitting on cash. According to 2025 reporting, Transneft had interest income of RUB 124 bn against operating profit of RUB 250 bn, Inter RAO RUB 88 bn against 107 bn, and at MMK interest income was roughly equal to operating profit. For companies with a net cash position, interest on balances gives a median of about 29% of operating profit. At the other pole are RUSAL with coverage of 0.11, and Mechel and KAMAZ with negative operating profit.
Defaults are no longer an exception, but by the formal criterion they are not yet a wave
From 2018 to 2024 the number of issuers defaulting for the first time stayed in a range of 7-12 a year, equal to 1.3-2.7% of all bond issuers. In 2025 there were 23, and in 1H2026 another 13 versus eight a year earlier. The combined public debt of those that failed to pay in 1H is about RUB 42 bn.
Formally this is not yet a wave: ACRA defines a wave as exceeding 5% of the total number of issuers in a year, and in the ten months of 2025 the figure was 2.9%. But the direction is unambiguous, and the agency expects default rates to rise in 2026. Banking statistics confirm this: the share of problem loans to small and medium business rose from 5.9% to 7.6%, and debt of large companies with high leverage is growing faster than the portfolio (16% versus 12%), which is why the macroprudential add-on for such borrowers has been raised from 40% to 100% since March.
There is no unemployment only in the headline figure: it creeps up through idle time and short hours
The official unemployment rate in July 2026 is 2.3%, a historical low. This is the only labour market indicator that looks calm.
The hidden part is growing several-fold. The Ministry of Labour records a 2.6-fold increase in the number of workers on idle time and part-time work, to more than 254 thousand people. Formally these people are employed and do not enter the unemployment statistics.
Competition for a job has returned. The number of active résumés per vacancy in July was 8.7 versus 8.3 a month earlier, and in February it reached 11.4. The service classifies values above 7.9 as high competition among applicants, and below 4 as a labour shortage.
Some companies are going through this openly. After a loss, KAMAZ cut staff and considered moving to a four-day week, AvtoVAZ halted its assembly line for almost three weeks in spring, and the heavy truck market shrank by about half over the year.
Second-quarter GDP growth is largely calendar-driven, and series should be compared with care
There is no technical recession: after minus 0.2% in the first quarter, GDP grew 1.3% year on year in the second, and 0.6% for the half-year. But this rebound comes with three caveats.
Calendar. The second quarter of 2026 had three more working days than a year earlier, and the first had three fewer. The same factor first sank the first quarter and then lifted the second. The half-year, where the effect cancels out, gives 0.6% – that is the true speed of the economy.
Structure. All of the growth came from trade: retail turnover added 7.2% and catering 6.2%, while industry stands still in January-July and investment is falling. At the same time real disposable household incomes rose 1.5%, and retail over the half-year 5.4%. Part of the gap is closed by interest on deposits: in 2026 depositors will receive about RUB 7 trn, and this money reaches people precisely because the rate is high. A high rate cools demand through credit and at the same time warms it through deposits.
Methodology. From January 2026 Rosstat moved its industrial production indices from a 2018 base to a 2023 base, recalculating weights by the structure of value added, and recalculated wholesale and retail trade dynamics for 2025-2026. This is a planned procedure, but it means part of the acceleration is linked to the new basket and new weights. Rosstat's second-quarter estimate came out noticeably above the forecasts of the Bank of Russia (0.8-0.9%) and the Ministry of Economic Development (0.9%).
The Bank of Russia is not only cutting the rate slowly but repeatedly pushing back its future cuts
The rate is moving down in steps of 25 basis points – this is visible to everyone. Less noticeable is that the forecast path is deteriorating at the same time. In February 2026 the baseline scenario assumed an average key rate of 13.5-14.5% in 2026, in April the range was narrowed upward to 14.0-14.5%, and in July it was raised to 14.5-14.6%.
2027 moved even more sharply: in the May forecast the average rate for next year was 8.0-10.0%, in July it became 10.5-12.5%, that is, plus 2.5 points in one revision. The 2028 forecast was also raised, from 7.5-8.5% to 8.0-9.0%.
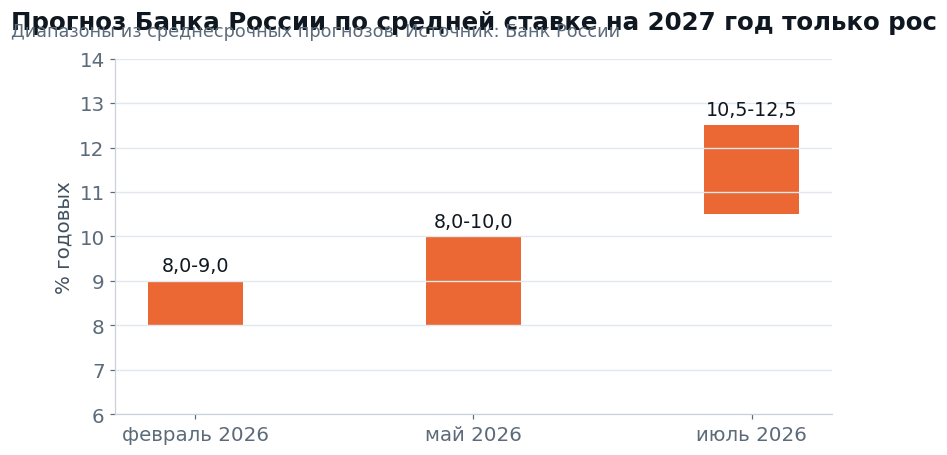
For a company planning construction this matters more than the rate decision itself. Each revision pushes the payback point further out and turns expectation into a strategy: it is better to wait another quarter than to borrow now.
The dispute between Gref and the Bank of Russia is about a fact: whether the economy is overcooled or not
This policy has for a year provoked open debate in the professional community – the argument is not about whether inflation should be targeted, but about where the line between cooling and overcooling lies. The most public part of this debate is the exchange of remarks between the head of Sberbank and the chair of the Bank of Russia.
In April and June the Bank of Russia stated that it saw no signs of overcooling. On 1 July at the financial congress Herman Gref proposed testing this in practice – cutting the rate and seeing what happens. Elvira Nabiullina replied that such tests on one's own country are dangerous and threaten stagflation, adding that there are no supporters of high rates at the central bank. On 3 September at the Eastern Economic Forum Gref returned to the subject: the economy is still overcooled, GDP growth of 0.6% for the half-year compares with potential of 1.5-2.5% by the Bank of Russia's own estimate, and the rate should be cut to 10-12%.
The facts in this dispute lean towards the "overcooling" diagnosis: growth is half of potential by the regulator's own estimate; 14 of 24 manufacturing sub-sectors are in the red; investment has fallen for the fifth quarter in a row; the business activity index is 48.8, while the Bank of Russia's business climate indicator is negative; idle time and short hours are up 2.6 times.
And four places where the rhetoric argues with itself. Expectations are named the main obstacle, although they are systematically biased and do not predict inflation. The retirement of capacity is declared a pro-inflationary risk, but it is exactly what expensive credit provokes. The thesis about inefficient firms leaving is not supported by who leaves: the first to drop out are those who borrowed to expand. The high rate is explained by subsidised state programmes and the fiscal impulse, but those who have no subsidies pay for them.
What would be worth changing if the task were solved anew
None of the points below means abandoning inflation targeting or printing money for projects. All of them lie within the logic of inflation targeting and are applied in other countries.
- A 4-6% band instead of a point target of 4%. In an economy where part of the basket is indexed administratively by 10-16%, a point target turns into a demand for deflation in the remaining prices. India has a 4% target with a 2-6% band, Brazil 3% plus or minus 1.5 points.
- An operational benchmark for an index excluding regulated prices and fuel. The overall index remains the target, but the decision is explained by the part of the basket the rate actually influences.
- Aligning tariff indexation with the inflation target. A formula of "inflation minus" instead of "inflation plus" removes from price growth a persistent contribution that monetary policy should not have to fight.
- The state of employment as an explicit part of the decision. It is not necessary to change the law and introduce a dual mandate; it is enough to publish indicators of hidden employment together with the decision.
- Separation of instruments. Overheating in consumer credit is cooled by targeted macroprudential add-ons, whereas the key rate hits all investment projects at once.
- Faster cuts with an explicit stopping rule. A 25-point step at a real rate of 8 means that tightness persists for years and business gets no planning horizon.
- Publishing the price of the policy, not only its result. An estimate of forgone investment, the number of defaults and retired capacity should appear alongside the estimate of the inflation gain.
What this piece does not claim
The Bank of Russia's position has strong arguments. Household expectations are indeed high, and with fast easing price growth could accelerate. Money supply is growing 13% a year against a forecast of 5-10%. The fiscal impulse remains stimulating: spending over eight months is 14.7% above last year. Wages are growing faster than productivity. The objection here is not to tightness as such, but to its duration and to the fact that it is achieved with a single instrument.
A high rate is not the only reason for the fall in investment: sanctions restrictions on equipment, labour shortages, tax changes and uncertainty also matter. The capital expenditure calculation covers public companies, which is not the whole economy: Russian Railways, Rosatom and small business were not in the panel. The division of sectors into "state demand" and the rest is also conditional.
What to watch after the 11 September meeting
The rate decision itself will tell little: the market expects 14% to be held with a 25 basis point step under discussion, and the next key meeting with an updated forecast is on 23 October. Three things matter more. First, the average rate forecast for 2027, currently 10.5-12.5%; any shift of the range matters more than the decision itself. Second, the wording on the retirement of capacity: if it strengthens, the regulator is acknowledging a supply problem. Third, company reporting for the third quarter: it will show whether the share of those not earning enough to pay interest keeps rising.
Prepared by the Enhanced Investments team. Extended issuer cards with financial metrics and valuation are on our portal, and weekly analysis is on the Telegram channel @eninv.
See also: market overview · valuation map · stock screeners