Cian: profit up 32% and margin jumps to 29.6% — but this year's dividend will be a fraction of last year's

On 28 September Cian reported results for the second quarter of 2026. Revenue rose 22.8% year on year to RUB 4,425.0 mn, EBITDA jumped 84.4% to RUB 1,311.0 mn, and net profit increased 31.6% to RUB 1,040.0 mn. The EBITDA margin climbed to 29.6% from 19.7% a year earlier. The stock looks attractive at the current price: growth is accelerating, the margin is expanding, and the EV/EBITDA multiple sits below its own three-year average, even though this year's dividend yield will be well below last year's.
Key takeaways
— Revenue rose 22.8% year on year, an acceleration from 21.3% in the fourth quarter of 2025
— EBITDA grew 84.4% and its margin climbed to 29.6% from 19.7% — costs barely moved
— Net profit increased 31.6% to RUB 1,040.0 mn, but part of that growth may be one-off
— Operating cash flow for the quarter was RUB 1,223.0 mn with capital expenditure of just RUB 61.0 mn
— Net debt remains negative: minus RUB 3,670.0 mn at 30 June 2026, or minus 1.02 times trailing twelve-month EBITDA
— We estimate the dividend for 2026 at RUB 40.07 per share — 6.2% on the current price versus 24.1% on payouts over the last twelve months
— Trailing twelve-month EV/EBITDA is 12.56, below its own three-year average of 15.60
Attractiveness
Key figures, RUB bn
| Metric | Q2 2025 | Q2 2026 | Change |
|---|---|---|---|
| Revenue | 3.60 | 4.42 | +22.8% |
| EBITDA | 0.71 | 1.31 | +84.4% |
| Operating profit | 0.61 | 1.22 | +98.9% |
| Net profit | 0.79 | 1.04 | +31.6% |
| Operating cash flow | 1.18 | 1.22 | +3.5% |
| Capex | 0.03 | 0.06 | +76.8% |
| EBITDA margin | 19.7% | 29.6% | +9.9 pp |
| Net margin | 21.9% | 23.5% | +1.6 pp |
Revenue rose 22.8% year on year, an acceleration from 21.3% in the fourth quarter of 2025
In the second quarter of 2026 Cian's revenue reached RUB 4,425.0 mn, up 22.8% year on year. This is an acceleration from 21.3% growth in the fourth quarter of 2025. The company is outpacing the broader real-estate market on both transaction count and value.
The core business is growing faster than the group: in the first quarter of 2026 its revenue rose 19.3% year on year, while the group as a whole grew 17.9%. Lead generation, the key segment, increased revenue by 18.4%, and display ads revenue grew 10%. The difference is explained by a smaller declining segment within the group.
The acceleration in revenue growth to 22.8% in the second quarter confirms that demand for the platform remains strong. The company maintains its full-year 2026 revenue growth guidance of 17–22%.
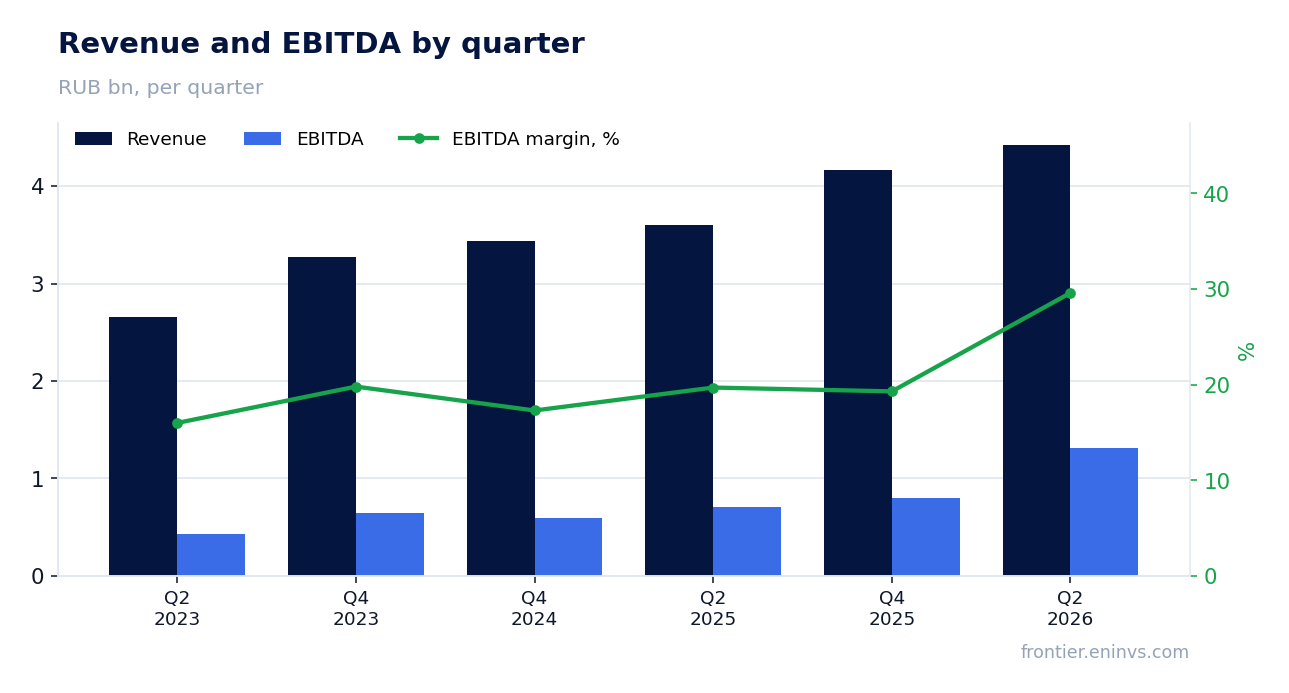
EBITDA grew 84.4% and its margin climbed to 29.6% from 19.7% — costs barely moved
EBITDA in the second quarter of 2026 rose 84.4% year on year to RUB 1,311.0 mn. The EBITDA margin was 29.6% versus 19.7% a year earlier. Such margin growth is the result of revenue growth outpacing almost flat operating expenses.
In the first quarter of 2026 operating expenses even declined 0.4% year on year, which expanded the margin by 11.6 pp to 34.4%. In the second quarter the margin was lower than in the first but still significantly above last year's level. The company reaffirms its full-year 2026 EBITDA margin guidance of at least 30%.
Operating profit in the second quarter was RUB 1,223.0 mn, close to EBITDA, as depreciation is small. This indicates that the business requires almost no capital expenditure to maintain its current operating efficiency.
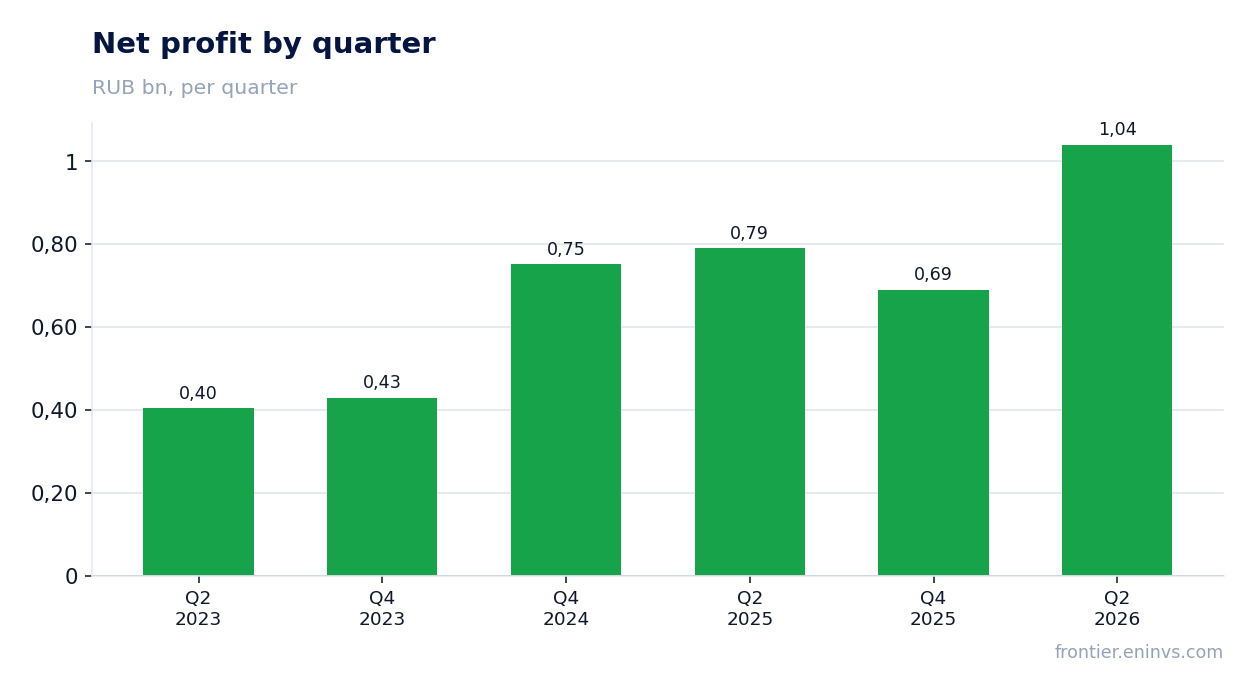
Net profit increased 31.6% to RUB 1,040.0 mn, but part of that growth may be one-off
Net profit in the second quarter of 2026 was RUB 1,040.0 mn, up 31.6% year on year. The net margin rose to 23.5% from 21.9%. Profit growth lags EBITDA growth, which may be explained by one-off factors or a change in the tax burden.
In the first quarter of 2026 net profit jumped 363% year on year to RUB 1.0 bn, driven by operating leverage. In the second quarter profit growth was more modest but still double-digit. Part of the profit may have come from one-off items that will not recur in future periods.
Over the last twelve months net profit amounted to RUB 3,112.0 mn. This figure is used for dividend calculations and for the P/E ratio, which stands at 16.19.
Operating cash flow for the quarter was RUB 1,223.0 mn with capital expenditure of just RUB 61.0 mn
Operating cash flow in the second quarter of 2026 was RUB 1,223.0 mn, almost matching operating profit. Capital expenditure was minimal at RUB 61.0 mn, less than 5% of operating cash flow. This is typical for a platform business with low capital intensity.
Free cash flow therefore remains high and sufficient to fund dividends. Over the last twelve months operating cash flow amounted to RUB 4,375.5 mn, covering dividend payments.
In the first quarter of 2026 operating cash flow declined 9% year on year due to a corporate tax pre-payment and adverse working-capital timing. In the second quarter the flow recovered, suggesting these factors were temporary.
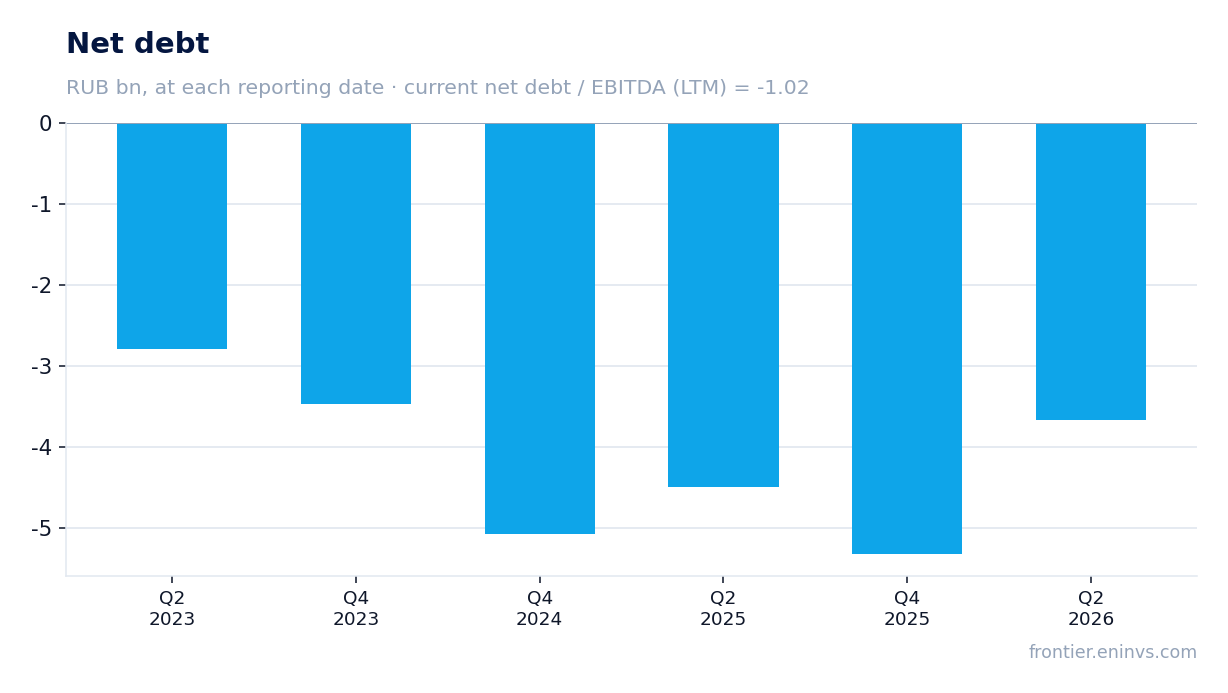
Net debt remains negative: minus RUB 3,670.0 mn at 30 June 2026, or minus 1.02 times trailing twelve-month EBITDA
Cian's net debt at 30 June 2026 was minus RUB 3,670.0 mn, meaning the company has a net cash position. This corresponds to minus 1.02 times trailing twelve-month EBITDA. Negative net debt means cash and equivalents exceed debt obligations.
Since the start of the year net debt changed from minus RUB 5.3 bn at 31 December 2025 to minus RUB 3.7 bn at 30 June 2026, an increase of RUB 1.7 bn. Over twelve months the figure moved from minus RUB 4.5 bn at 30 June 2025 to minus RUB 3.7 bn at 30 June 2026, an increase of RUB 0.8 bn. This may be related to dividend payments and seasonal factors.
There is no debt burden, giving the company freedom for investment and shareholder payouts. Interest expenses are minimal, as debt is effectively negative.
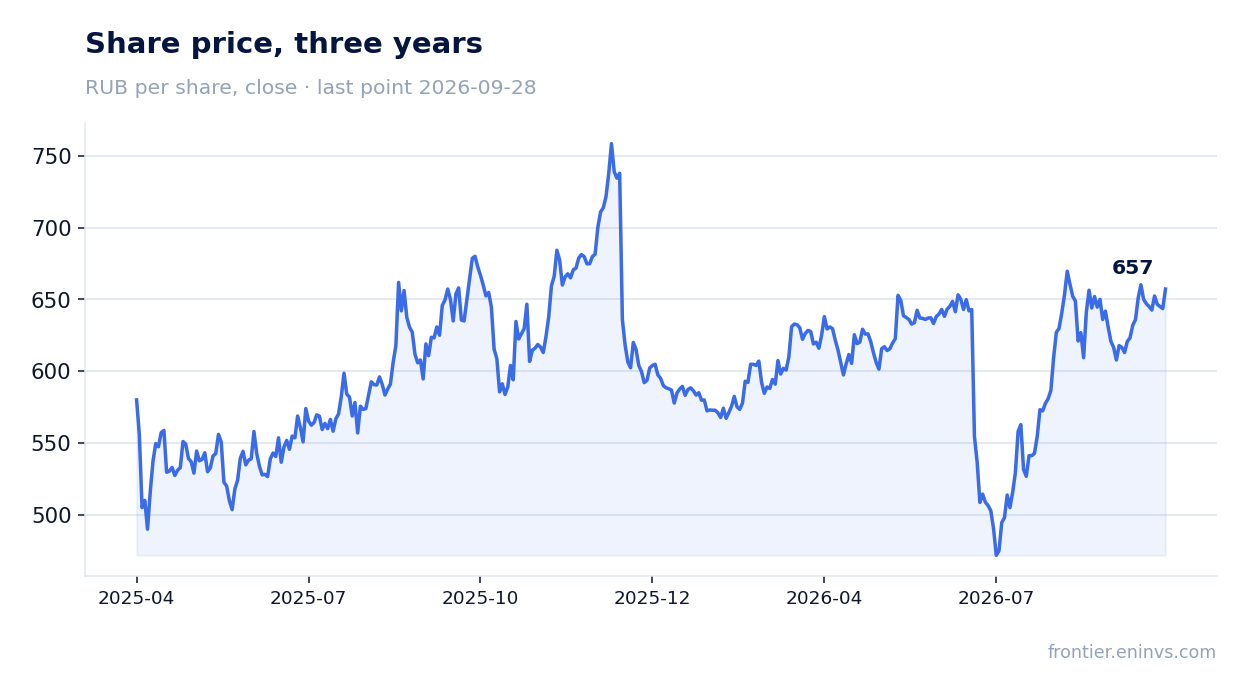
We estimate the dividend for 2026 at RUB 40.07 per share — 6.2% on the current price versus 24.1% on payouts over the last twelve months
Over the last twelve months Cian paid RUB 157.0 per share, giving a dividend yield of 24.1% on the current price. In 2026 a dividend of RUB 53.0 per share has already been paid, with a yield of 8.2% at the ex-date. However, our estimate for the current financial year (to be paid next year) is RUB 40.07 per share, corresponding to a yield of 6.2% on the current price. This is our estimate, not a board decision.
Our estimate is based on a 100% payout of trailing twelve-month net profit (RUB 3,112.0 mn) and the current number of shares. The company's dividend policy implies a payout of at least 100% of adjusted net profit, but the final decision rests with the board. The decline in our forecast relative to last year's payouts is because last year the company may have distributed accumulated profit.
The yield we consider fair for this name is 16.3%. The current yield on our estimates is below fair, which limits the appeal of the stock as a dividend story. The central bank key rate is 14.0%, and a yield of 6.2% is below the rate, which also does not favour the stock.
The dividend could be smaller if the company increases capital expenditure or if profit in the second half falls short of expectations. There is also a risk of a change in dividend policy.
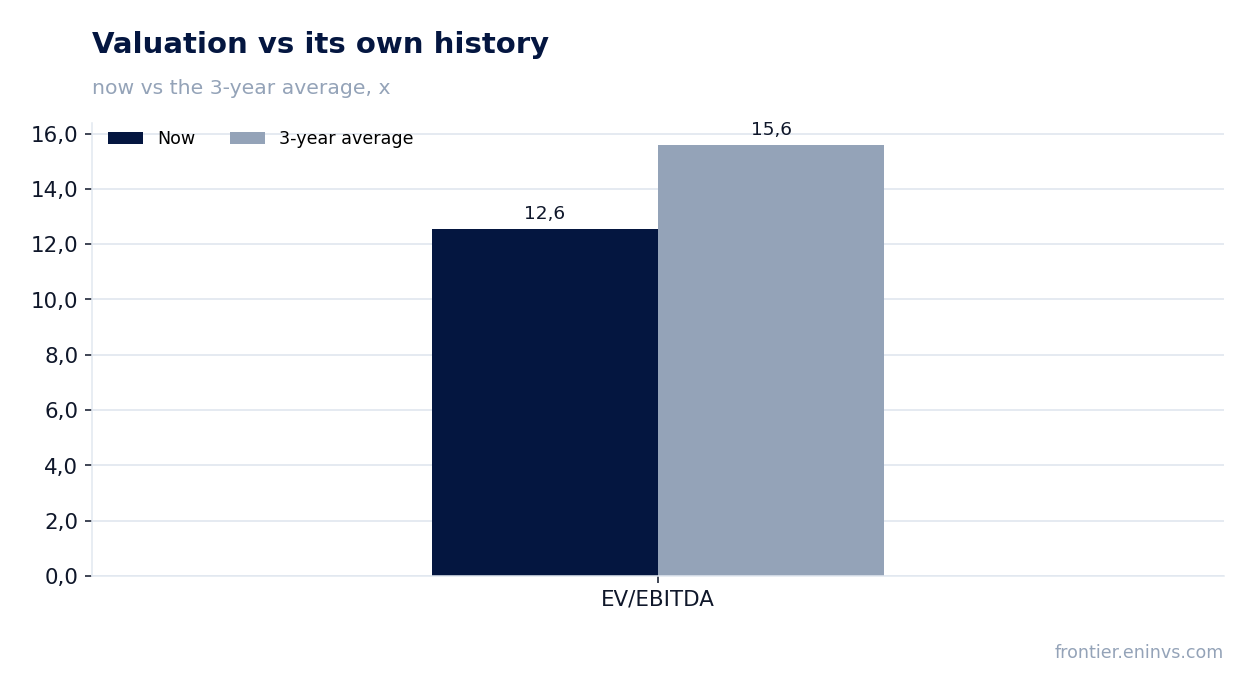
Trailing twelve-month EV/EBITDA is 12.56, below its own three-year average of 15.60
Trailing twelve-month EV/EBITDA is 12.56, below its own three-year average of 15.60. This indicates that the stock trades cheaper than its average over the last three years. The trailing twelve-month P/E is 16.19.
According to our fundamental model, which compares EBITDA growth with a target multiple and market capitalisation, the upside of the share to its fair value is +30%. This is our own estimate, not a consensus forecast.
The stock is held in our live model strategies 'RU Dividend growers' (income) and 'RU GARP + acceleration'. This is a fact, not an argument for the verdict.
Valuation on the latest reported figures
| Metric | Value |
|---|---|
| Market cap | 50.4 bn ₽ |
| P/E (LTM) | 16.2 |
| EV/EBITDA (LTM) | 12.6 |
| P/B | 8.47 |
| Net debt / EBITDA (LTM) | -1.02 |
| Operating cash flow (LTM) | 4.38 bn |
| ROE | 102.8% |
| Dividend yield (12m) | 24.0% |
| EV/EBITDA, 3-year average | 15.6 |
Dividend per share, ₽, and yield at the ex-date
| Year paid | Dividend | Yield |
|---|---|---|
| 2025 | 104.00 | 14.1% |
| 2026 | 53.00 | 8.2% |
| Our estimate, current year | 40.07 | 6.2% on the current price |
Bottom line
Cian delivered a strong second quarter of 2026: revenue accelerated to 22.8%, EBITDA grew 84.4%, and the margin rose to 29.6%. The company maintains negative net debt and generates significant free cash flow with minimal capital expenditure. However, this year's dividend yield, on our estimates, will be well below last year's — around 6.2% versus 24.1% over the last twelve months. The EV/EBITDA multiple is below its own three-year average, and the portal's model points to +30% upside. Verdict: the stock looks attractive at the current price, but the key question for a holder is whether the company can sustain profit and dividend growth amid a possible market slowdown.
Open the company's financial profile CNRU →
See also: market overview · valuation map · stock screeners