EuroElTech: H1 revenue up 46.9%, but profit and cash flow pull in opposite directions
On 31 August EuroElTech released its H1 2026 results. Revenue rose 46.9% year on year to RUB 4,850.7 mn, EBITDA added only 2.0% to RUB 394.8 mn, and net profit fell 14.6% to RUB 120.8 mn. Operating cash flow swung to minus RUB 1,317.9 mn from plus RUB 74.4 mn a year earlier, while net debt reached RUB 2,062.5 mn as of 30 June. At 5.27 times earnings and an 11.3% dividend yield the stock looks rather attractive, but only if cash flow turns around in the second half.
Key takeaways
— Revenue rose 46.9% on the engineering systems segment, but a single customer accounted for 34% of the total
— EBITDA added only 2.0% because commercial and administrative expenses grew faster than revenue
— Net profit fell 14.6% on higher financial expenses of RUB 170.7 mn and tax payments
— Operating cash flow swung to minus RUB 1,317.9 mn on inventory build-up and lower advances received
— Net debt rose from RUB 0.4 bn at end-2025 to RUB 2.1 bn as of 30 June 2026
— The 2026 dividend of RUB 0.85 per share has already been paid, a 12.1% yield at the ex-date price
— On the portal's model the fair value is 21% below the current price
Attractiveness
Key figures, RUB bn
| Metric | H1 2025 | H1 2026 | Change |
|---|---|---|---|
| Revenue | 3.30 | 4.85 | +46.9% |
| EBITDA | 0.39 | 0.39 | +2.0% |
| Operating profit | 0.31 | 0.32 | +2.1% |
| Net profit | 0.14 | 0.12 | -14.6% |
| Operating cash flow | 0.07 | -1.32 | -1871.8% |
| Capex | 0.07 | 0.05 | -19.0% |
| EBITDA margin | 11.7% | 8.1% | -3.6 pp |
| Net margin | 4.3% | 2.5% | -1.8 pp |
Revenue rose 46.9% on the engineering systems segment, but a single customer accounted for 34% of the total
H1 2026 revenue reached RUB 4,850.7 mn versus RUB 3,302.6 mn a year earlier – growth of 46.9%. The engineering systems segment brought in RUB 3,842.9 mn of that, technological systems RUB 1,007.7 mn. A year earlier the split was RUB 2,694.6 mn and RUB 608.0 mn respectively, meaning engineering systems grew 42.6% and technological systems 65.7%.
However, 34% of total revenue, or RUB 1,635.9 mn, came from a single largest customer. A year earlier its share was 25%, or RUB 825.5 mn. Concentration on one client has intensified: a third of the business now depends on one contract, and losing it or delaying its timelines would hit the entire report.
Q2 2026 standalone is not disclosed, but the half-year shows the main increase came from engineering systems, which supplies power supply equipment. Technological systems, producing oil and gas equipment, grow faster in percentage terms, but their contribution to absolute growth is smaller – about RUB 400 mn versus RUB 1,148 mn for engineering systems.
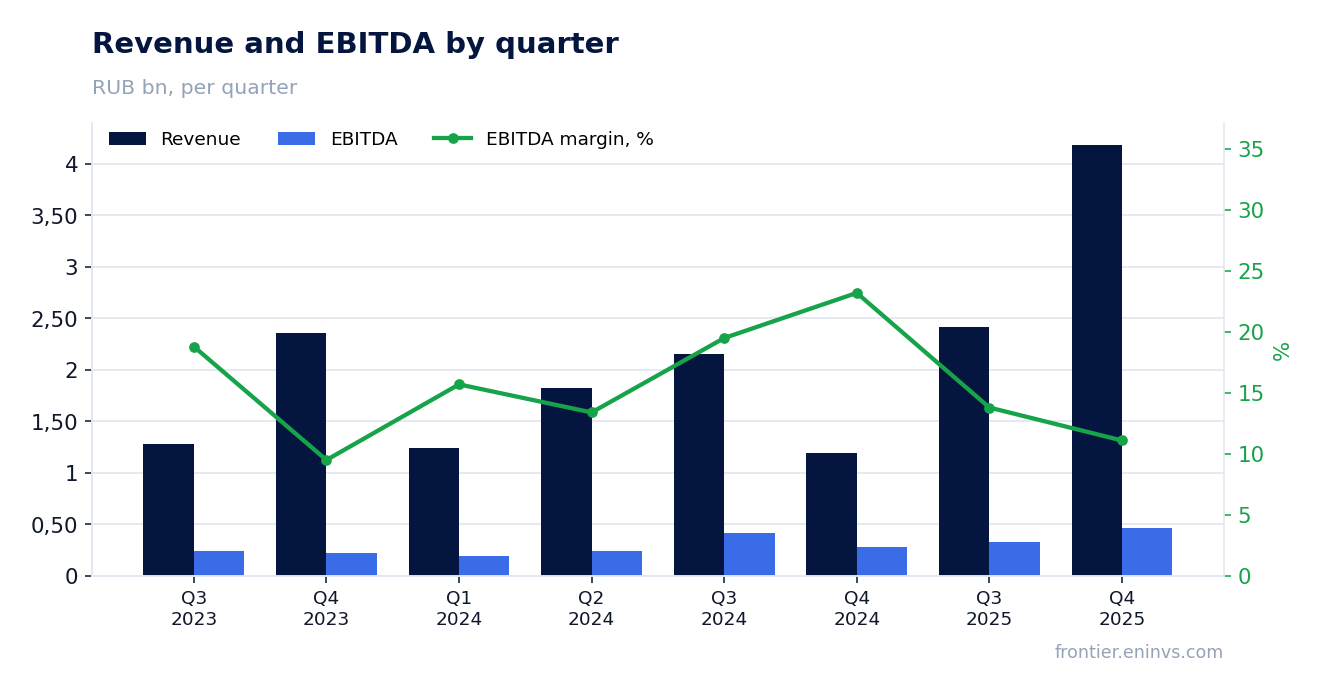
EBITDA added only 2.0% because commercial and administrative expenses grew faster than revenue
H1 2026 EBITDA reached RUB 394.8 mn versus RUB 386.9 mn a year earlier – growth of just 2.0%. With revenue up 46.9%, this means almost the entire increase dissolved in expenses. EBITDA margin fell to 8.1% from 11.7% a year earlier.
Commercial expenses rose to RUB 237.6 mn from RUB 116.1 mn, administrative expenses to RUB 308.4 mn from RUB 221.5 mn. Together they added RUB 208.4 mn, while gross profit grew only RUB 282.1 mn. Cost of sales increased to RUB 3,934.2 mn from RUB 2,668.2 mn, growing faster than revenue: 47.4% versus 46.9%.
Operating profit grew marginally – to RUB 317.3 mn from RUB 310.9 mn, just 2.1%. Other operating expenses amounted to RUB 53.2 mn versus income of RUB 14.1 mn a year earlier, further eating into the result. Gross margin declined to 18.9% from 19.2%, but the main hit came from commercial and administrative lines.
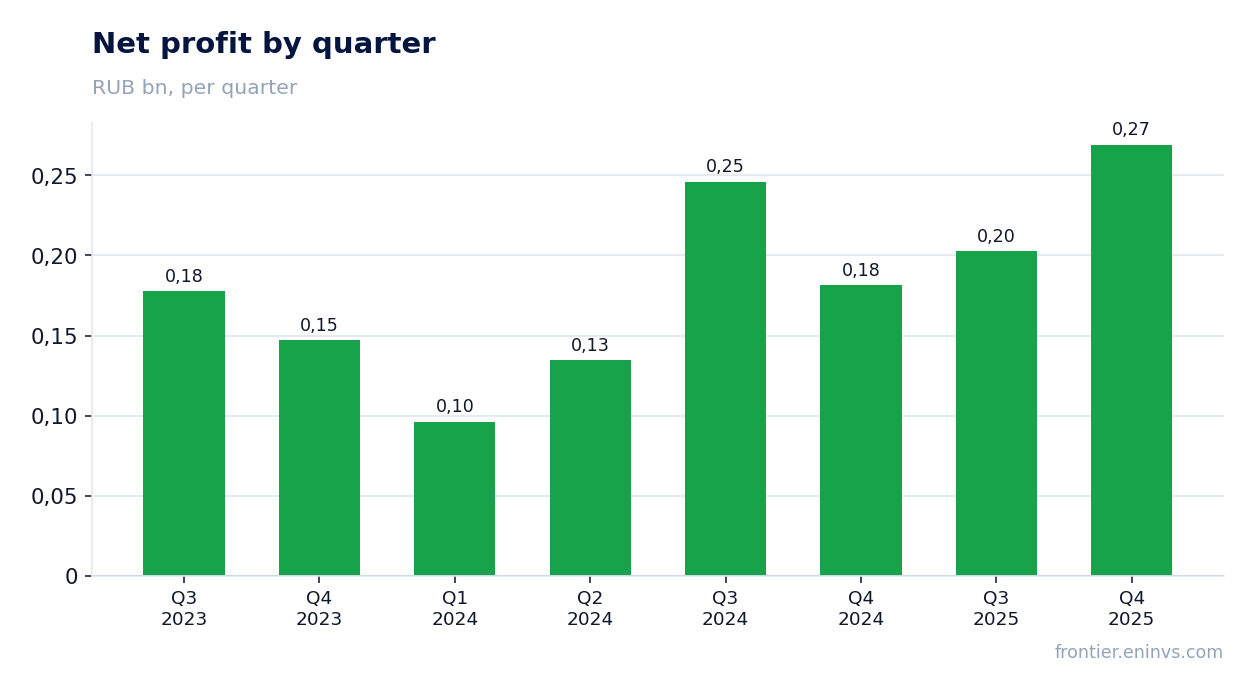
Net profit fell 14.6% on higher financial expenses of RUB 170.7 mn and tax payments
H1 2026 net profit reached RUB 120.8 mn versus RUB 141.3 mn a year earlier – a decline of 14.6%. Pre-tax profit fell to RUB 173.9 mn from RUB 181.1 mn, while income tax expense rose to RUB 53.2 mn from RUB 39.7 mn. The effective tax rate climbed to 30.6% from 21.9%.
Financial expenses rose to RUB 170.7 mn from RUB 149.9 mn, which with financial income of RUB 27.3 mn gave net financial expenses of RUB 143.4 mn versus RUB 129.8 mn a year earlier. Rising debt load directly pressures profit: the more loans and borrowings, the more interest leaves pre-tax profit.
Net margin declined to 2.5% from 4.3%. Earnings per share for the half-year were RUB 0.22 versus RUB 0.26 a year earlier. Over the last 12 months net profit reached RUB 791.0 mn, giving a P/E of 5.27 – the market values annual earnings very cheaply, but those earnings are not confirmed by cash flow.
Operating cash flow swung to minus RUB 1,317.9 mn on inventory build-up and lower advances received
H1 2026 operating cash flow was minus RUB 1,317.9 mn versus plus RUB 74.4 mn a year earlier. This is the most alarming figure in the report: the business grows in revenue but sucks cash out of working capital. Capital expenditures were small – RUB 54.3 mn versus RUB 67.1 mn a year earlier – so the problem is not investment but working capital.
The main reasons for the outflow are visible in the cash flow statement. Advances received fell by RUB 1,179.5 mn versus growth of RUB 574.3 mn a year earlier – meaning customers stopped prepaying orders at the previous volume. Inventories rose by RUB 121.7 mn, work in progress increased to RUB 635.2 mn from RUB 488.8 mn at end-2025. Trade and other payables declined by RUB 434.6 mn.
Trade receivables rose to RUB 1,875.8 mn from RUB 1,324.3 mn at end-2025, while advances issued were RUB 1,216.8 mn versus RUB 1,738.4 mn. The company finances its suppliers and customers but does not receive prepayment itself. Over the last 12 months operating cash flow is also negative – minus RUB 332.2 mn – so the problem is not only in the first half.
Cash on accounts declined to RUB 407.1 mn from RUB 685.7 mn at end-2025. With negative operating cash flow and dividends paid of RUB 322.8 mn, the company covered the gap by borrowing: RUB 3,639.0 mn raised and RUB 2,464.6 mn repaid in the half-year. Net cash inflow from financing was RUB 1,062.0 mn.
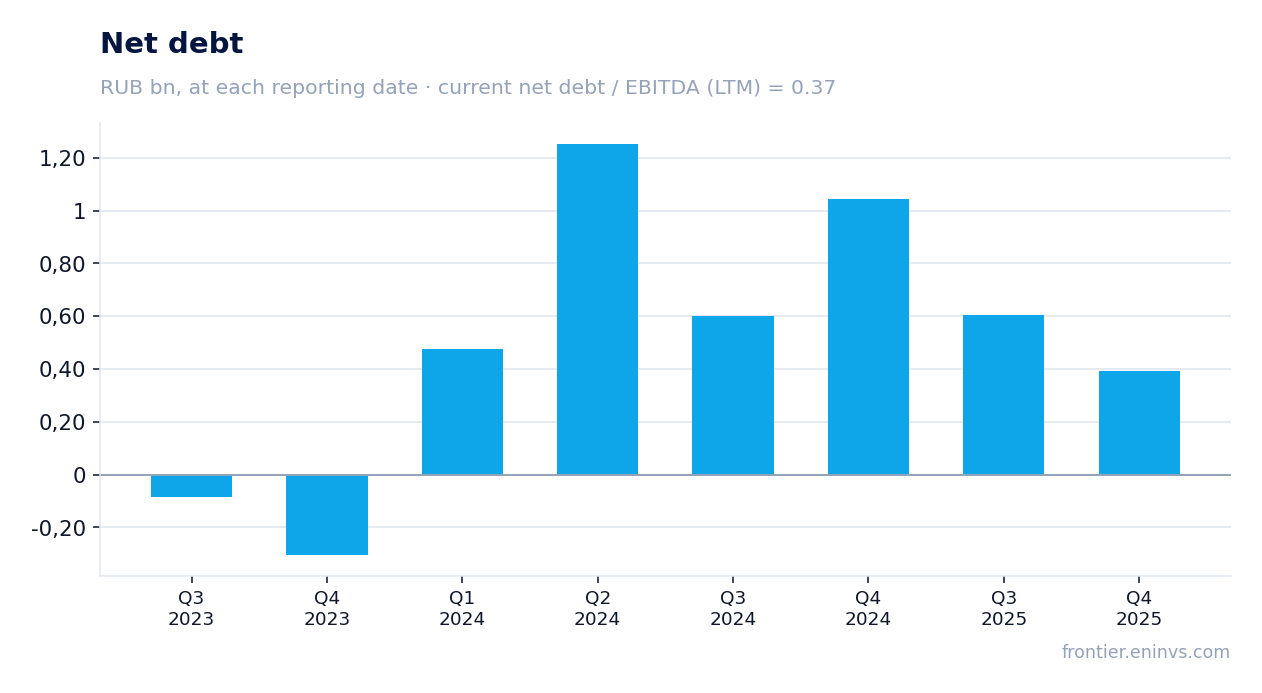
Net debt rose from RUB 0.4 bn at end-2025 to RUB 2.1 bn as of 30 June 2026
Net debt as of 30 June 2026 was RUB 2,062.5 mn versus RUB 392.4 mn as of 31 December 2025 – an increase of RUB 1.7 bn. A year earlier, as of 30 June 2025, net debt was RUB 0.9 bn, meaning it grew RUB 1.2 bn over 12 months. The net debt to EBITDA ratio for the last 12 months is 1.92 – a moderate level, but calculated against EBITDA of RUB 1,072.1 mn that is not confirmed by cash flow.
Debt growth financed negative operating cash flow and dividends. The company raised RUB 3,639.0 mn in loans and borrowings and also issued debt digital financial assets worth RUB 200.0 mn – a new instrument in this half-year. Short-term loans and borrowings from related parties amounted to RUB 1,191.5 mn as of 30 June 2026, whereas at end-2025 there were none.
Financial expenses rose to RUB 170.7 mn from RUB 149.9 mn. With the key rate at 14.0%, debt servicing remains expensive. If operating cash flow does not turn around in the second half, the company will have to either increase debt further or cut dividends. So far the net debt to EBITDA ratio of 1.92 does not look critical, but it is rising along with absolute debt.
The 2026 dividend of RUB 0.85 per share has already been paid, a 12.1% yield at the ex-date price
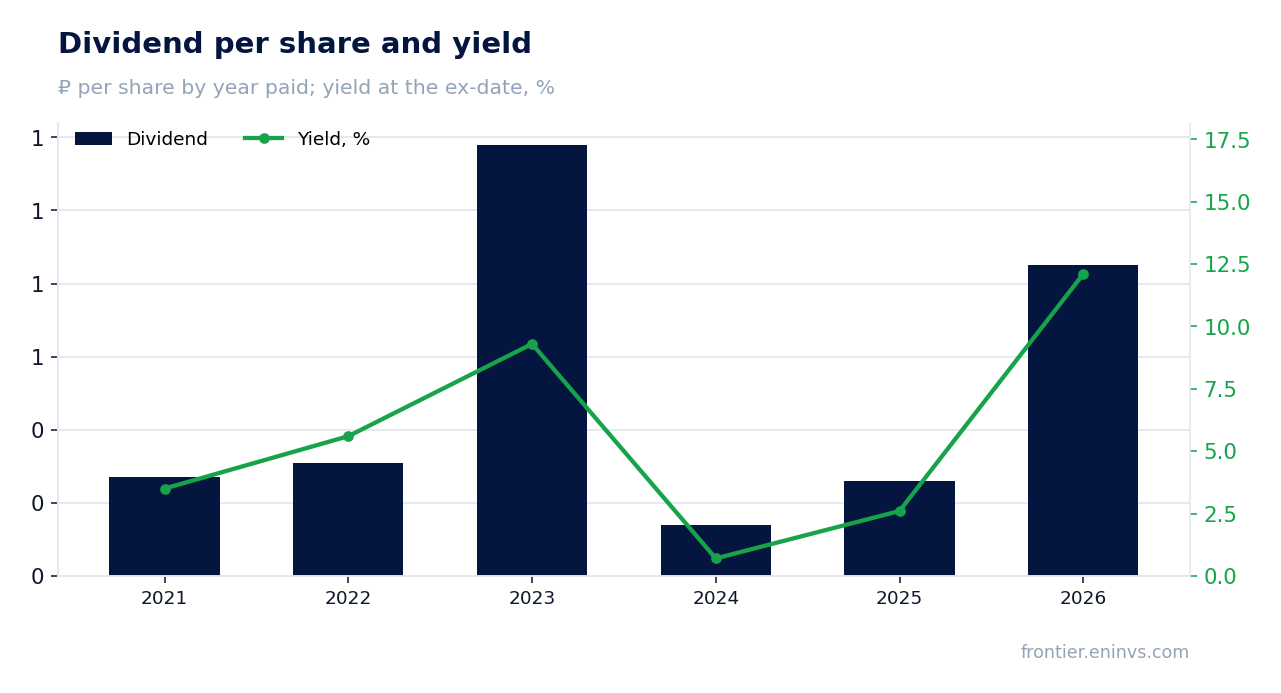
Over the last 12 months the company paid RUB 0.85 per share, giving a current dividend yield of 11.3%. This is significantly above the 7.0% fair yield we assume for the stock. In calendar 2026, RUB 0.85 per share has already been paid – a 12.1% yield at the ex-date price of RUB 7.02. No further payouts are planned this year.
The dividend history is uneven: RUB 1.18 per share in 2023, only RUB 0.14 in 2024 and RUB 0.26 in 2025. The RUB 0.85 payment in 2026 is the largest since 2023. The company allocated RUB 322.8 mn to dividends in the half-year, which is 0.43 of profit. The payment was made with negative operating cash flow, meaning it was financed by debt.
Our estimate for the current financial year's dividend (to be paid next year) is RUB 0.83 per share, giving 11.0% to the current price. This is our own calculation: we take last-12-month profit, multiply by 0.58 – the share of profit the company actually paid out last year – and divide by the number of shares. The board decides, and with negative cash flow the payout could be smaller.
The key rate is 14.0% – a risk-free alternative. The 11.3% dividend yield is below the rate, but given the business growth potential and low P/E the stock may be interesting. The main risk to the dividend is further cash outflow: if operating cash flow remains negative, the company will have to choose between paying out and servicing debt.
On the portal's model the fair value is 21% below the current price
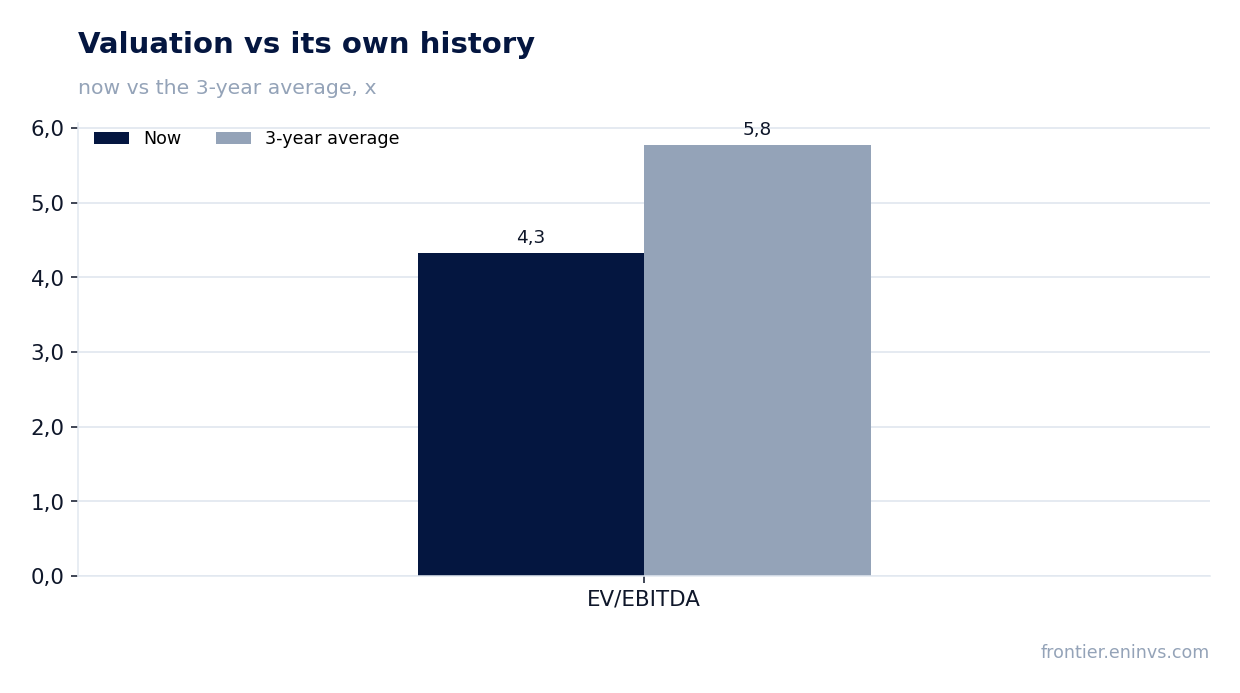
LTM EV/EBITDA is 4.26 – below the three-year average of 5.78. The stock trades below its historical valuation on this multiple. LTM P/E is 5.27, which also looks cheap. However, our fundamental model, which compares EBITDA growth with the target multiple and market capitalisation, gives a fair value 21% below the current price.
Market capitalisation is RUB 4,171.7 mn, net debt RUB 2,062.5 mn, giving an EV of about RUB 6,234.2 mn. With LTM EBITDA of RUB 1,072.1 mn we get EV/EBITDA of 4.26. If EBITDA stays at the last-12-month level and debt continues to grow, the multiple will look even cheaper, but only if earnings are confirmed by cash.
ROE is 7.7% – low for a company paying an 11.3% dividend yield. This means the company distributes more than it earns on capital. With negative operating cash flow and rising debt, the sustainability of such a model is questionable. The portal's model points to 21% downside, which outweighs the low multiples.
Valuation on the latest reported figures
| Metric | Value |
|---|---|
| Market cap | 4.17 bn ₽ |
| P/E (LTM) | 5.3 |
| EV/EBITDA (LTM) | 4.3 |
| P/B | 1.29 |
| Net debt / EBITDA (LTM) | 1.92 |
| Operating cash flow (LTM) | -0.33 bn |
| ROE | 7.7% |
| Dividend yield (12m) | 11.3% |
| EV/EBITDA, 3-year average | 5.8 |
Dividend per share, ₽, and yield at the ex-date
| Year paid | Dividend | Yield |
|---|---|---|
| 2021 | 0.27 | 3.5% |
| 2022 | 0.31 | 5.6% |
| 2023 | 1.18 | 9.3% |
| 2024 | 0.14 | 0.7% |
| 2025 | 0.26 | 2.6% |
| 2026 | 0.85 | 12.1% |
| Our estimate, current year | 0.83 | 11.0% on the current price |
Bottom line
The strong side of the report is 46.9% revenue growth and low multiples: EV/EBITDA 4.26 versus the three-year average of 5.78, P/E 5.27. The weak side is the quality of that revenue: EBITDA grew only 2.0%, profit fell 14.6%, and operating cash flow swung to minus RUB 1,317.9 mn. The RUB 0.85 per share dividend has already been paid, but financed by debt, which rose to RUB 2,062.5 mn. Our model gives 21% downside, and this outweighs the cheap multiples. The question for a holder now is not the dividend yield but whether cash flow turns around in the second half.
Open the company's financial profile EELT →
See also: market overview · valuation map · stock screeners