EuroElTech: revenue up 46.9%, but profit and cash flow moved in opposite directions
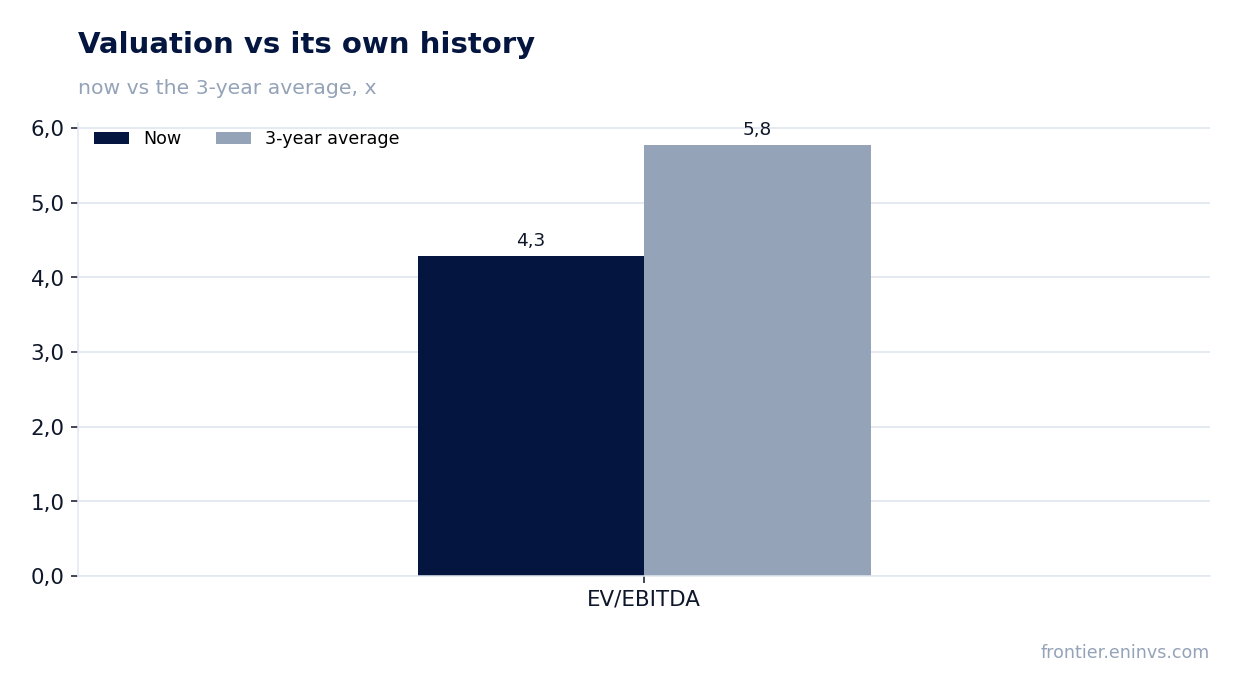
On 31 August EuroElTech released its Q2 2026 results. Revenue rose 46.9% year on year to RUB 2,425.7 mn, EBITDA added only 2.0% to RUB 197.8 mn, and net profit fell 14.6% to RUB 60.4 mn. The EBITDA margin compressed from 11.7% to 8.2%, while operating cash flow for the quarter was minus RUB 659.0 mn. With EV/EBITDA at 4.3 against its own three-year average of 5.8 and a dividend yield of 11.1%, the stock looks cheap, but weak conversion of revenue into cash and profit makes the assessment rather neutral.
Key takeaways
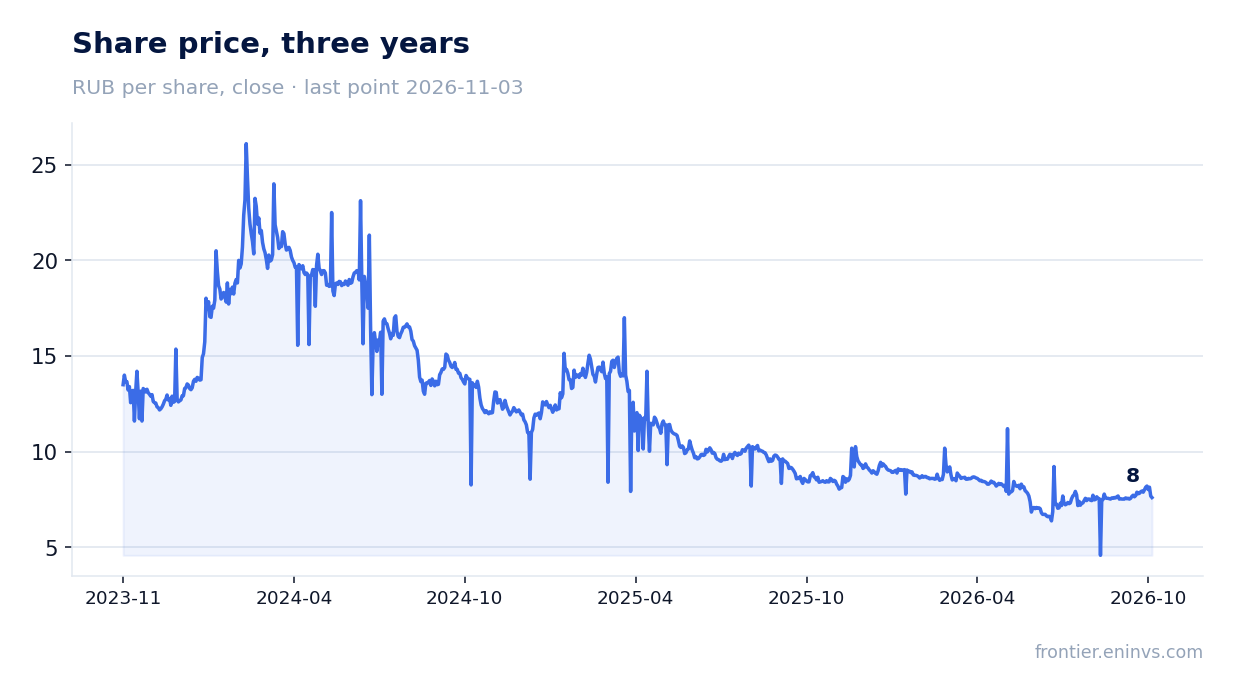
— Revenue rose 46.9%, but EBITDA added only 2.0% – cost of sales absorbed the growth
— EBITDA margin compressed from 11.7% to 8.2%, and commercial expenses grew faster than revenue
— Net profit fell 14.6% despite revenue nearly doubling
— Operating cash flow for the quarter was minus RUB 659.0 mn with capital expenditure of just RUB 27.1 mn
— Net debt rose from RUB 0.4 bn at end-2025 to RUB 2.1 bn on 30 June 2026
— Dividend yield of 11.1% on a payout of RUB 0.85 per share is above our fair estimate of 7.0%
— EV/EBITDA of 4.3 is below its own three-year average of 5.8, but the portal model implies minus 21% to fair value
Attractiveness
Key figures, RUB bn
| Metric | Q2 2025 | Q2 2026 | Change |
|---|---|---|---|
| Revenue | 1.65 | 2.43 | +46.9% |
| EBITDA | 0.19 | 0.20 | +2.0% |
| Operating profit | 0.16 | 0.16 | +2.1% |
| Net profit | 0.07 | 0.06 | -14.6% |
| Operating cash flow | 0.04 | -0.66 | -1871.8% |
| Capex | 0.03 | 0.03 | -19.0% |
| EBITDA margin | 11.7% | 8.2% | -3.5 pp |
| Net margin | 4.3% | 2.5% | -1.8 pp |
Revenue rose 46.9%, but EBITDA added only 2.0% – cost of sales absorbed the growth
In Q2 2026 EuroElTech's revenue was RUB 2,425.7 mn, up 46.9% year on year. That growth looks impressive, but it barely reached operating profit: EBITDA rose only 2.0% to RUB 197.8 mn, and operating profit was RUB 158.7 mn.
The reason is cost of sales. For H1 2026 it rose to RUB 3,934.2 mn from RUB 2,668.2 mn a year earlier, meaning cost of sales is growing faster than revenue. Gross profit for the half-year increased to RUB 916.5 mn from RUB 634.4 mn, but its gain was smaller than the revenue gain.
By segment for the half-year, Engineering Systems revenue was RUB 3,843.0 mn and Technological Systems revenue RUB 1,007.7 mn. Segment EBITDA rose to RUB 394.8 mn from RUB 386.9 mn, i.e. only 2.0%. Engineering Systems drove the revenue growth, but its EBITDA added just 11.8%, while Technological Systems EBITDA fell 23.4%.
For an investor this means the company is growing turnover, not profit. Revenue nearly doubling does not translate into EBITDA growth, and that is the main question for the report.
EBITDA margin compressed from 11.7% to 8.2%, and commercial expenses grew faster than revenue
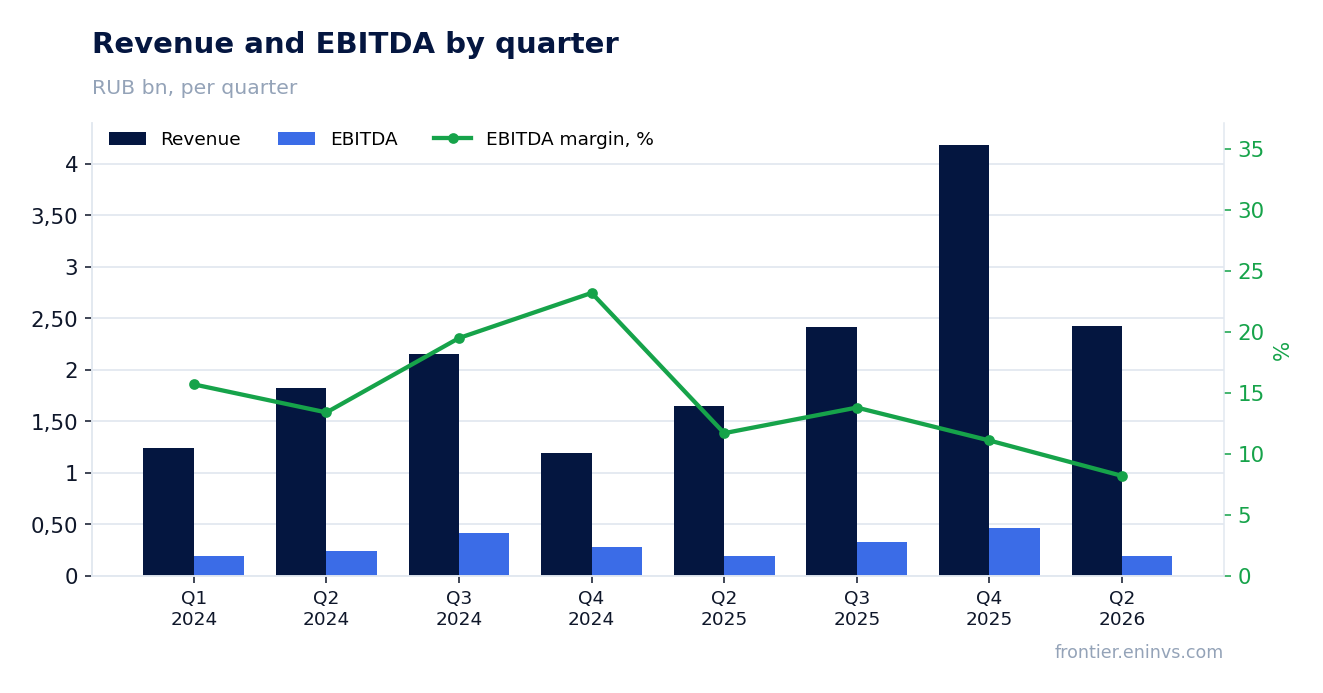
EBITDA margin in Q2 2026 was 8.2% versus 11.7% a year earlier. The 3.5 percentage point compression is a direct consequence of faster cost growth. Commercial expenses for the half-year rose to RUB 237.6 mn from RUB 116.1 mn, more than doubling, while administrative expenses rose to RUB 308.4 mn from RUB 221.5 mn.
Commercial expenses are growing faster than revenue: with revenue up 46.9% for the half-year, they more than doubled. This may reflect either expansion of the sales network or one-off promotion costs, but the report does not disclose the cause. Administrative expenses rose 39.2%, below the revenue growth rate but still noticeable.
Net margin in Q2 was 2.5% versus 4.3% a year earlier. The decline in net margin is explained not only by operating expenses but also by higher financial expenses: for the half-year they were RUB 170.7 mn versus RUB 149.9 mn a year earlier.
Margin compression is a key risk for the dividend story. If the company cannot maintain profitability, the profit from which dividends are paid will shrink.
Net profit fell 14.6% despite revenue nearly doubling
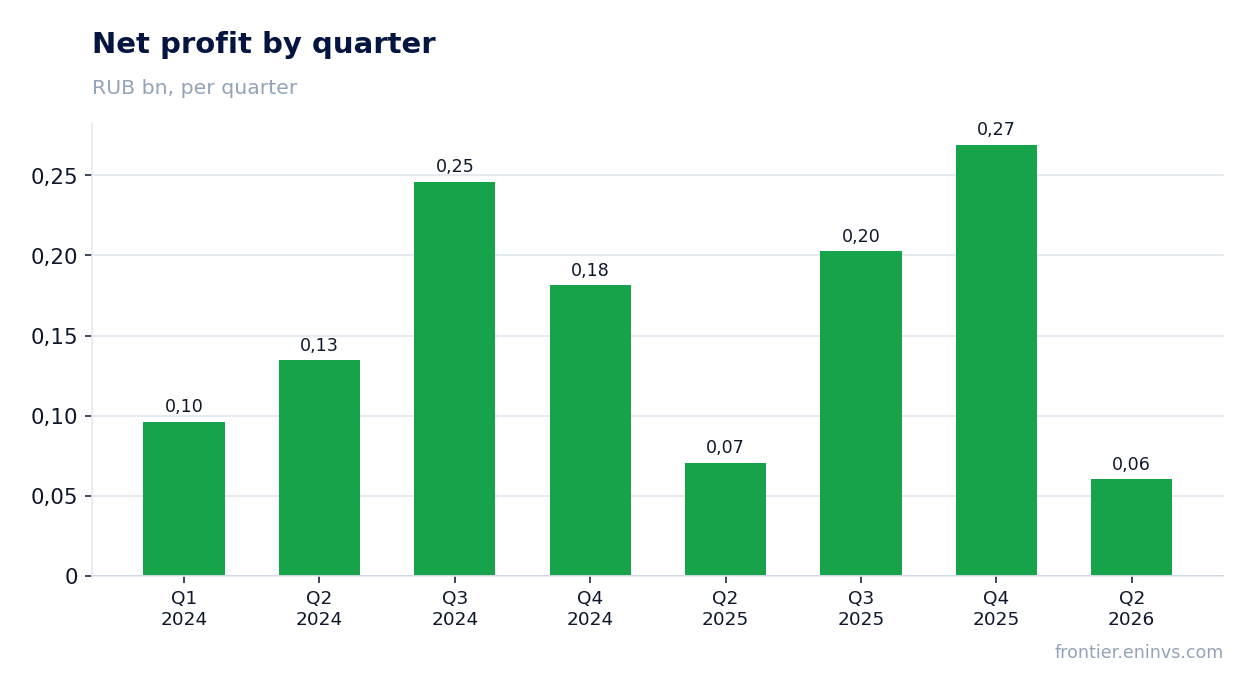
Net profit in Q2 2026 was RUB 60.4 mn, down 14.6% year on year. With revenue up 46.9%, this gap is explained by margin compression and higher financial expenses. For the half-year net profit was RUB 120.8 mn versus RUB 141.3 mn a year earlier.
Financial expenses for the half-year rose to RUB 170.7 mn from RUB 149.9 mn. The increase in interest expenses is linked to higher debt: net debt on 30 June 2026 was RUB 2,060.5 mn versus RUB 392.4 mn at end-2025. This consumes a significant part of operating profit.
Earnings per share for the half-year were RUB 0.22 versus RUB 0.26 a year earlier. Falling EPS despite revenue growth is a warning signal for dividend-oriented shareholders.
One-off items in profit: the report mentions a change in the expected credit loss allowance of RUB 23.0 mn, which reduced profit. Without this allowance profit would be higher, but the effect is small relative to the overall decline.
Operating cash flow for the quarter was minus RUB 659.0 mn with capital expenditure of just RUB 27.1 mn
Operating cash flow in Q2 2026 was negative at minus RUB 659.0 mn. This is a sharp contrast to positive flow in previous periods. For H1 2026, net cash used in operating activities was minus RUB 1,317.9 mn versus plus RUB 74.4 mn a year earlier.
The cause is the change in working capital. Advances received fell by RUB 1,179.5 mn, whereas a year earlier they rose by RUB 574.3 mn. This means the company either settled previously received advances or did not receive new ones. Receivables rose by RUB 493.1 mn, which also absorbed cash.
Capital expenditure for the quarter was small at RUB 27.1 mn, and for the half-year RUB 54.3 mn. This is below last year's level, when RUB 67.1 mn was spent in the half-year. Free cash flow is therefore negative because of the operating outflow, not because of investment.
Negative cash flow amid revenue growth is a serious signal. The company is financing working capital with debt, as seen in the rise in net debt.
Net debt rose from RUB 0.4 bn at end-2025 to RUB 2.1 bn on 30 June 2026
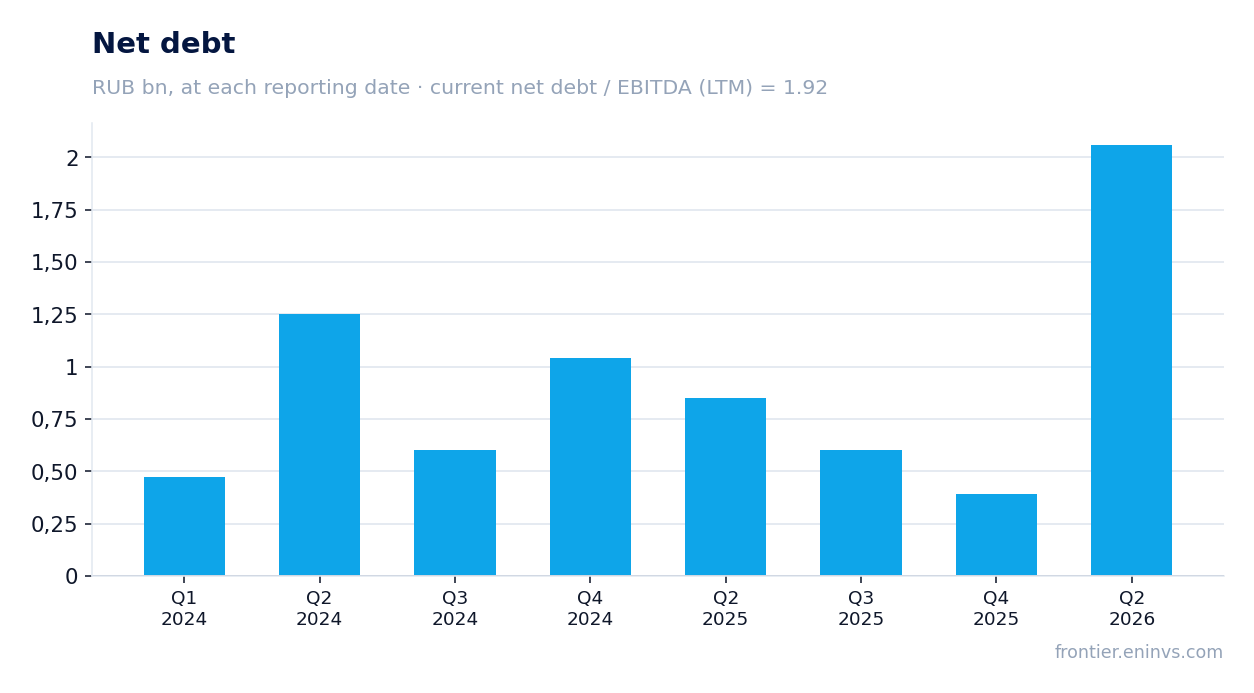
Net debt on 30 June 2026 was RUB 2,060.5 mn versus RUB 392.4 mn on 31 December 2025, an increase of RUB 1.7 bn. Over 12 months net debt rose from RUB 850.4 mn on 30 June 2025 to RUB 2,060.5 mn on 30 June 2026, an increase of RUB 1.2 bn.
The rise in debt is linked to negative operating cash flow and dividend payments. In the half-year the company raised RUB 3,639.0 mn in loans and repaid RUB 2,464.6 mn, and also issued debt digital financial assets of RUB 200.0 mn. Dividends paid were RUB 134.5 mn.
The net debt to EBITDA ratio for the last 12 months is 1.92. This is a moderate level, but it has risen due to higher debt and lower EBITDA. Interest expenses for the half-year were RUB 170.7 mn, equivalent to about 8.3% of half-year revenue.
Leverage is not yet critical, but the trend of rising debt with negative cash flow requires attention. If operating flow does not recover, the company will have to either cut dividends or increase debt further.
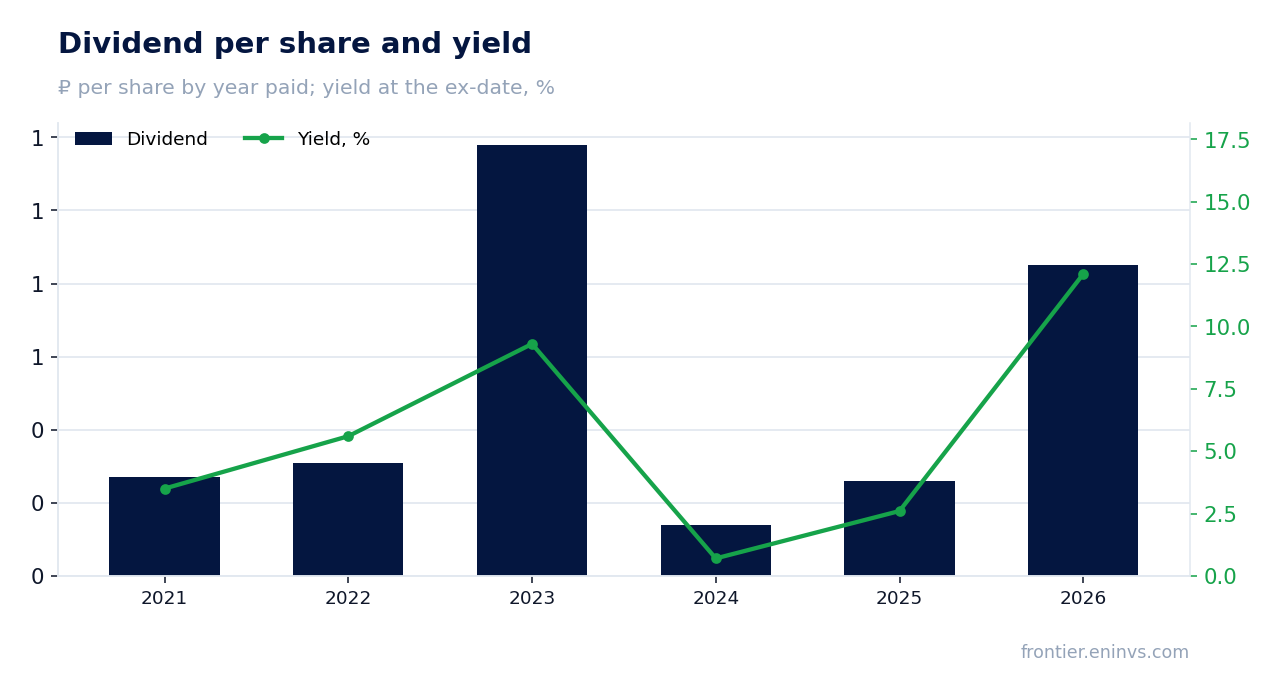
Dividend yield of 11.1% on a payout of RUB 0.85 per share is above our fair estimate of 7.0%
Over the last 12 months EuroElTech paid RUB 0.85 per share, which at the current price gives a dividend yield of 11.1%. This is significantly above our fair yield estimate for this stock of 7.0% and above the central bank key rate of 14.0% adjusted for risk premium. The 2026 payout has already been made at RUB 0.85 per share, corresponding to a 12.1% yield at the ex-date.
The dividend history is uneven: RUB 0.27 per share in 2021, RUB 0.31 in 2022, RUB 1.18 in 2023, RUB 0.14 in 2024, RUB 0.26 in 2025, and RUB 0.85 in 2026. The yield at the ex-date ranged from 0.7% in 2024 to 12.1% in 2026. The current payout is the highest in recent years.
Our estimate for the current year's dividend is RUB 0.85 per share, which has already been paid. The model payout ratio is 0.36 of profit. With net profit of RUB 791.0 mn over the last 12 months and 551.8 mn shares, earnings per share are about RUB 1.43, which at a 0.36 ratio gives a dividend of about RUB 0.52 per share. However, the actual payout of RUB 0.85 exceeds this estimate, which may be due to one-off factors or a higher payout ratio.
The risk of a dividend cut is linked to falling profit. If net profit continues to decline, the company may reduce the payout. In addition, rising debt and negative cash flow could force the company to cut dividends to preserve liquidity.
EV/EBITDA of 4.3 is below its own three-year average of 5.8, but the portal model implies minus 21% to fair value
The EV/EBITDA multiple for the last 12 months is 4.3, which is 26% below its own three-year average of 5.8. This means the stock trades cheaper than usual relative to its history. The P/E for the last 12 months is 5.3, which is also low.
However, our fundamental valuation model, which takes EBITDA growth times a target multiple, shows a downside of 21% to fair value. This discrepancy is explained by the market possibly already pricing in the risk of declining profit and cash flow.
Comparison with history: the current multiple is below average, which may indicate undervaluation. But if profit and cash flow continue to weaken, the multiple may remain low or even rise due to falling EBITDA.
For an investor it is important that a cheap valuation does not always mean a profitable purchase. In this case the low multiple is offset by risks related to falling profit and rising debt.
Valuation on the latest reported figures
| Metric | Value |
|---|---|
| Market cap | 4.23 bn ₽ |
| P/E (LTM) | 5.3 |
| EV/EBITDA (LTM) | 4.3 |
| P/B | 1.31 |
| Net debt / EBITDA (LTM) | 1.92 |
| Operating cash flow (LTM) | -0.33 bn |
| ROE | 8.0% |
| Dividend yield (12m) | 11.1% |
| EV/EBITDA, 3-year average | 5.8 |
Dividend per share, ₽, and yield at the ex-date
| Year paid | Dividend | Yield |
|---|---|---|
| 2021 | 0.27 | 3.5% |
| 2022 | 0.31 | 5.6% |
| 2023 | 1.18 | 9.3% |
| 2024 | 0.14 | 0.7% |
| 2025 | 0.26 | 2.6% |
| 2026 | 0.85 | 12.1% |
Bottom line
The report's strengths remain revenue growth of 46.9% and a dividend yield of 11.1%, which is well above our fair estimate of 7.0%. However, this growth does not convert into profit and cash: EBITDA added only 2.0%, net profit fell 14.6%, and operating cash flow was negative. Net debt rose from RUB 0.4 bn to RUB 2.1 bn in six months, and although its ratio to EBITDA is 1.92, the trend is concerning. The EV/EBITDA of 4.3 is below the historical average of 5.8, but the portal model implies minus 21% to fair value. The verdict is neutral: the dividend is attractive, but execution risks are high.
Open the company's financial profile EELT →
See also: market overview · valuation map · stock screeners