EL5-Energo: Q1 2026 revenue up 24.5%, but EBITDA down 4.1% on higher costs
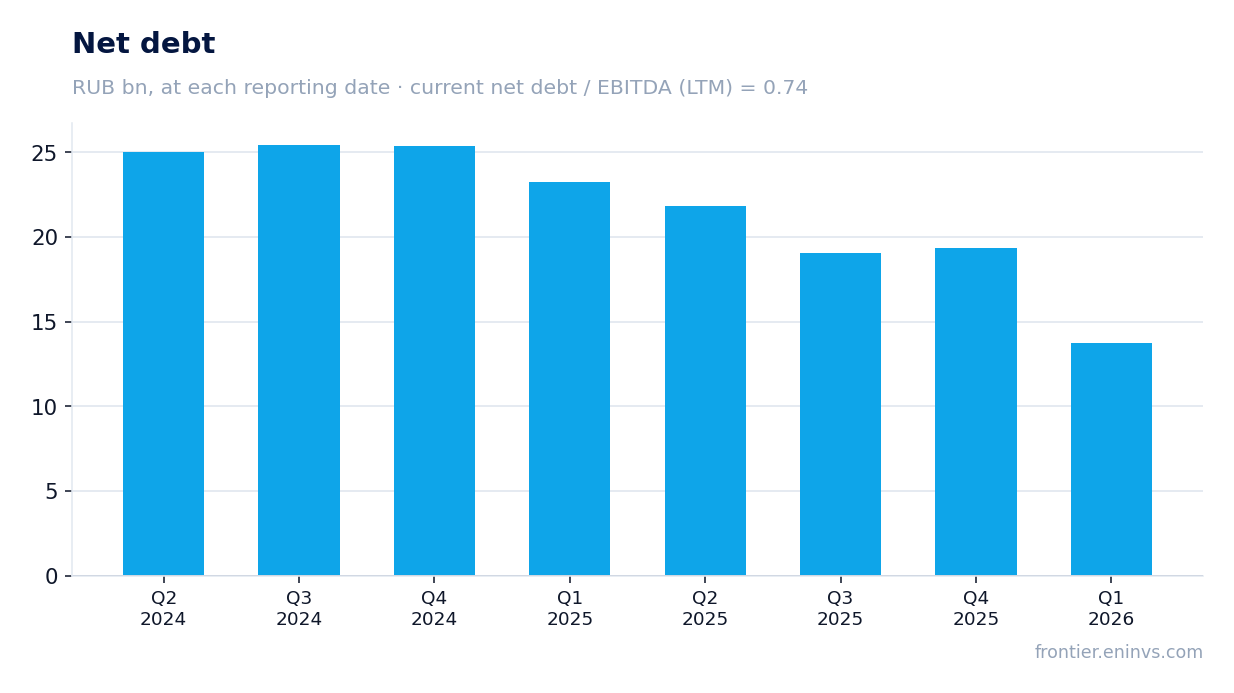
In Q1 2026, EL5-Energo's revenue increased 24.5% year-on-year to RUB 27,007.7 million, but EBITDA fell 4.1% to RUB 5,134.9 million, while net profit rose 2.2% to RUB 2,532.3 million. EBITDA margin contracted from 24.7% to 19.0%, indicating faster growth in operating costs. The company continues to reduce debt: net debt decreased by RUB 5.8 billion quarter-on-quarter and by RUB 9.5 billion over 12 months, to RUB 13,754.0 million at the end of the period.
Key figures, RUB bn
| Metric | Q1 2025 | Q1 2026 | Change |
|---|---|---|---|
| Выручка / Revenue | 21,7 | 27,0 | +24,5% |
| EBITDA / EBITDA | 5,36 | 5,13 | -4,1% |
| Операционная прибыль / Operating profit | 4,51 | 4,29 | -4,9% |
| Чистая прибыль / Net profit | 2,48 | 2,53 | +2,2% |
| Операционный денежный поток / Operating cash flow | 5,09 | 8,40 | +65,1% |
| Капзатраты / Capex | — | 1,03 | — |
| Рентабельность по EBITDA / EBITDA margin | 24,7% | 19,0% | -5,7 п.п. |
| Чистая маржа / Net margin | 11,4% | 9,4% | -2,0 п.п. |
What the report showed and what drove it
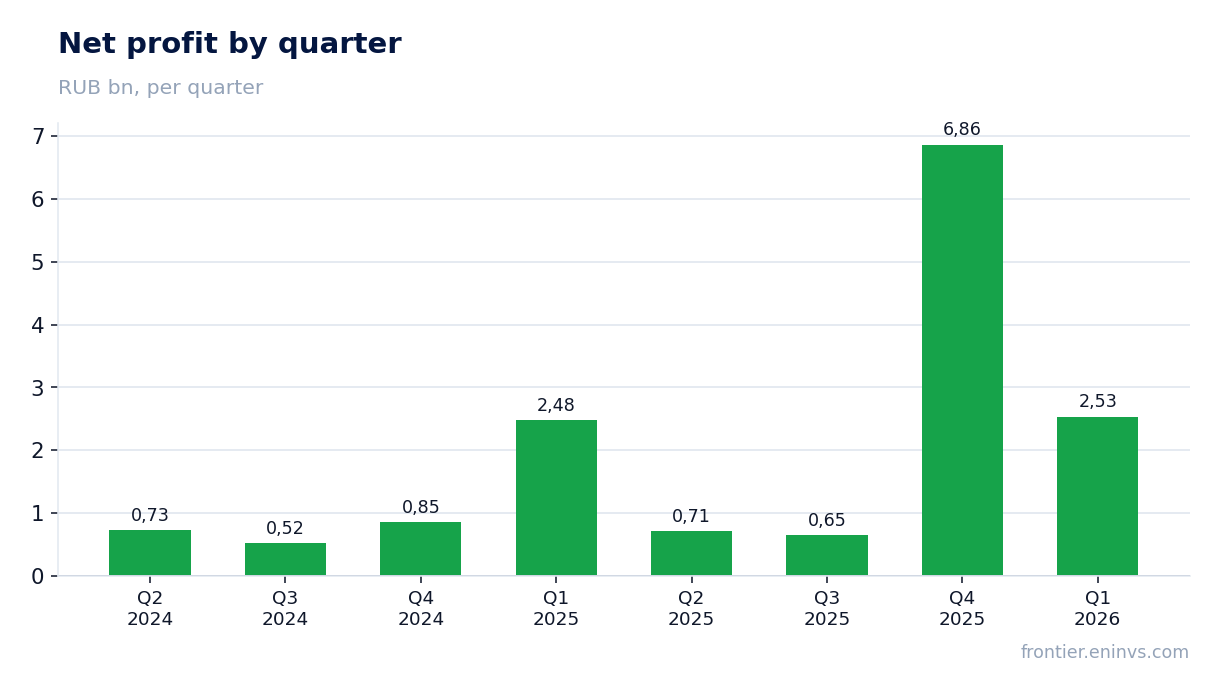
Net profit for the reporting period increased 2.2% to RUB 2,532.3 million, notably slower than revenue. This is due to faster growth in operating expenses, which affected EBITDA. Nevertheless, profit remains positive and sufficient to service debt.
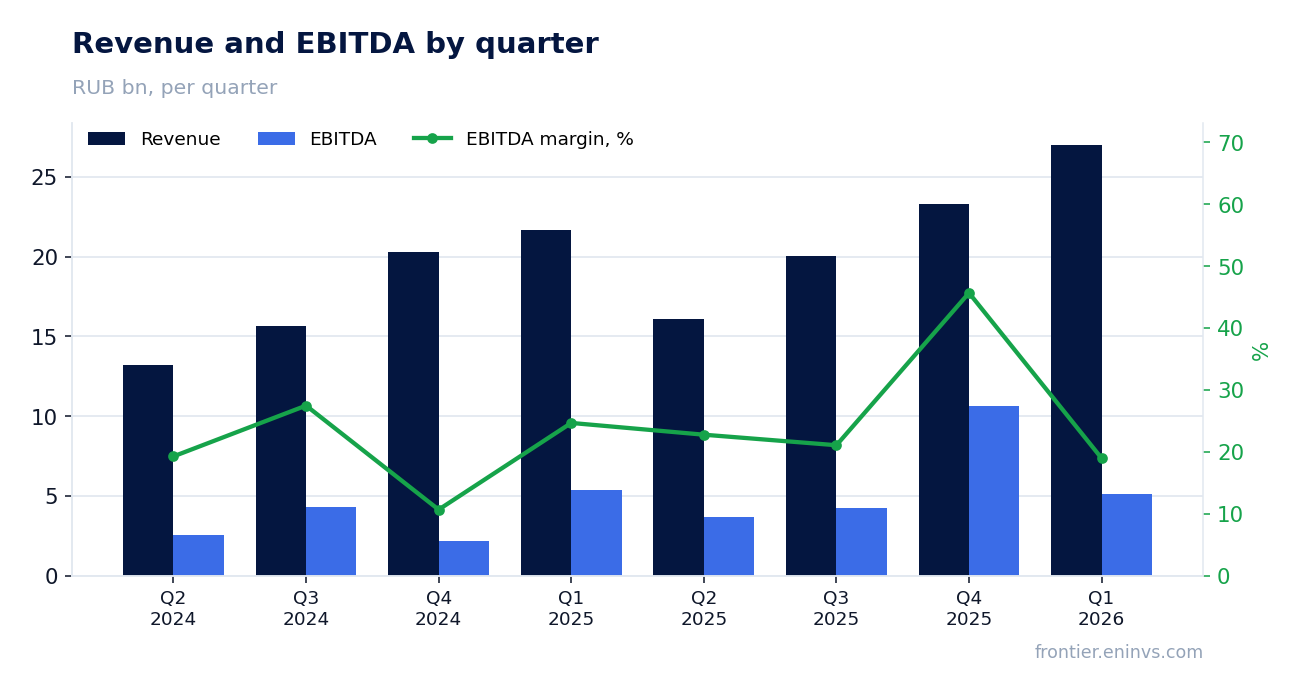
Margins and costs
Operating profit in the reporting quarter was RUB 4,285.3 million, lower than EBITDA but still a significant amount. The rise in costs is likely related to higher fuel prices and maintenance works, typical for the industry.
Debt, cash flow, capex
Operating cash flow in Q1 2026 was RUB 8,398.2 million, significantly exceeding capex of RUB 1,025.1 million. This provides positive free cash flow and supports debt reduction.
Valuation and what to watch in the next report
In the next report, watch for EBITDA and margin dynamics: whether the company can restore margins above 20%, and continued reduction in net debt. An important factor will be maintaining positive operating cash flow to fund capex and dividends.
Valuation on the latest reported figures
| Metric | Value |
|---|---|
| Капитализация / Market cap | 12,0 млрд ₽ |
| P/E (LTM) | 1,1 |
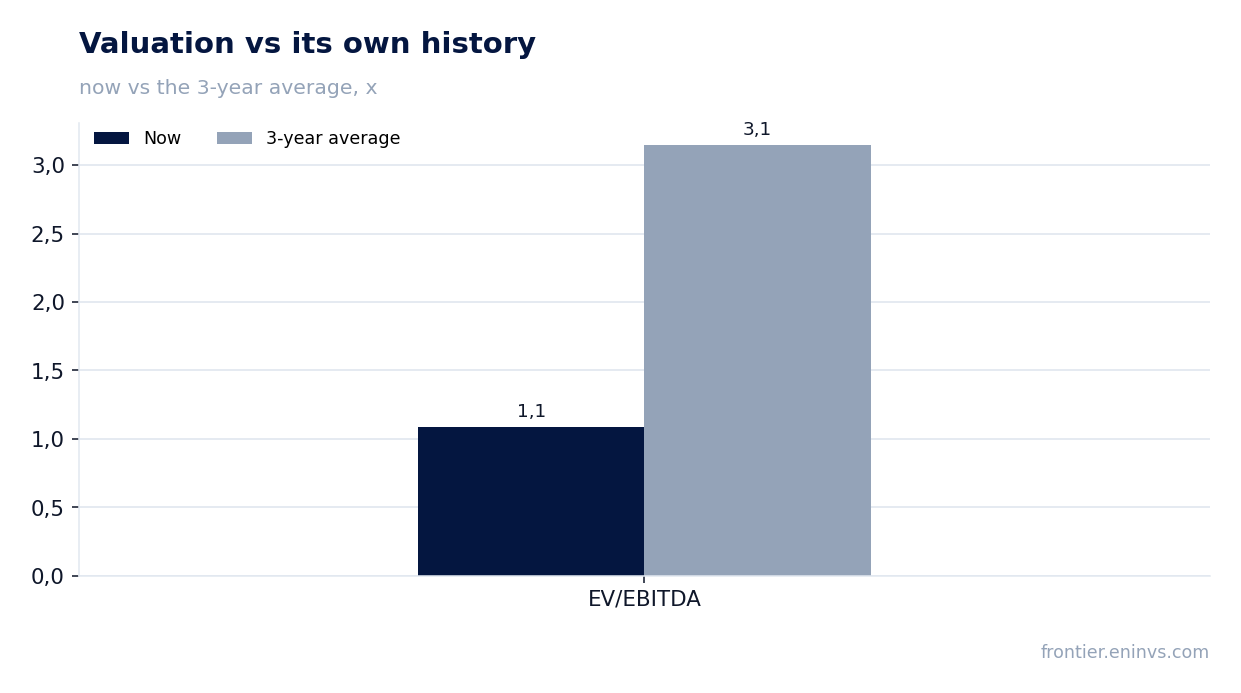
| EV/EBITDA (LTM) | 1,1 |
| P/B | 0,35 |
| Чистый долг / EBITDA (LTM) | 0,74 |
| Операционный денежный поток (LTM) | 20,4 млрд |
| ROE | 22,1% |
| EV/EBITDA, среднее за 3 года | 3,1 |
Open the company's financial profile ELFV →
See also: market overview · valuation map · stock screeners