Element: revenue held up, but the half-year closed in the red on one-off write-offs and an inventory provision
On 28 August, PJSC Element released its results for the first half of 2026. Revenue declined 2.0% year on year to RUB 15,781 mn, EBITDA came in at minus RUB 1,053 mn against a 22.3% margin a year earlier, and the net loss was RUB 2,960 mn. Operating cash flow nevertheless remained positive at RUB 2,787 mn, and net debt as of 30 June 2026 stood at minus RUB 2,575 mn, meaning the company retains a net cash position. In our view the share looks unattractive: an EV/EBITDAC LTM multiple of 8.7 against negative reported-half EBITDA, and the portal model implying 98% downside to fair value.
Key takeaways
— Revenue slipped only 2.0%, but the electronic component base lost RUB 1,259 mn.
— EBITDA went negative at minus RUB 1,053 mn on a RUB 1,324 mn inventory provision and RUB 607 mn of write-offs.
— Operating cash flow stayed positive at RUB 2,787 mn, supported by a RUB 5,573 mn increase in payables.
— Net debt as of 30 June 2026 was minus RUB 2,575 mn versus minus RUB 2,400 mn at end-2025.
— No dividends were paid over the last 12 months, and the payout history is limited to RUB 0.0018 per share for 2024 and RUB 0.0035 for 2025.
— An EV/EBITDAC LTM of 8.7 and the portal model's 98% downside to fair value leave no room for a premium to the company's own history.
Attractiveness
Key figures, RUB bn
| Metric | H1 2025 | H1 2026 | Change |
|---|---|---|---|
| Revenue | 16.1 | 15.8 | -2.0% |
| EBITDA | 3.59 | -1.05 | -129.3% |
| Operating profit | 2.41 | -2.41 | -200.0% |
| Net profit | 2.01 | -2.96 | -247.2% |
| Operating cash flow | -0.97 | 2.79 | to profit |
| Capex | 4.61 | 2.11 | -54.2% |
| EBITDA margin | 22.3% | -6.7% | -29.0 pp |
| Net margin | 12.5% | -18.8% | -31.3 pp |
Revenue slipped only 2.0%, but the electronic component base lost RUB 1,259 mn.
Revenue for the first half of 2026 was RUB 15,781 mn, 2.0% below the same period last year. The decline looks moderate against the report's description of a deteriorating sales market and a substantial rise in raw material prices. The core segment – electronic component base – brought in RUB 11,166 mn versus RUB 12,425 mn a year earlier, losing RUB 1,259 mn and dragging revenue down.
Other areas partly offset the shortfall. Electronic units and modules grew to RUB 2,041 mn from RUB 1,424 mn, and precision engineering to RUB 1,872 mn from RUB 1,460 mn. Geographically, sales in Russia were almost flat at RUB 14,737 mn versus RUB 14,746 mn, while shipments to China more than halved to RUB 358 mn from RUB 781 mn.
The contract-type split shows serial contracts falling to RUB 10,964 mn from RUB 11,760 mn, while project-type revenue rose to RUB 3,790 mn from RUB 3,549 mn. This means the company is increasingly reliant on long project work, where revenue recognition is stretched over time and advance payments play a larger role.
EBITDA went negative at minus RUB 1,053 mn on a RUB 1,324 mn inventory provision and RUB 607 mn of write-offs.
EBITDA for the first half of 2026 was minus RUB 1,053 mn against a positive figure a year earlier, when the margin reached 22.3%. Operating loss was RUB 2,408 mn, and net loss RUB 2,960 mn versus a profit in the same period last year. The swing was driven not only by lower revenue: the cash flow statement shows a RUB 1,324 mn inventory provision and a RUB 607 mn loss on disposal and impairment of assets.
These two items are one-off in nature and not directly related to operations. Without them, EBITDA would have remained positive, albeit well below last year's level. The company also received RUB 596 mn in government subsidies, which were excluded from cash flow before working capital changes, further distorting comparability.
The EBITDA margin in the reported half was minus 6.7% versus 22.3% a year earlier. The net margin went to minus 18.8% from plus 12.5%. This decline is the result of a combination of weak revenue, one-off write-offs and cost inflation described in the report.
Operating cash flow stayed positive at RUB 2,787 mn, supported by a RUB 5,573 mn increase in payables.
Operating cash flow for the first half of 2026 was RUB 2,787 mn, compared with negative RUB 972 mn a year earlier. This swing, despite negative EBITDA, is explained by working capital changes: payables and contract liabilities increased by RUB 5,573 mn, providing the main inflow. Inventories rose by RUB 1,680 mn, and receivables and advances by RUB 1,044 mn.
Capital expenditure for the half-year was RUB 2,114 mn, of which RUB 1,042 mn went to fixed assets and RUB 1,072 mn to intangible assets. Free cash flow thus remains positive, but its quality is questionable: it is generated not by profit but by deferring payments to suppliers.
Interest received brought in RUB 488 mn, partly offsetting RUB 1,110 mn of interest paid. The company continues to service its debt despite the loss and retains a substantial cash cushion of RUB 24,029 mn at the end of June.
Net debt as of 30 June 2026 was minus RUB 2,575 mn versus minus RUB 2,400 mn at end-2025.
Net debt as of 30 June 2026 was minus RUB 2,575 mn, meaning the company retains a net cash position. At 31 December 2025 the figure was minus RUB 2,400 mn, so over six months net debt changed by minus RUB 0.2 bn. A year earlier, at 30 June 2025, net debt was plus RUB 9,100 mn, and over twelve months it declined by RUB 11.7 bn to the current level.
The net debt to EBITDA LTM ratio is minus 9.5 – a negative value reflecting the net cash position and positive EBITDA over the last twelve months. At the same time, EBITDA LTM is RUB 271 mn, which is incommensurate with the scale of the business and makes the EV/EBITDA LTM multiple of 158.3 uninformative.
The company raised RUB 687 mn in new borrowings and repaid RUB 1,630 mn in the first half. Interest paid of RUB 1,110 mn exceeds the EBITDA generated, putting pressure on liquidity despite the substantial cash cushion.
No dividends were paid over the last 12 months, and the payout history is limited to RUB 0.0018 per share for 2024 and RUB 0.0035 for 2025.
Over the last twelve months the company paid no dividends. No payments were made in calendar 2026 either, and no further payout is pencilled in for this year. The history is limited to symbolic amounts: RUB 0.0018 per share for 2024 with a 0.9% yield at the ex-date, and RUB 0.0035 for 2025 with a 2.6% yield.
Our estimate of a fair yield for this name is 7.0%, which corresponds to the central bank key rate of 14.0% adjusted for a risk premium. At the current price and with zero payments, the dividend component of return is absent. The implied payout ratio is 0.21 of profit, but the base for it is a loss in the reported period, making any payouts in the foreseeable future unlikely.
The company's dividend policy is not disclosed in the provided materials, but the practice of the last two years shows that even with profit, payouts remain minimal. For an income-oriented investor, the share holds little interest until sustainable profit and a clear dividend policy emerge.
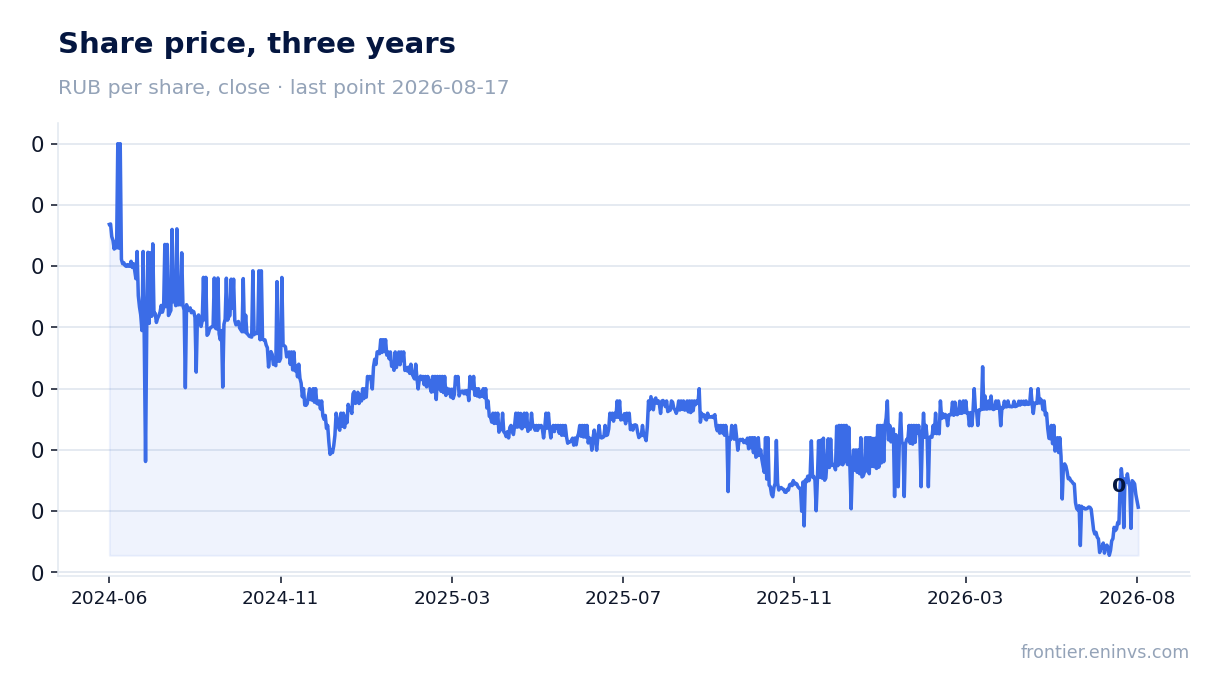
An EV/EBITDAC LTM of 8.7 and the portal model's 98% downside to fair value leave no room for a premium to the company's own history.
The EV/EBITDAC LTM multiple is 8.7, which accounts for capitalised development costs and therefore more accurately reflects the business's ability to generate cash flow than EV/EBITDA. For comparison, EV/EBITDA LTM is 158.3, but this figure is distorted by the low EBITDA base over the last twelve months – just RUB 271 mn. With a market capitalisation of RUB 45,305 mn and negative EBITDA in the reported half, the valuation looks stretched relative to current earnings power.
Our fundamental valuation model, based on EBITDA growth and a target multiple, implies 98% downside to fair value. This means that at the current price the share trades at a huge premium to the value the business generates in its current state. The model is not a market consensus and reflects our own assumptions.
Return on equity is negative at minus 16.3%. The company is burning capital, and a reversal requires EBITDA to turn positive and revenue to grow sustainably. Until that happens, the valuation cannot be considered attractive.
Valuation on the latest reported figures
| Metric | Value |
|---|---|
| Market cap | 45.3 bn ₽ |
| EV/EBITDA (LTM) | 158.3 |
| EV/EBITDAC (EBITDA less capitalised development) | 8.7 |
| P/B | 1.18 |
| Net debt / EBITDA (LTM) | -9.50 |
| Operating cash flow (LTM) | 3.71 bn |
| ROE | -16.3% |
Dividend per share, ₽, and yield at the ex-date
| Year paid | Dividend | Yield |
|---|---|---|
| 2024 | 0.00 | 0.9% |
| 2025 | 0.00 | 2.6% |
Bottom line
The report's strengths are the retained net cash position and positive operating cash flow, but the latter is generated not by profit but by deferring payments to suppliers. One-off write-offs of RUB 1,324 mn and RUB 607 mn explain most of the loss, yet even without them EBITDA would have been well below last year's level. Revenue held up better than might have been expected, but the structural shift towards project work and the fall in sales to China raise questions. With EV/EBITDAC LTM at 8.7 and the portal model implying 98% downside to fair value, the share looks unattractive. A sustained turnaround in EBITDA to positive territory and revenue growth in the core segment would be needed to change the verdict.
Open the company's financial profile ELMT →
See also: market overview · valuation map · stock screeners